SOCIAL METRICS APPLIED TO SMART TOURISM
Ofelia Cervantes*, Ernesto Guti´errez, Francisco Guti´errez, J. Alfredo S´anchez
Universidad de las Am´ericas Puebla Ex-Hacienda Santa Catarina M´artir, Cholula
72810 Puebla Mexico
(ofelia.cervantes, ernesto.gutierrezca, francisco.gutierrez, alfredo.sanchez)@udlap.mx
KEY WORDS:Smart City, Smart Recommendation, Social Network Analysis, Graph Processing, User Model, Object of Interest Model
ABSTRACT:
We present a strategy to make productive use of semantically-related social data, from a user-centered semantic network, in order to help users (tourists and citizens in general) to discover cultural heritage, points of interest and available services in a smart city. This data can be used to personalize recommendations in a smart tourism application. Our approach is based on flow centrality metrics typically used in social network analysis: flow betweenness, flow closeness and eccentricity. These metrics are useful to discover relevant nodes within the network yielding nodes that can be interpreted as suggestions (venues or services) to users. We describe the semantic network built on graph model, as well as social metrics algorithms used to produce recommendations. We also present challenges and results from a prototypical implementation applied to the case study of the City of Puebla, Mexico.
1. INTRODUCTION
A smart city is characterized by a holistic approach in the use of information and communication technologies for improving urban services in at least one of six dimensions: people, govern-ment, economy, mobility, environment and living (Anthopoulos et al., 2015). In this context, the tourism sector can be classi-fied as an overlapping subproblem of mobility and economy di-mensions since tourism has the potential of enhancing the urban competitiveness of the city (Singhal et al., 2013) and represents a challenge in terms of mobility in certain periods of the year.
The widespread range of venues and services provided by a smart city makes it difficult for tourists to select an appropriate venue to visit according to their preferences. Tourists typically follow the “closest next” strategy to visit a point of interest (POI) or to use a service. However, they may be also interested in understanding how POIs are semantically (or conceptually) related (Wolff and Mulholland, 2015).
Several approaches have been proposed to tackle the problem of automatically selecting, from a list of items, those that really con-tribute to satisfying the needs of end users. Approaches based on demographics or user profile models are oriented to exploit user features and preferences for filtering available choices. Key contributions of this paper include a user model and an object model based on ling¨uistic features to represent user preferences and item characteristics, where items in our application domain refer to points of interest.
Modeling social and semantic networks using graphs has opened opportunities for exploring alternatives for implementing recom-mender systems. Social metrics, such as flow centralities that are calculated on graph-based models provide interesting measures to represent the semantic predominance of concepts featuring user’s preferences as well as item characteristics. We provide a detailed description of our model as well as the challenges to implement our approach as a complete recommendation strategy that can be integrated into recommendation systems.
The remainder of the paper is structured as follows: Section 2 presents related work. Then, Section 3 introduces the
graph-based model we propose to represent user preferences and item characteristics as a semantic network. Section 4 discusses se-lected graph algorithms used to calculate social metrics, particu-larly flow centralities. Next, Section 5 describes a prototype we developed in order to validate our approach. Performance chal-lenges are discussed. Finally, in Section 6 we report the main results we have obtained thus far and discuss future work.
2. RELATED WORK
The ever increasing amount of information that has been accumu-lated in social media can be utilized in order to improve services in a smart city. The rich knowledge that can be extracted from so-cial media can be used, for example, to enhance recommendation systems, or to improve citizen experience, or to generate novel services. In this paper, we focus on extracting knowledge to en-hance recommendation systems, specifically, for a smart tourism application.
Recommendation systems that are based on knowledge use in-formation about how selected items meet user needs (Bobadilla et al., 2013). In this type of system, the knowledge extracted is used to build a relationship between users and points of in-terest. In general, a recommender system comprises five fun-damental components: user model, community (social network), object of interest model, recommendation algorithm and interac-tion strategy (Zanker and Jessenitschnig, 2009). Here, we present a brief overview of related work regarding knowledge-based rec-ommender systems focused on the building components in which we have made a contribution.
2.1 User Modeling
fuzzy logic and proposed an approach to infer the degree of genre presence in a movie by considering the tags assigned by users. In (Zanker and Jessenitschnig, 2009), the authors present a sim-ple attribute-value pair dictionary to model the user through the explicit elicitation of user requirements. A richer user model is presented in (Eyharabide and Amandi, 2012), where the authors used a machine learning process to capture the user profile and context into a domain ontology.
Our work tries to balance between simple (Zanker and Jessen-itschnig, 2009) and complex models (Eyharabide and Amandi, 2012) with the goal of having an efficient but still rich user model. Other works, like Cantador et al. and Moahedian et al. (Cantador et al., 2008, Movahedian and Khayyambashi, 2014), are similar to our proposed user model, since we use tags and keywords to build a lax ontology.
2.2 Recommendation Algorithms and Techniques
A wide range of recommendation algorithms and techniques have been reported in the literature. They vary mostly in data avail-ability, recommender filtering type as well as user and object representations. Various methods have demonstrated acceptable performance, including: Bayesian networks (de Campos et al., 2010), nearest neighbors (Bobadilla et al., 2011), genetic algo-rithms (Hwang et al., 2010), neural networks (Bobadilla et al., 2012), clustering (Shinde and Kulkarni, 2012), association rule learning (Zanker and Jessenitschnig, 2009), and latent semantic features. More details on these and other methods can be found in (Bobadilla et al., 2013).
In this work, we rely on graph centrality metrics commonly used in social network analysis (Thovex and Trichet, 2013). We pro-pose semantic social network analysis that integrates semantic methods of knowledge engineering and natural language process-ing with classic social network analysis. Advantages of semantic social network analysis include its knowledge foundation and its non-probabilistic nature. In contrast, one disadvantage is its com-putational cost. Enhancement techniques are thus needed in order to process graph centrality metrics more efficiently.
2.3 Information Extracted from Social Networks
With the success of emerging Web 2.0 and various social network websites, recommender systems are creating unique opportuni-ties to assist people in finding relevant information when brows-ing the web and makbrows-ing meanbrows-ingful choices. In (Chang and Chu, 2013), the author has proposed a novel approach for recommen-dation systems based upon data collected from social networks.
In the work of (Wang et al., 2013) the problem of recommending new venues to users who participate in location-based social net-works (LBSNs) is studied. They propose algorithms that create recommendations based on past user behavior (visited places), the location of each venue, the social relationships and the simi-larity among users.
In the work of (Ye et al., 2010) the social and geographical char-acteristics of users and locations to research issues for offering location recommendation services for large scale location based social networks are utilized. They observed the strong social and geospatial ties among users and their favorite locations in the sys-tem via the analysis of datasets collected from Foursquare.
Similar to our work, in (Saiph Savage et al., 2012) the design of a more complete, ubiquitous location-based recommendation algorithm that is based on a text classification problem is investi-gated. The system learns user preferences by mining a person’s
social network profile. The author also defined a decision-making model, which considers the learned preferences, physical con-straints, and how the individual is currently feeling.
We can state that novel approaches rely mainly on the fusion of information inferred from a user’s social network profile and other data sources (e.g. mobile sensors). In this sense, it is nec-essary to develop new strategies that produce recommendations from rich but still incomplete information.
3. GRAPH MODEL
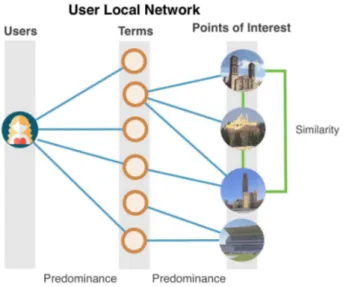
Our approach is based on a graph representation of users and points of interest linked through concepts (denoted as terms). Figure 1 shows the graph model where every node falls into one of three categories:User,TermorPoint of Interest, whereas every edge represents the semantic relation between nodes: Predomi-nance,SimilarityorFriendship. EveryTermnode of the graph in Figure 1 acts as a semantic descriptor of bothUsersandPoints of Interest. In other words, every user and every POI are cor-respondingly described by the terms linked to them. In general, users are described by their tastes, preferences, and interests (user model) whereas POIs are described by tags and keywords (here we refer to POIs as object model). In this manner, when a term is shared between a user and a POI, it shows the possibility that the user could be interested in that particular POI, even though the POI has never been seen or rated by the user.
A graph-based representation allows us to apply graph algorithms (e.g. centrality metrics) to discover topological features, key re-lationships, and important (prestigious) nodes. Then, with these features we can make relevant recommendations to users, such as suggesting friends or venues. Therefore, the foundation of our recommender system relies on a knowledge base constructed from both auser model(see section 3.3) and anobject model (see section 3.4).
In order to construct the user and object models, we applied a lin-guistic analysis over user and object text descriptions. Basically, we conducted pre-processing (removal of stopwords and selec-tion of most descriptive words) and statistical linguistic analy-sis (using weighting schemes: tf-idf and okapi BM25) to define a bond between text descriptions and semantic relations repre-sented in the graph (see section 3.2). It is possible to obtain user and object descriptions from social networks (Facebook, Twit-ter, Foursquare), web pages (Wikipedia, web search results, etc.), human experts contributions or other textual resources.
3.1 Weighted Graph Definition
Formally, we define a weighted graph G = (V, E, fE)where V = {v1, . . . , vn}is a set of vertices,E = {e1, . . . , en} ⊂ {{x, y} |x, y∈V}is a set of edges, and fE : E → Rthe function on weights for every edge. In our recommender sys-tem,V =U∪T ∪OwhereUis the set of users,Tis the set of terms, andOis the set of objects of interest. AndE=P∪S∪F whereP is the set of predominance edges,Sthe set of similar-ity edges, andF is the set of friendship edges. FunctionfE is adapted according to each type of edge. For instance, we can ob-tain the sub-graph of users asGU = (U, F, fF)(see User layer in Figure 1), the sub-graph of objects asGO = (O, S, fS)(see Points of Interest layer in Figure 1), and the sub-graph of user and object profiles asGU∪T∪O= (U∪T∪O, P, fP).
3.2 Semantic Relations
Figure 1: Graph model. Node layers: User, Term, and Points of Interest linked trough Friendship, Predominance and Similarity edges.
we have two collections: the users text collection (UTC) and the POIs text collection (POITC), where each text description is con-sidered a documentDin a vector space model.
We define three types of semantic relations (edges of the graph): predominance, similarity, and friendship. Each semantic relation links different types of nodes and has a different weighting func-tion. Predominance is the edge between a user or an object and a term, similarity is the edge between two objects and friendship is the edge between two users.
Predominanceis the semantic relation between a term and a user or an object. A term acts as a descriptor of users and POIs. We de-fine a weighting function over the edge of predominance based on linguistic analysis. We apply the Okapi BM25 ranking function (Robertson and Zaragoza, 2009) to each independent document collection (UTC and POITC) using Equation 3.
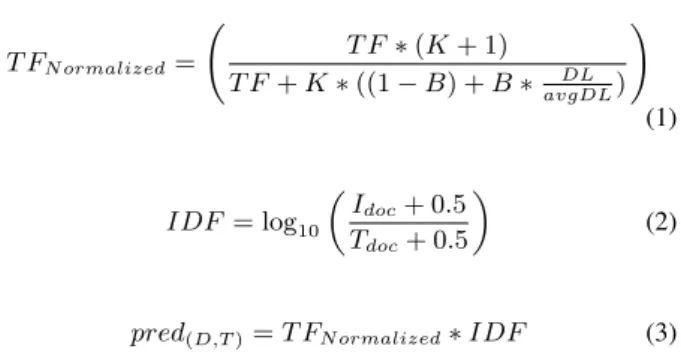
In Equation 3,predis the predominance of the termT in docu-mentD,Idocis the number of indexed documents (size of collec-tion),Tdocis the number of documents containing termT,T Fis the term frequency relative to documentD,DLis the document length,avgDLis the average document length among the entire collection,KandB are free parameters (usuallyK = 1.2and B= 0.75).
T FN ormalized= T F∗(K+ 1)
T F+K∗((1−B) +B∗ DL avgDL)
!
(1)
IDF= log10
Idoc+ 0.5
Tdoc+ 0.5
(2)
pred(D,T)=T FN ormalized∗IDF (3)
Similarityis the semantic relation between two POIs. This mea-sure indicates the degree of affinity between POIs. We apply the cosine similarity measure (Equation 4) to obtain this value. The Similarity is calculated after the predominance, since it relies on shared terms. Then, every object is a vector of predominances as shown below Equation 4.
Similarity(A,B)=cosΘ = A·B
kAk kBk (4)
P OIA=
pred(A,T1), pred(A,T2),· · ·, pred(A,Tn)
P OIB=
pred(B,T1), pred(B,T2)· · ·, pred(B,Tn)
In Equation 4, the similarity between POI A and POI B is de-termined by the weights of the terms they have in common. In this manner, a high similarity value indicates a higher semantic correspondence between POIs.
Friendshipis the semantic relation between two users. This mea-sure indicates the degree of affinity between two users. Our cur-rent model does not distinguish between close friends, friends or acquaintances. Therefore, the users’ sub-graph is only a friend-of-a-friend (FOAF) node-link type.
3.3 User Model
As part of the graph-based representation, users are defined as sub-graphs. A user model is composed of two sub-graphs: user profileGu= (u, P, fP)and user FOAF networkGU= (U, F, fF). Figure 2A shows the user profile network, whereas 2B illustrates the user’s FOAF network.
In the user profile sub-graph, each user is linked to a set of terms that indicate tastes, preferences and interests. Tastes are general inclinations of user towards some entities and they are generally expressed with actions such as likes (e.g. Foursquare, check-ins and Facebook likesfootball, beer, steak, coffee, etc). Preferences are user inclinations towards taste features. Preferences are more fine-grained than tastes and are usually expressed in users’ re-views and ratings (e.g. starred rere-views:I like the double espresso, I don’t like diet soda). Interests are defined as contextual user in-clinations or intentions (e.g. I want to try Chinese food, I’m going to watch a minions movie).
fP =
pred(U,T) Case A
1 Case B
#stars−2∗1
3 Case C
(5)
Our scheme to weight edges within a user profile is indicated in Equation 5. Case A occurs when only text descriptions are used; this means that terms are weighted according to the Okapi measure (pred, as shown in Equation 3). Case B occurs when explicit likes are found in Foursquare or Facebook. Case C occurs when terms extracted from starred reviews are used to describe a user. In addition to Equation 5, we use a threshold value to limit the number of terms connected with a given user. In fact, we use the first quartile as threshold value. An example of user profile is shown in Figure 2A, where, it is possible to notice that a user likes football, rock and coffee, and is likely that the user is a student. In user friendship networks, as mentioned earlier, there are no differences among friendship types. Then, in FOAF network all weights are equal to 1 (fF = 1). A user FOAF network is shown in Figure 2B.
3.4 Object Model (Points of Interest)
Figure 2: a) User profile and b) User FOAF Network
be coarse-grained as a point of interest (POI) or fine-grained as items inside places. An object is described by the category to which it belongs (e.g. Cathedral is a Christian Church). It is also described by tags designed by users or keywords found in ob-ject’s description. The object model consists of two sub-graphs: object profileGo = (o, P, fP)and object similarity sub-graph GO = (O, S, fS). An object profile is built with data gathered from Foursquare, Wikipedia and results from web searches. The weights of edges that link objects and terms are calculated using the predominance formula shown in Equation 3. This means that the weight function on edges isfP =pred(O,T).
3.5 User Global and Local Network
In order to apply social metrics (centrality measures) and relate them to pertinent recommendations, we defined two networks from user perspective: a user global network (U GNu) and a user local network (U LNu). By user global network we refer to the whole graph (all nodes: usersU, termsT and objectsOand all edges: similaritiesS, predominancesP and friendshipsF) cen-tered in current user. Therefore,U GNu= (U∪T∪O, S∪P∪F)
(see Figure 1). Whereas user local network is the sub-graph de-fined by current user node u, term nodes adjacent to userTu and object nodes adjacent to terms nodeOT linked trough pre-dominance edges from userPuand from objects PO. Hence, U LNu = (u∪Tu∪OT, Pu∪PO)(see Figure 3). It is im-portant to highlight the difference between user global and local networks, since it will lead to different semantics interpretations when calculating centrality measures over them.
Figure 3: User Local Network
4. CENTRALITY MEASURES AND RECOMMENDER
ENGINE
Centrality measures have been used extensively to exploit net-works and discover the relevancy of nodes in a graph. In social network analysis (SNA) graph centralities are used to identify the most important persons, communities and detect strange behav-iors in the network. However, given the popularity of social net-works, people have increased their interaction not only to meet people and friends but also to search things they like, express their opinions, and find points of interest and objects of interest. These spatio-temporal interactions can also be represented in a graph, thus, an accurate user profiling representation can give us a great deal of insight about the user behavior. Because of these approaches in utilizing graph measures we have explored the use of centralities to take advantage of the topological structure of our users’ global network and flow centrality to get the most of our weighted global and local networks in terms of a recommender engine.
4.1 Centrality Algorithms
Centrality in graphs is widely used to measure the importance of a node in a graph, especially in SNA (Le Merrer and Tr´edan, 2009). Our recommender engine implements these centralities to measure the relevance of people in the social network. Some centrality measures like closeness and betweenness are based on the calculation of the shortest distance to reach all other nodes in the graph. Our algorithms to calculate centralities are applied to the network of persons so we can infer the most popular nodes (degree), the capacity of a node to reach any other in the network (closeness), and to identify the leaders interconnected within a neighborhood in the graph (betweenness) (Newman, 2005). De-gree centrality is a measure that counts the direct relationships a node has, and thus, the nodes that are in direct contact. Closeness is defined as the inverse sum of the shortest paths between any two nodes and betweenness is defined as the number of shortest paths from all vertices to all others that pass through that node. Centrality measures are calculated over the network at a topolog-ical level given a scale-free graph of persons. Thus, these mea-sures are not exploiting our weighted graph, they are applied only at a social-network level. Terms and objects of interest can be seen as sub-graphs of the global network that can be exploited by using flow-based centrality measures.
4.2 Flow-Centrality Algorithms
We are using flow centralities (Newman, 2005) to measure the betweenness, closeness, and eccentricity between the objects of interest, terms, and people profiles. Flow centralities allow us to exploit the semantic relationships between the user and the pro-files of the objects of interest. Flow centralities reveal the most relevant nodes in the graph given their weights. For instance, given a set of terms associated to a user profile, we can better understand user preferences and give a better recommendation.
Figure 4: “You can’t miss” as a result of computing flow between-ness.
betweenness, in our recommender model, a node with high be-tweenness should be recommended as the things the user cannot miss (see Figure 4).
Fb(i) =
Pn
j<kmjk(xi) Pn
j<kmjk
(6)
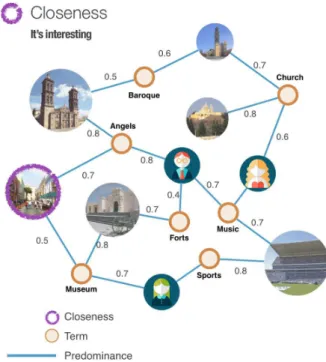
4.2.2 Flow Closeness: Closeness is just a measure of distance and is defined as the inverse of the average distance to other ver-tices. A node with high flow closeness centrality has a fast com-munication within all the nodes in the graph. In equation 7, flow closeness is defined as the inverse sum of the max flow to every other resource. In our recommender model, elements with high flow closeness should be recommended to the user as things that could be interesting, because those weighted elements are close to the user profile (see Figure 5).
Fc(i) =Pn 1 j<kmjk(xi)
(7)
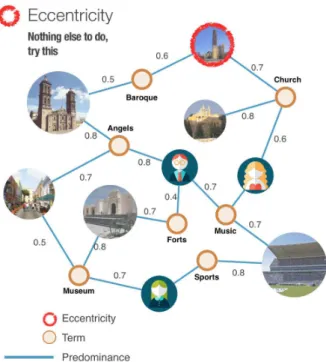
4.2.3 Eccentricity: On the other hand, eccentricity is the max-imum distance taking into consideration the weighted paths of the network. Eccentricity lets us find the nodes that are far away from the most central node in the network. In Equation 8 eccentricity is defined as the maximum distance between pairs of nodes given their maximum flow in the network. In our recommender model, an item with high eccentricity should be recommended if the user has nothing left to do and would like to discover something dif-ferent (see Figure 6).
Fe(i) =maxjǫv
X
mjk(xi) (8)
4.3 Graph recommendations
As we have shown, our recommender model relies on the contin-uous computation of predominance and similarity between items in the graph. As the graph evolves from interactions between the user and objects of interest, recommendations get more accurate
Table 1: Centrality-based recommendations.
Measure Recommendation
Similar nodes What else? Flow betweenness You can’t miss Flow closeness Also discover Eccentricity Be different
over time. However, in order to give recommendations, the com-putation of centralities is required. As shown in Table 1, we can recommend similar items if the user is asking “What else?”, then we can suggest items that are similar to the recommended item. Flow betweenness is used to recommend things the user “can’t miss” because of their relevance in the network. Flow closeness is used to recommend central items that the user “would like to discover”, whereas eccentricity is used to show items that are far away from the more central nodes in the network and could cause a “being different” impression.
5. IMPLEMENTATION
We have implemented the model discussed above as well as graph measures calculation in a weighted graph. We explored different graph databases and graph processing frameworks in order to se-lect tools that could give us flexibility to calculate those metrics with ease when building a graph processing framework.
5.1 The Census framework
We defined an architecture (see Figure 7) based on the graph model discussed previously. Our graph processing framework (which we named “Census”) has been built with the Play frame-work1and is intended to have multiple instances of Signal/Collect while processing our graph in the Google Compute Engine 2. Census uses the Neo4j3Graph database to store the graph. Neo4j
provides flexibility to issue queries over the computed network
Figure 5: “Could be interesting” as a result of computing close-ness.
1https://www.playframework.com/
2https://cloud.google.com/compute/
Figure 6: “Nothing else to do? Try this” as a result of computing betweenness.
through custom plugins that serve queries through a REST API. Census processes requests from Census Control which uses an orchestrator to administrate compute requests and instances of Census in the graph.
5.2 Proof of concept
With Census we explored a first approach to implement our rec-ommender model. The graph database was populated with nodes of persons and points of interest from the city of Puebla, Mex-ico, then we selected documents from the Web to create a profile of the points of interest using our semantic approach described before. We created different users with their respective profiles setting them with random characteristics as weights in the rela-tionships of the graph. We calculated similarities between those points of interest and the terms describing them. The result was a large graph database with approximately 3,000 nodes and 10,000
Figure 7: Architecture of Census, graph processing framework.
Table 2: Centrality computation results
Point of Interest Flow Flow Flow Betweenness Closeness Eccentricity
Centro Expositor 0.00 0.00 0.39
Africam 1.05 0.04 0.28
Museo Revoluci´on 6.00 2.08 0.46 Convento Sta. Monica 2.21 0.73 0.46
Museo Amparo 0.00 0.00 0.65
Museo Regional Puebla 2.77 1.04 0.65 Fuerte Loreto 0.00 0.00 0.78 Casa Alfe˜nique 0.00 0.00 0.78 Catedral Puebla 7.13 1.01 0.31 Exconvento Calpan 0.00 0.00 0.40 Convento San Gabriel 0.00 0.00 0.84
Capilla Rosario 0.00 0.00 0.84
Fuerte Guadalupe 0.00 0.00 0.23 Plazuela Sapos 2.04 0.16 0.35 Barrio Analco 0.00 0.00 0.41 Paseo San Francisco 0.00 0.00 0.25 Barrio Artista 0.00 0.00 0.25 Estadio Cuauht´emoc 1.05 0.12 0.85
weighted relationships. Over the global network we calculated the graph measures to discover the relevant nodes in the graph.
5.3 Results
After running all the algorithms, we focused our attention on the local network of a particular user. Results of centrality computa-tion are presented in Table 2. We can notice that higher central-ity measure values allow us to suggest the most relevant points of interest for this user. For example we can see that “Catedral Puebla” is an element with high betweenness, which means that it is a relevant place in the city and that element should be rec-ommended as “You can’t miss”. Another relevant element is the “Museo Revoluci´on” because it shows the highest flow closeness. In the case of flow eccentricity, we can see the elements that are far away from user preferences giving the opportunity to explore new things and try something different.
6. CONCLUSIONS
We have presented a first approach to a graph-based recommen-dation model that takes advantage of social metrics and recom-mends points of interest to citizens and visitors of a smart city. The proposed model expresses the semantics of relationships that exist between users and points of interest through terms that de-fine a profile for the items. This novel approach, using particu-larly flow centralities, considers semantic predominance of terms for defining and exploiting the relationships among user profile preferences as well as the descriptive characteristics of points of interest. Recommendations can then be extracted based on the knowledge represented in the graph.
In order to validate the recommendation model, a recommenda-tion engine was implemented and has shown that interesting rec-ommendations could be suggested to users, considering not only their preferences, but also taking into account suggestions com-ing out from preferences of other members of the social network related to them by the friendship relationship. The graph-based recommendation model also proposes to explore points of inter-est that are very different to user preferences, inviting them to explore new points of interest in the city.
but also opened interesting opportunities for dealing with perfor-mance issues. Preliminary results were presented, showing that the use of social metrics in any real recommendation system must include specialized components for solving distributed and con-current processing tasks. Even though nowadays there are ad-vanced and efficient solutions for managing big data, adequate use of graph-based solutions for modeling social networks still remains as the core problem of a recommendation engine.
The framework presented in this paper was tested through a pro-totype that demonstrated the validity of our proposal. The recom-mendation engine is available through a REST APIs. These web services can be easily integrated into web or mobile apps. Appli-cation domains include intelligent tourism, (as in those described in this paper), as well as other areas of interest for citizens, such as administrative services in a smart city.
7. FUTURE WORK
The prototype will be extended and adapted to include specific information on the cities of Puebla in Mexico and Shanghai in China. In addition, different aspects could still be improved in the recommendation engine to contribute to enrich the user expe-rience in a smart city:
• Incorporation of new semantic filters to propose lists of ob-jects of interest; proposing for instance only the points of interest in the proximity of the user’s location and consid-ering the time when the user queries the recommendation system.
• In absence of explicit evaluation of user preferences, we will explore the integration of a Sentiment Analysis component as the one used in (Guti´errez et al., 2015) to offer the pos-sibility to add open comments and to evaluate automatically their polarity.
• Routes recommendation: from the list of recommended POIs, different alternative routes can be built. A prototype of a mobile application has been already developed for evaluat-ing the interaction with users (Pedraza, 2015). The proto-type relies on data from Foursquare and recommends points of interest based on ratings made by users. The integration with the recommendation engine needs to be completed.
• Performance evaluation and recommendation results valida-tion as well as evaluavalida-tion of current user interfaces with ac-tual and potential users.
8. ACKNOWLEDGMENTS
Special thanks to our colleagues Christophe Thovex, Francisco Ar´amburo and David B´aez, for their significant contributions in this work. This project was partially supported by CONACYT project no. 0192321.
REFERENCES
Anand, D. and Mampilli, B. S., 2014. Folksonomy-based fuzzy user profiling for improved recommendations.Expert Syst. Appl. 41(5), pp. 2424–2436.
Anthopoulos, L. G., Janssen, M. and Weerakkody, V., 2015. Comparing smart cities with different modeling approaches. In: Proceedings of the 24th International Conference on World Wide Web, WWW ’15 Companion, International World Wide Web Conferences Steering Committee, Republic and Canton of Geneva, Switzerland, pp. 525–528.
Bobadilla, J., Hernando, A., Ortega, F. and Bernal, J., 2011. A framework for collaborative filtering recommender systems. Ex-pert Syst. Appl.38(12), pp. 14609–14623.
Bobadilla, J., Ortega, F., Hernando, A. and Bernal, J., 2012. A collaborative filtering approach to mitigate the new user cold start problem.Know.-Based Systems26, pp. 225 – 238.
Bobadilla, J., Ortega, F., Hernando, A. and Guti´errez, A., 2013. Recommender systems survey. Know.-Based Syst.46, pp. 109– 132.
Cantador, I., Fern´andez, M., Vallet, D., Castells, P., Picault, J. and Ribi`ere, M., 2008. A multi-purpose ontology-based approach for personalised content filtering and retrieval. In: M. Wallace, M. Angelides and P. Mylonas (eds),Advances in Semantic Media Adaptation and Personalization, Studies in Computational Intel-ligence, Vol. 93, Springer Berlin Heidelberg, pp. 25–51.
Chang, C.-C. and Chu, K.-H., 2013. A recommender system combining social networks for tourist attractions. In: Compu-tational Intelligence, Communication Systems and Networks (CI-CSyN), 2013 Fifth International Conference on, pp. 42–47.
de Campos, L. M., Fern´andez-Luna, J. M., Huete, J. F. and Rueda-Morales, M. A., 2010. Combining content-based and collaborative recommendations: A hybrid approach based on bayesian networks.Int. J. Approx. Reasoning51(7), pp. 785–799.
Eyharabide, V. and Amandi, A., 2012. Ontology-based user pro-file learning.Applied Intelligence36(4), pp. 857–869.
Freeman, L. C., Borgatti, S. P. and White, D. R., 1991. Centrality in valued graphs: A measure of betweenness based on network flow.Social Networks13(2), pp. 141–154.
Guti´errez, E., Cervantes, O., B´aez-L´opez, D. and Al-fredo S´anchez, J., 2015. Sentiment groups as features of a clas-sification model using a spanish sentiment lexicon: A hybrid approach. In: J. A. Carrasco-Ochoa, J. F. Mart´ınez-Trinidad, J. H. Sossa-Azuela, J. A. Olvera L´opez and F. Famili (eds), Pat-tern Recognition, Lecture Notes in Computer Science, Vol. 9116, Springer International Publishing, pp. 258–268.
Hwang, C.-S., Su, Y.-C. and Tseng, K.-C., 2010. Using genetic algorithms for personalized recommendation. In:Proceedings of the Second International Conference on Computational Collec-tive Intelligence: Technologies and Applications - Volume Part II, ICCCI’10, Springer-Verlag, Berlin, Heidelberg, pp. 104–112.
Le Merrer, E. and Tr´edan, G., 2009. Centralities: Capturing the fuzzy notion of importance in social graphs. In: Proceedings of the Second ACM EuroSys Workshop on Social Network Systems, SNS ’09, ACM, New York, NY, USA, pp. 33–38.
Movahedian, H. and Khayyambashi, M. R., 2014. Folksonomy-based user interest and disinterest profiling for improved recom-mendations: An ontological approach.J. Inf. Sci.40(5), pp. 594– 610.
Newman, M. J., 2005. A measure of betweenness centrality based on random walks.Social Networks 27(1), pp. 39 – 54.
Pedraza, D., 2015. Rox: Sistema de recomendaci´on basado en preferencias. Master’s thesis, Universidad de las Am´ericas Puebla, Ex-Hacienda Santa Catarina Martir, Cholula, Puebla.
Robertson, S. and Zaragoza, H., 2009. The probabilistic rele-vance framework: Bm25 and beyond. Found. Trends Inf. Retr. 3(4), pp. 333–389.
Schiaffino, S. and Amandi, A., 2009. Intelligent user profiling. In: M. Bramer (ed.),Artificial Intelligence An International Per-spective, Lecture Notes in Computer Science, Vol. 5640, Springer Berlin Heidelberg, pp. 193–216.
Shinde, S. K. and Kulkarni, U., 2012. Hybrid personalized rec-ommender system using centering-bunching based clustering al-gorithm.Expert Syst. Appl.39(1), pp. 1381–1387.
Singhal, S., McGreal, S. and Berry”, J., 2013. Application of a hierarchical model for city competitiveness in cities of india. Cities 31, pp. 114 – 122.
Thovex, C. and Trichet, F., 2013. Semantic social networks anal-ysis.Social Network Analysis and Mining3(1), pp. 35–49.
Wang, H., Terrovitis, M. and Mamoulis, N., 2013. Location recommendation in location-based social networks using user check-in data. In:Proceedings of the 21st ACM SIGSPATIAL In-ternational Conference on Advances in Geographic Information Systems, SIGSPATIAL’13, ACM, New York, NY, USA, pp. 374– 383.
Wolff, A. and Mulholland, P., 2015. Navigation strategies in the cityscape/datascape. In: Adjunct Proceedings of the 2015 ACM International Joint Conference on Pervasive and Ubiqui-tous Computing and Proceedings of the 2015 ACM International Symposium on Wearable Computers, UbiComp/ISWC’15 Ad-junct, ACM, New York, NY, USA, pp. 1143–1151.
Ye, M., Yin, P. and Lee, W.-C., 2010. Location recommenda-tion for locarecommenda-tion-based social networks. In: Proceedings of the 18th SIGSPATIAL International Conference on Advances in Ge-ographic Information Systems, GIS ’10, ACM, New York, NY, USA, pp. 458–461.