Stickiness in a bouncer model: A slowing mechanism for Fermi acceleration
Andr´e L. P. Livorati,1Tiago Kroetz,2Carl P. Dettmann,3,4Iberˆe Luiz Caldas,1and Edson D. Leonel4,5 1Instituto de F´ısica, IFUSP, Universidade de S˜ao Paulo, USP Rua do Mat˜ao, Tr. R 187, Cidade Universit´aria,
05314-970, S˜ao Paulo, SP, Brazil
2Departamento de F´ısica, Universidade Tecnol´ogica Federal do Paran´a, UTFPR Campus Pato Branco,
85503-390, Pato Branco, PR, Brazil
3School of Mathematics, University of Bristol, Bristol BS8 1TW, United Kingdom
4Departamento de Estat´ıstica Matem´atica Aplicada e Computac¸˜ao, UNESP, Univ Estadual Paulista, Av. 24A, 1515 Bela Vista,
13506-900, Rio Claro, SP Brazil
5Abdus Salam, ICTP, 34151 Trieste, Italy
(Received 30 July 2012; published 6 September 2012)
Some phase space transport properties for a conservative bouncer model are studied. The dynamics of the model is described by using a two-dimensional measure preserving mapping for the variables’ velocity and time. The system is characterized by a control parameterǫand experiences a transition from integrable (ǫ=0) to nonintegrable (ǫ=0). For small values ofǫ, the phase space shows a mixed structure where periodic islands, chaotic seas, and invariant tori coexist. As the parameterǫincreases and reaches a critical valueǫc, all invariant
tori are destroyed and the chaotic sea spreads over the phase space, leading the particle to diffuse in velocity and experience Fermi acceleration (unlimited energy growth). During the dynamics the particle can be temporarily trapped near periodic and stable regions. We use the finite time Lyapunov exponent to visualize this effect. The survival probability was used to obtain some of the transport properties in the phase space. For large ǫ, the survival probability decays exponentially when it turns into a slower decay as the control parameterǫis reduced. The slower decay is related to trapping dynamics, slowing the Fermi Acceleration, i.e., unbounded growth of the velocity.
DOI:10.1103/PhysRevE.86.036203 PACS number(s): 05.45.Pq, 05.45.Tp
I. INTRODUCTION
It is known that Hamiltonian systems are typical nonergodic and nonintegrable [1]. The phase space of such systems is divided into regions with regular and chaotic dynamics. These dynamical regions are connected by a layer where regular or irregular motion can or cannot mix, depending upon on the number of degrees of freedom of the system, as well as properties of the limiting surface itself. Such a division leads to the stickiness phenomenon [2,3], which is manifested through the fact that a phase trajectory in a chaotic region passing near enough a Kolmogorov-Arnold-Moser (KAM) island, evolves there almost regularly during a time that may be very long. However, when an orbit resides in a chaotic region far from the set of KAM regions, it moves chaotically in the sense that two nearby initial conditions depart from each other exponentially as the time evolves. Therefore the stickiness of phase trajectories has a crucial influence on the transport properties of Hamiltonian systems, and its relation to physical systems is one of the most important open problems of nonlinear dynamics [4,5]. Applications of stickiness can be found in astronomy [6], fluid mechanics [7], Levy flights [8], also in biology [9], in plasma physics [10,11], and many others. One of the main consequences of the influence of orbits in a sticky regime is observed in the transport properties along the phase space. Therefore it may give rise to the following question: May sticky orbits influence the Fermi acceleration phenomenon? Fermi acceleration (FA) was introduced by the first time in 1949 by Enrico Fermi [12] as an attempt to explain the possible origin of the high energies of the cosmic rays. Fermi claimed that the charged cosmic particles could acquire energy from the moving magnetic fields present in the cosmos.
His original idea generated a prototype model which exhibits unlimited energy growth and is called the bouncer model. The model consists of a free particle (making allusions to the cos-mic particles), which is falling under the influence of a constant gravitational fieldg(a mechanism to inject the particle back to the collision zone) and suffering collisions with a heavy and time-periodic moving wall (denoting the magnetic fields). The model is characterized by a control parameterǫand has a transition from integrabilityǫ=0 to nonintegrabilityǫ=0. A mixed structure of the phase space is observed for lower values ofǫ, and strong chaotic properties are present in the regime of large values of the parameter, sayǫ > ǫc, where at
ǫcthe system experiences a transition from a local to a globally
The paper is organized as follows: In Sec.IIthe mapping that describes the dynamics of the model is obtained. In Sec.III, the numerical results are present, which include the calculation of the finite time Lyapunov exponent and escape rates for the velocity as a function ofǫ. Finally, the conclusions and final remarks are drawn in Sec.IV.
II. THE MODEL, THE MAPPING, AND CHAOTIC PROPERTIES
We discuss in this section the procedures used to construct the mapping that describes the dynamics of the system. The model consists of a classical particle of mass m which is moving in the vertical direction under the influence of a constant gravitational fieldg. It also suffers elastic collisions with a periodically moving wall whose position is given by y(t)=εcos(wt), where w is the frequency and ε is the amplitude of oscillation, respectively.
The dynamics of the system is made by the use of a two-dimensional, nonlinear, and measure preserving mapping for the variables velocity of the particlevand timet immediately after an nth collision of the particle with the moving wall. During the dynamics, two distinct kinds of collisions may be observed: (i) multiple collisions of the particle with the moving wall—those happening before the particle leaves the collision zone (the collision zone is defined as the regiony∈[−ε,ε])— or (ii) a single collision of the particle with the moving wall (causing the particle to leave the collision zone). Before writing the equations of the mapping, it is important to mention there is an excessive number of control parameters, three in total, namely,ε,g, andw. We may define dimensionless and more convenient variables asVn=vnw/g,ǫ=εw2/g, and measure
the time in terms of the number of oscillations of the moving wallφn=wtn.
We assume that at the instantφ∈[0,2π] the position of the particle isyp(φn)=ǫcos(φn) with initial velocity Vn>
0, which lead us to obtain the following expression for the mapping,
Tc:
V
n+1= −Vn∗+φc−2ǫsin(φn+1)
φn+1=[φn+Tn] mod(2π)
, (1)
where the indexcstands for the complete version of the model (the one which takes into account the movement of the moving wall), and the expressions forV∗
nandTndepend on what kind
of collision happens. For case (i), i.e., the multiple collisions, the expressions are V∗
n =Vn and Tn=φc, where φc is
obtained from the condition that matches the same position for the particle and the moving wall. It leads to the following transcendental equation that must be solved numerically:
G(φc)=ǫcos(φn+φc)−ǫcos(φn)−Vnφc+12φ2c. (2)
If the particle leaves the collision zone, case (ii) applies. The expressions are V∗
n = −
V2
n +2ǫ(cos(φn)−1) andTn=
φu+φd+φc, withφu=Vn denoting the time spent by the
particle in the upward direction up to reaching the null velocity, andφd =
V2
n +2ǫ(cos(φn)−1) corresponds to the time that
the particle spends from the place where it had zero velocity up to the entrance of the collision zone atǫ. Finally, the termφc
has to be obtained numerically from the equationF(φc)=0,
where
F(φc)=ǫcos(φn+φu+φd+φc)−ǫ−Vn∗φc+12φ2c. (3)
The extended phase space for the whole version of the model considers four variables, namely: (1)xwdenoting the
position of the moving wall; (2) Vp corresponding to
the velocity of the particle; (3) Ep which is the energy of
the particle; and (4) the timet. The canonical pairs, however, are position and velocity (xw,Vp),and energy and time (Ep,t).
The way the mapping was constructed, the variables used are not canonical ones; therefore the determinant of the Jacobian matrix is
detJ=
V
n+ǫsin(φn)
Vn+1+ǫsin(φn+1)
, (4)
which is clearly different from unity, as it should be if the canonical pair was considered. However, we may say that it preserves the following measure in the phase space, dμ= [V +ǫsin(φ)]dV dφ.
A common version which is also present in the literature is the so-called simplified version. It was proposed many years ago, when computers were far slower (see Ref. [13] and references therein for historical purposes), as an attempt to keep the essence of the problem but at the same time allow numerical computations to be realized in a reasonable time. Also, it could reduce the complexity of the equations at a level that analytical calculations could be obtained. It assumes that the wall is fixed, so that the calculation of the time between collisions does not involve numerical solutions of transcendental equations, but at the instant of the collision, the particle suffers an exchange of energy and momentum as if the wall were moving. In this version, the extended phase does not consider anymore the position of the moving wall, because by definition it is fixed, causing the canonical pair to be the velocity and time. The mapping is then written as
Ts :
V
n+1= |Vn−2ǫsin(φn+1)|
φn+1=φn+2Vnmod(2π)
, (5)
where the modulus function is introduced to avoid the particle to move beyond the wall. After a collision, if the particle has a negative velocity, we reinject it back with the same velocity. For the simplified version, and given the variables describing the dynamics are the canonical pair, the determinant of the Jacobian is given by detJ= ±1. The simplified version of the model also allows us to make a connection with the so-called standard mapping. DefiningIn=2Vn,K=4ǫ,
and θn=φn+1+π, the simplified version is written as the standard mapping. The variation of the control parameterǫ leads the dynamics to experience a transition from locally to globally chaotic dynamics, as similarly observed in the standard mapping [14]. Indeed, forǫ < ǫc≈0.242 9 the phase
The period-1 fixed points are obtained by solving the two equations simultaneously,Vn+1=Vn=V∗andφn+1 =φn=
φ∗, and are given by
V∗=π l, l=0,1,2, . . . , (6)
φ∗ =arcsinπ m 2ǫ
, m=0,1,2, . . . (7)
Thus there are windows of periodicity for the period-1 fixed points which depend onǫ[14]. The linear stability for these fixed points is given by
(2π m)2<16ǫ2<16+(2π m)2. (8)
This result gives us the intervals where stable orbits are observed for arbitrary values ofǫ. The first interval (m=0) says that for 0< ǫ <1, the period-1 fixed points are stable. For the next interval (m=1), one can find that ǫ=π/2 starts a new interval where the fixed points are stable, and forǫ >1+π2/4 they become unstable. Taking now the period-2 fixed points, obtained asVn+2 =Vn=V∗ and
φn+2=φn=φ∗, and applying a similar procedure, we can
find that the windows of periodicity for the period-2 fixed points are given by
(2π)2(p−1)2<16ǫ2<(2π)2(p−1)2+4, (9)
wherep=l−m.
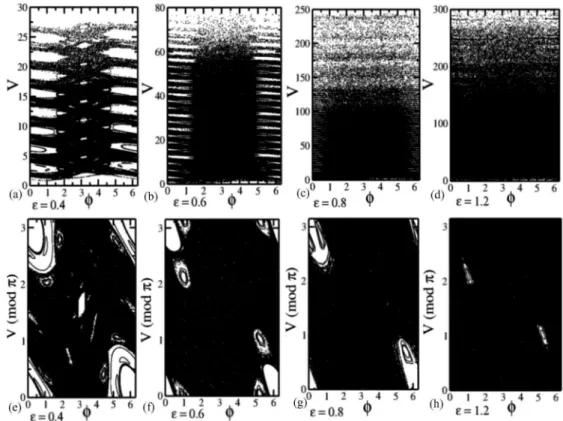
Figure 1 shows the structure of the phase space for the complete version of the bouncer as a function of the control parameterǫ. The accuracy used to solve numerically bothF andGwas 10−12using the bisection method. Asǫis increased the stable regions (mainly marked by periodic fixed points)
reduce, leading the phase space to have large unstable regions. The regions of sticky are more often observed for smaller values ofǫdue to the existence of many islands in the phase space as compared to large values ofǫ. Analyzing Fig.1, we see that the phase space has a repeating structure inπ in the velocity axis. Thus let us plot the phase space, usingmod(π) for velocity. Such a plot is useful for observing the evolution of the fixed points and the possible trappings caused by sticky orbits. The control parameters used to construct Fig.1were (a) and (e)ǫ=0.40; (b) and (f)ǫ=0.60; (c) and (g)ǫ=0.80; and (d) and (h)ǫ=1.20. For each figure a set of 100 different initial conditions was evolved in time until 105collisions with the moving wall. The initial velocity was chosen such that its minimum value was higher than the stable region inV ∈ [0,2ǫ].
III. NUMERICAL RESULTS
This section is divided in two parts. In the first one we discuss the results for the Lyapunov exponent obtained at finite time, while in the second we present our discussions and show results for orbits that survive the dynamics longer after being trapped by some sticky regions. It is good to emphasize that all the results were obtained considering the complete dynamics of the system.
A. Lyapunov exponents
Let us start discussing our results for the positive Lyapunov exponent for chaotic components of the phase space. The Lyapunov exponent has been widely used to quantify the
FIG. 2. (a) Plot of the FTLE for an initial condition chosen in the chaotic sea. (b) The evolution of the same initial condition of (a) for a plot of velocity against the number of collisions. (c) The zoom-in window of the previously selected area of (b) showing these trapping orbits in the phase space coordinates (V ,φ).
average expansion or contraction rate for a small volume of initial conditions. If the Lyapunov exponent is positive, the orbit is said to be chaotic, leading to an exponential separation of two nearby initial conditions. On the other hand, a nonpositive Lyapunov exponent indicates regularity and the
dynamics can be in principle periodic or quasiperiodic. The Lyapunov exponents are defined as follows [15] (see, for example, [16] for applications in higher dimensional systems):
λj = lim n→∞
1 nln
nj
, j =1,2, (10)
where njare the eigenvalues of the matrixM= n
i=1J(Vi,φi)
andJi is the Jacobian matrix evaluated over the orbit.
In the dynamics of the bouncer model, chaotic and regular motion can coexist in the phase space, which introduces large variations and local instability along a reference chaotic trajectory. Such variations are related to alternations between different motions, in a qualitative description, as well as chaotic and quasiregular motions. In order to characterize such peculiar variation dynamics, we used the finite-time Lyapunov exponent (FTLE) [17]. Once the trappings caused by orbits in the stickiness regime happen just for a finite time, this technique is useful to quantify the trapping effects. It was shown [17] that when the FTLE distributions present small values, it is related to existence of long-lived jets from a two-dimensional model for fluid mixing and transport. This can be understood, from a dynamic point of view, as stickiness trajectories in the phase space.
Figure2(a)shows the evolution of the FTLE for an initial condition chosen in the chaotic sea forǫ=0.4. One sees a very irregular behavior along the time, alternating average contractions and repulsions, leading to an average value as ¯
λ=0.3078(1). In Fig.2(b)is shown the evolution of the same
initial condition of Fig.2(a), and the velocity is plotted as a function of the number of collisions. Figure 2(b) shows the successive trappings along the orbit and how they “slow down” the energy growth that characterizes the FA. Also, we set a zoom-in window in Fig.2(b)and plot the corresponding orbit in the phase space portrait (V ,φ) in order to identify some of these stickiness orbits in Fig.2(c).
To optimize the window of time to be used in the FTLE calculations, we have considered different lengths in several simulations. After some comparisons of the results, we come, based on fluctuations of the Lyapunov exponents, to a finite time of 100 collisions that was then used to study the distribution of FTLE. It is known in the literature [17] that the FTLE distribution has a Gaussian shape, where the large peak can be interpreted as the mean value of the Lyapunov exponent. If the system presents any periodic or quasiperiodic motion, besides chaos in its dynamics, the FTLE distribution can have a secondary peak in the region of very low value of the Lyapunov exponent. Such a secondary peak is interpreted as sticky orbits along the dynamics evolution [16,17] responsible for trapping the dynamics. The distributions for several FTLE are shown in Fig.3for different control parametersǫ, as labeled
in the figure. We can see from Fig.3that the secondary peak of the FTLE distribution is more evident for small values of ǫ. Just to have a glance at the influence of the second peak in the distribution represents up to about 20% of the whole distribution of Fig. 3(b). The fraction of the distribution of the FTLE for the secondary peak decreases asǫis increased. Such a result is expected, because for higher values ofǫfewer islands in the phase space are observed, as previously shown in Fig.1.
B. Survival probability and escape rates
In this section we discuss results for orbits that survive until reaching a predefined velocity at which they are assumed to escape. To do that we consider the existence of a hole in the velocity coordinate of the phase space. If the particle reaches such a velocity or higher, its dynamics is stopped and a new initial condition is started. The introduction of the hole allows us to study transport properties as well as characterize, through statistical analysis of survival probability and time-correlation decays, the influence of sticky orbits along the dynamics of the model [18–20].
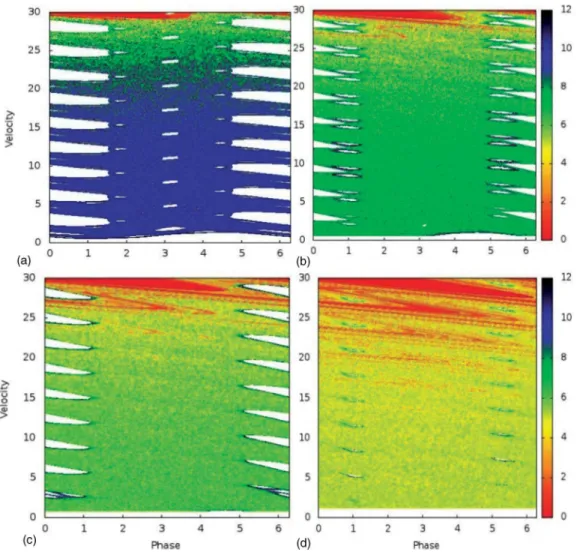
To study the transport properties, we set a grid of initial conditions equally distributed along the velocity and phase. A grid of 500×500 initial conditions withV0∈[ǫ,30] and φ0∈[0,2π] was considered. Then each initial condition was evolved in time up to the limit of 105collisions with the moving wall or until a hole placed in the velocity axis atVhole=30 was reached. Figure4 shows a plot of the initial conditions evolved until 105collisions with the moving wall or up to the particle reaching the hole. The color range denotes the number of collisions (plotted in logarithmic scale) that the particle had with the moving wall until reaching the escape velocity, and it can be interpreted as red (dark gray) indicating fast escape, to blue (black) denoting long time dynamics.
White regions denote that the particle never escaped. The control parameters used to construct the figures were (a)ǫ= 0.4, (b)ǫ=0.6, (c)ǫ=0.8,and (d)ǫ=1.2.
We see from Fig. 4(a), where ǫ=0.40, that low initial velocities spend a long time accumulating energy until reach-ing the hole atV =30. Additionally, one sees many stability islands where the orbits can get temporally trapped and be released after a while. These temporal trappings are caused by sticky regions. Such dynamical regimes can be visualized by the dark regions marked by the blue color in Figs.4(b)
and4(c), whose control parameters are, respectively,ǫ=0.6 and ǫ=0.8. When the control parameter ǫ is raised, the particles reach the hole faster, as we can see from Figs.4(b)–
4(d). In particular, for Fig.4(c)one sees that the first stability island disappeared. The stability regions are getting smaller and smaller as the control parameterǫraises, and from Fig.4(d)
they appear to be very small forǫ=1.2. However, even for a control parameter where the stability islands are small, we see that the sticky orbits are still present, marked by the dark blue color in the plot.
The statistics of the cumulative recurrence time distribution which is obtained from the integration of the frequency histogram distribution for the escape can also be obtained. To do that we consider now that the escaping velocity is set as Vhole=100, although any other velocity could be considered. Their cumulative recurrence time distribution is also called survival probability and is obtained as
Psurv =
1 N
N
j=1
Nrec(n), (11)
where the summation is taken along an ensemble of N = 106 different initial conditions. The term N
rec(n) indicates
the number of initial conditions that do not escape through the hole at Vhole=100 (i.e., recur), until a collisionn. The ensemble of initial conditions was set for a constant velocity as V0=2π, while 106 phases were distributed uniformly in φ0∈[2.8,3.2].
FIG. 5. (Color online) Plot of the curves ofPsurvfor different control parameters. One sees the change of the behavior ofPsurv as the
TABLE I. Exponents obtained from numerical fitting for the curves ofPsurvfor different values ofǫ.
ǫ ǫ−ǫc −ζ −γ
1.40 1.1557025 1.404(6)E−3 −
1.30 1.057352 1.036(3)E−3 −
1.20 0.957025 7.219(5)E−4 −
1.10 0.857025 4.675(3)E−4 2.92(1)
1.00 0.757025 3.430(7)E−4 2.18(1)
0.90 0.657025 2.739(2)E−4 1.95(1)
0.80 0.557025 2.105(2)E−4 1.625(9)
0.70 0.457025 1.218(4)E−4 1.73(3)
0.60 0.357025 5.260(1)E−5 2.16(2)
0.575 0.332025 4.387(9)E−5 1.79(3)
0.55 0.307025 3.71(7)E−5 1.52(1)
0.525 0.282025 3.101(7)E−5 1.70(1)
0.50 0.257025 2.463(5)E−5 1.91(9)
0.475 0.232025 2.280(1)E−5 1.29(1)
0.45 0.207025 1.408(3)E−5 1.71(1)
0.425 0.182025 7.654(3)E−6 1.45(2)
0.40 0.157025 5.73(9)E−6 1.90(5)
0.375 0.132025 3.25(3)E−6 1.90(2)
0.35 0.107025 1.536(4)E−6 1.84(1)
It is known in the literature that if a system has fully chaotic behavior, the curves ofPsurv have an exponential decay [21].
However, when a mixed dynamics is observed in the phase space, the curves ofPsurvmay present different behaviors that
may include (i) a power law decay [22] or (ii) a stretched expo-nential decay [23]. For the bouncer model, which has a mixed phase space, the curves ofPsurv may present either behavior,
depending on the parameterǫand the set of initial conditions, as shown in Fig. 5. We see a transition in the behavior of the curves ofPsurv as the parameterǫis decreased. For large
values ofǫ, as, for example,ǫ=1.4 andǫ=1.3, the phase space has quite few islands and the chaotic sea is dominant over the dynamics. An exponential decay is therefore expected in the curves ofPsurv, as shown in Figs.5(a)and5(b). As the
parameterǫis getting smaller, more and more stability islands appear in the phase space, leading to the appearance of more and more sticky regions. With these stable regions around in the phase space, a change in the behavior of the curves ofPsurv
is expected. For values ofǫ <1, we may observe a combina-tion of decays in the curves ofPsurv. First, the curves exhibit an
exponential decay and suddenly they change to a slow decay that we observed to be described as a power law which marks the presence of orbits in the stickiness regime [22].
Considering the curves of the survival probability shown in Fig.5, a numerical fitting can be made therefore according to (i) the exponential decay is given asPsurv(n)∝exp(nζ) while
(ii) the power law decay is described byPsurv(n)∝nγ, where
ζandγ are the exponents for exponential and power law time decays, respectively. Table Ishows the set of exponents for different values of the control parameterǫ.
We see that as the parameterǫdecreases, the exponential decay of the curves ofPsurvalso suffer a change. The exponent
ζ also decreases as ǫ decreases, a result which is quite expected, given that the periodic regions of the phase space are getting larger and larger. Figure6(a)shows the behavior of
FIG. 6. (Color online) Plot of−ζand−γas a function ofǫ−ǫc.
the exponentζ as a function of (ǫ−ǫc). Looking at Fig.6(a),
we see that the exponentζcan be described by a power law of the type−ζ ∝(ǫ−ǫc)zand that the slope of the power law is
given byz=2.719(4).
The exponentγ, however, does not show the mathematical beauty as observed for the exponent ζ. The slower decay observed in the curves of the survival probability is indeed due to sticky regions present in the phase space. For our simulations, most of the slower decay was characterized as a power law. Indeed, in the literature it is known that the power law decay, for such cumulative recurrence time distributions for other dynamical systems [24,25], which includes also billiards systems [22,26–29], is set in a range of −γ ∈[1.5,2.5] and that our results match this range. We stress, however, that the total understanding and this behavior is still an open problem, and extensive theoretical and numerical simulations are required to describe its behavior properly.
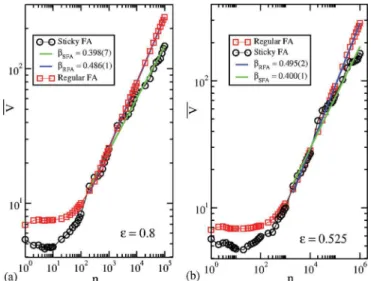
FIG. 7. (Color online) Plot ofVas a function ofnfor (a)ǫ=0.8 and (b)ǫ=0.525. One can see two distinct growth exponents for regular Fermi acceleration and sticky Fermi acceleration. Such a difference can be understood as sticky orbits acting as a slowing mechanism for FA.
for evolution of the initial conditions which produce a fast decay in the survival probability (those along the exponential decay in Fig.5) and as expected, an exponent of∼=0.5 was obtained. On the other hand, the curves plotted as bullets show the evolution of initial conditions chosen in the very final tail of the power law decay shown in Fig.5and are called sticky Fermi acceleration (SFA). Power law fitting furnishes slopes 0.398(7) for (a) and 0.400(1) for (b). These curves indeed give support to our claim that sticky regions slow down the Fermi acceleration.
IV. FINAL REMARKS AND CONCLUSIONS The dynamics of the bouncer model was investigated by using a two-dimensional measure preserving mapping controlled by a single control parameter ǫ. For ǫ=0 the system is integrable, while it is nonintegrable forǫ=0. As soon asǫ increases, the periodic regions of the phase space reduce, giving rise to chaotic dynamics. Indeed, for ǫ > ǫc,
invariant tori are not observed in the phase space while periodic regions are still observed. The influence of sticky regions also reduces with the increase ofǫ. Our numerical investigation of the FTLE spectrum distribution give support that trapping dynamics is often observed in the phase space and is confirmed by the secondary peaks of the FTLE distribution. The survival probability is characterized by two decaying regimes: (1) for strong chaotic dynamics, the decay is given by an exponential type while (2) it changes to a slower decay marked by a power law type when mixed dynamics is present in the phase space. Finally, according to the results shown in Fig.7, we see that when a strong regime of stickiness is present in the system, it acts as a slowing mechanism for FA. As with the survival probability, it would interesting to investigate whether the stickiness associated with mixed phase space in general models leads to a universal “slowing exponent.”
ACKNOWLEDGMENTS
A.L.P.L. acknowledges CNPq for financial support. C.P.D. thanks Pr´o Reitoria de Pesquisa - PROPe/UNESP and DEMAC for hospitality during his stay in Brazil. I.L.C. thanks CNPq and FAPESP. E.D.L. acknowledges CNPq, FAPESP, and FUN-DUNESP, Brazilian agencies. This research was supported by resources supplied by the Center for Scientific Comput-ing (NCC/GridUNESP) of the S˜ao Paulo State University (UNESP).
[1] L. Markus and K. R. Meyer, Mem. Am. Math. Soc. 144, 1 (1978).
[2] A. D. Perry and S. Wiggins,Physica D71, 102 (1994). [3] G. M. Zaslavsky,Hamiltonian Chaos and Fractional Dynamics
(Oxford University Press, New York, 2005). [4] L. A. Bunimovich,Nonlinearity21, T13 (2008).
[5] L. A. Bunimovich and L. V. Vela-Arevalo,Chaos22, 026103 (2012).
[6] G. Contopoulos and M. Harsoula,Celest. Mech. Dyn. Astron. 107, 77 (2010).
[7] T. H. Solomon, E. R. Weeks, and H. L. Swinney,Phys. Rev. Lett.71, 3975 (1993).
[8] M. F. Shlesinger, G. M. Zaslavsky, and J. Klafter, Nature (London)363, 31 (1993).
[9] T. Tel, A. P. S. Moura, C. Grebogi, and G. Karolyi,Phys. Rep. 413, 91 (2005).
[10] D. del-Castillo-Negrete, Phys. Fluids 10, 576 (1998).
[11] D. del-Castillo-Negrete, B. A. Carreras, and V. E. Lynch,Phys. Rev. Lett.94, 065003 (2005).
[12] E. Fermi,Phys. Rev.75, 1169 (1949).
[13] A. J. Lichtenberg, M. A. Lieberman, and R. H. Cohen,Physica D1, 291 (1980).
[14] A. J. Lichtenberg and M. A. Lieberman,Regular and Chaotic Dynamics, Applied Mathematics and Science(Spring Verlag, New York, 1992).
[15] J. P. Eckmann and D. Ruelle,Rev. Mod. Phys.57, 617 (1985). [16] C. Manchein, J. Rosa, and M. W. Beims,Physica D238, 1688
(2009).
[17] J. D. Szezech Jr., S. R. Lopes, and R. L. Viana,Phys. Lett. A 335, 394 (2005).
[18] C. P. Dettmann and O. Georgiou, Physica D 238, 2395 (2009).
[19] C. P. Dettmann and T. B. Howard, Physica D 238, 2404 (2009).
[20] C. P. Dettmann and O. Georgiou, J. Phys. A 44, 195102 (2011).
[21] C. P. Dettmann and E. D. Leonel,Physica D241, 403 (2012). [22] E. G. Altmann, A. E. Motter, and H. Kantz,Phys. Rev. E73,
026207 (2006).
[24] D. R. da Costa, C. P. Dettmann, and E. D. Leonel,Phys. Rev. E 83, 066211 (2011).
[25] Y. Zou, M. Thiel, M. C. Romano, and J. Kurths,Chaos17, 043101 (2007).
[26] J. D. Szezech, I. L. Caldas, S. R. Lopes, R. L. Viana, and J. P. Morrison,Chaos19, 043108 (2009).
[27] E. G. Altmann, A. E. Motter, and H. Kantz,Chaos15, 033105 (2005).
[28] F. Lenz, C. Petri, F. K. Diakonos, and P. Schmelcher,Phys. Rev. E82, 016206 (2010).