ACPD
12, 27927–27954, 2012Measurements of gaseous elemental mercury – Australia
G. C. Edwards and D. A. Howard
Title Page
Abstract Introduction
Conclusions References
Tables Figures
◭ ◮
◭ ◮
Back Close
Full Screen / Esc
Printer-friendly Version Interactive Discussion
Discussion
P
a
per
|
Dis
cussion
P
a
per
|
Discussion
P
a
per
|
Discussio
n
P
a
per
|
Atmos. Chem. Phys. Discuss., 12, 27927–27954, 2012 www.atmos-chem-phys-discuss.net/12/27927/2012/ doi:10.5194/acpd-12-27927-2012
© Author(s) 2012. CC Attribution 3.0 License.
Atmospheric Chemistry and Physics Discussions
This discussion paper is/has been under review for the journal Atmospheric Chemistry and Physics (ACP). Please refer to the corresponding final paper in ACP if available.
Air-surface exchange measurements of
gaseous elemental mercury over naturally
enriched and background terrestrial
landscapes in Australia
G. C. Edwards and D. A. Howard
Department of Environment and Geography, Macquarie University, North Ryde, NSW, 2109, Australia
Received: 28 August 2012 – Accepted: 9 October 2012 – Published: 24 October 2012
Correspondence to: G. C. Edwards (grant.edwards@mq.edu.au)
ACPD
12, 27927–27954, 2012Measurements of gaseous elemental mercury – Australia
G. C. Edwards and D. A. Howard
Title Page
Abstract Introduction
Conclusions References
Tables Figures
◭ ◮
◭ ◮
Back Close
Full Screen / Esc
Printer-friendly Version Interactive Discussion
Discussion
P
a
per
|
Dis
cussion
P
a
per
|
Discussion
P
a
per
|
Discussio
n
P
a
per
|
Abstract
This paper presents the first gaseous elemental mercury (GEM) air-surface exchange
measurements obtained over naturally enriched and background (<0.1 µg g−1Hg)
ter-restrial landscapes in Australia. Two pilot field studies were carried out during the Aus-tralian autumn and winter periods at a copper-gold-cobalt-arsenic-mercury mineral field
5
near Pulganbar, NSW. GEM fluxes using a dynamic flux chamber approach were mea-sured, along with controlling environmental parameters over three naturally enriched and three background substrates. The enriched sites results showed net emission to the atmosphere and a strong correlation between flux and substrate Hg concentration,
with average fluxes ranging from 14±1 ng m−2h−1 to 113±6 ng m−2h−1.
Measure-10
ments at background sites showed both emission and deposition. The average Hg flux
from all background sites showed an overall net emission of 0.36±0.06 ng m−2h−1.
Fluxes show strong relationships with temperature, radiation, and substrate parame-ters. A compensation point of 2.48, representative of bare soils was determined. Com-parison of the Australian data to North American data confirmed the need for Australian
15
specific mercury air-surface exchange data representative of Australia’s unique climatic conditions, vegetation types, land use patterns, and soils.
1 Introduction
Mercury is a global pollutant; it is ubiquitous in the environment and is a threat to the health of humans and ecosystems. At the 10th International Conference on Mercury as
20
a Global Pollutant (ICMGP) several speakers remarked on the paucity of high quality mercury air-surface exchange data sets (UNEP, 2011). There is a general lack of rep-resentative data on the cycling of natural emissions of mercury to and from the atmo-sphere (UNEP, 2011; Pirrone et al., 2010; Selin, 2009; Gustin et al., 2008; Schroeder et al., 2005). The atmosphere is the central pathway for distribution of this neurotoxicant
25
ACPD
12, 27927–27954, 2012Measurements of gaseous elemental mercury – Australia
G. C. Edwards and D. A. Howard
Title Page
Abstract Introduction
Conclusions References
Tables Figures
◭ ◮
◭ ◮
Back Close
Full Screen / Esc
Printer-friendly Version Interactive Discussion
Discussion
P
a
per
|
Dis
cussion
P
a
per
|
Discussion
P
a
per
|
Discussio
n
P
a
per
|
enriched terrains, volcanic, and oceanic and fresh water (Gustin, 2003). Reliable and representative air-surface exchange measurements of natural sources of mercury are needed to put into perspective the long term human and ecological risks from anthro-pogenic activity associated with this volatile metal. These data, along with concurrent measurements of controlling environmental parameters, are required to improve our
5
understanding of the biogeochemical cycling of mercury thereby improving model em-piricism, and better constraining estimates of natural sources inventories (Pirrone et al., 2010).
Recent efforts to establish a mercury natural sources inventory for Australia by
Nel-son et al. (2009) revealed there are no data on the air-surface exchange of atmospheric
10
mercury from natural sources over Australian environs. Moreover, there is an overall dearth of flux data on natural sources and sinks of atmospheric mercury in the South-ern Hemisphere (Edwards and Howard, 2011). As such, estimates of the Australian natural sources inventory are reliant on emission factors and empiricism based on North American and European data sets, leading to high uncertainty in the estimates.
15
Estimates for mercury emissions in Australia, not including ocean, range from 117 to 567 tonnes per year (Nelson et al., 2004), and more recently 148 tonnes per year, by Cope et al. (2009).
Australia is the second driest continent on earth after Antarctica and has a diverse range of climate zones (i.e. equatorial, tropical, subtropical, desert, grassland, and
tem-20
perate, based on K ¨oppen classification). Most of Australia is covered by arid and semi-arid climates, being warm to hot with the exception of the alpine area in the southeast which has seasonal snow. In addition to wide seasonal variation the Australian climates experience long term variation under the influence of El Ni ˜no (BOM, 2008). Australian climatic conditions are unique from North America and Europe as are its vegetation
25
ACPD
12, 27927–27954, 2012Measurements of gaseous elemental mercury – Australia
G. C. Edwards and D. A. Howard
Title Page
Abstract Introduction
Conclusions References
Tables Figures
◭ ◮
◭ ◮
Back Close
Full Screen / Esc
Printer-friendly Version Interactive Discussion
Discussion
P
a
per
|
Dis
cussion
P
a
per
|
Discussion
P
a
per
|
Discussio
n
P
a
per
|
emissions to the atmosphere, coupled with background atmospheric mercury concen-trations constant over hemispheric scales and approximately 25 % less in the Southern Hemisphere (SH) than the Northern Hemisphere (NH) (Pirrone et al., 2010), Australia presents a unique opportunity to study and address uncertainties in the global biogeo-chemical cycle of mercury associated with land-atmosphere cycling.
5
To address the need for Australian specific data on natural mercury emissions, an extensive measurement program has been proposed to collect mercury air-surface exchange data and environmental correlates over natural sources in Australian land-scapes. Two pilot studies have been carried out during April and June (i.e. Australian autumn and winter) 2011 over mercuriferous and background substrates near a
copper-10
gold-cobalt-arsenic-mercury mineral field at Pulganbar, NSW. During these studies gaseous elemental mercury (GEM) air-surface exchange and environmental measure-ments were made.
This paper presents the first Australian specific GEM air-surface exchange measure-ments along with controlling climatic and substrate variables. The results are compared
15
to results from similar studies carried out in North America. This research goes towards advancing our understanding of mercury cycling in Australian environments.
2 Methodology
2.1 Site selection and description
According to Rytuba (2003) mercuriferous mineral enrichment is concentrated in 26
20
mercury mineral belts globally. One of these mercury mineral belts runs along the east-ern coast of Australia and extends into Tasmania (Rytuba, 2003). Generally mercury mineral belts are concentrated in geological settings associated with previous or cur-rently active plate tectonic margins, volcanism or geothermal activity (Gustin et al., 2006). In addition to this primary mercury mineralization Australia has many pockets
ACPD
12, 27927–27954, 2012Measurements of gaseous elemental mercury – Australia
G. C. Edwards and D. A. Howard
Title Page
Abstract Introduction
Conclusions References
Tables Figures
◭ ◮
◭ ◮
Back Close
Full Screen / Esc
Printer-friendly Version Interactive Discussion
Discussion
P
a
per
|
Dis
cussion
P
a
per
|
Discussion
P
a
per
|
Discussio
n
P
a
per
|
of volcanogenic massive sulphide (VMS) and sedimentary exhalitive (sedex) mineral deposits which can contain up to 1200 ppm mercury (Rytuba, 2005).
The focus of the investigation for a site to carry out the pilot studies was on the primary mercury mineralization zones. Seven potential sites were identified through information collected from the Australian Bureau of Statistics (ABS, 1912). The year
5
book of Australia (1912) reported cinnabar had been mined or prospected around the Bingara, Clarence River and Pulganbar areas of NSW, Kilkivan and Black Snake in the Wide Bay district of Queensland, the Jamieson area of Victoria and in the vicinity of Willunga in South Australia (Fig. 1a).
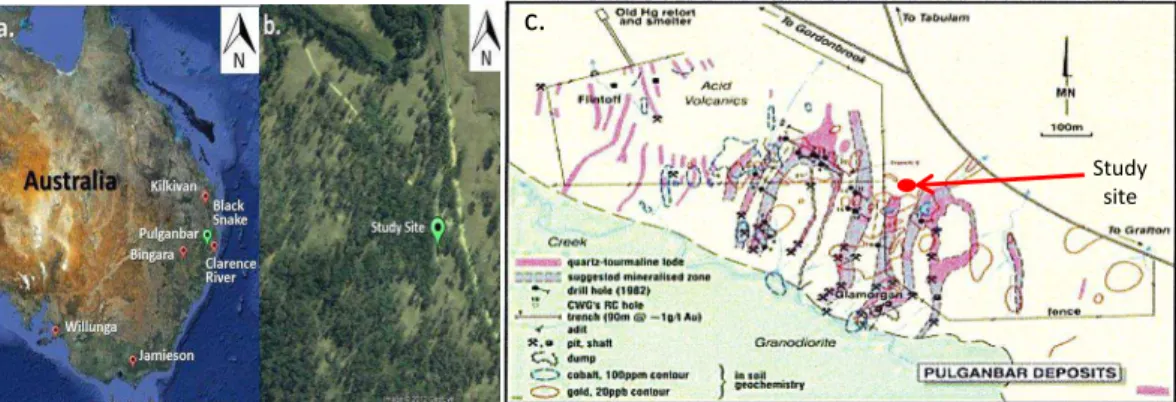
Pulganbar, NSW (29◦28′S and 152◦40′E, elevation 81 m; see Fig. 1) was selected
10
for the pilot studies as a known cinnabar deposit mined from 1914 to 1924. It was re-ported that 2000 tons of mercury ore were mined and treated from this deposit (NSW OEH, 2003). A reconnaissance survey of the area identified a natural undisturbed mea-surement site approximately 1 km south-east of the old mine and smelter location as shown in the mineralized zones in the sediment-acid volcanic sequence (Fig. 1c). The
15
area selected for the flux measurements was characterised by slightly rolling terrain, was sparsely treed with eucalypt (Fig. 1b) with the forest floor principally bare soil with scant leaf litter and sparse patches of grassy understory a few cm in height.
Exploration activity at the site carried out approximately a decade earlier (CWGOLD 2008) had left excavated mineralized material from the test pits and drill holes placed
20
on the surface. This mineralized material provided the basis for the enriched substrate measurements. In addition, several sites were selected nearby on the undisturbed over-burden to facilitate background measurements.
The site is rural, located on a cattle station far from any local anthropogenic sources other than potentially from the tailings of the old mine and smelter site. The Pulganbar
25
ACPD
12, 27927–27954, 2012Measurements of gaseous elemental mercury – Australia
G. C. Edwards and D. A. Howard
Title Page
Abstract Introduction
Conclusions References
Tables Figures
◭ ◮
◭ ◮
Back Close
Full Screen / Esc
Printer-friendly Version Interactive Discussion
Discussion
P
a
per
|
Dis
cussion
P
a
per
|
Discussion
P
a
per
|
Discussio
n
P
a
per
|
as a function of wind direction was performed. This analysis showed no wind sector bias in the flux data presented herein. Furthermore, the measurement site is located far from any anthropogenic sources on the regional scale.
2.2 Dynamic flux chamber method
Over the past decade considerable progress has been made towards optimizing
dy-5
namic flux chamber design and sampling methodologies (i.e. materials used, configu-ration, flushing flows rate, sampling protocols) to minimize perturbations to the natural system being measured and systematic sampling biases (Eckley et al., 2010; Carpi et al., 2007; Zhang et al., 2002; Kemp, 2001; Gillis and Miller, 2000) The dynamic flux method used here is described in detail in Kemp (2001) and Rasmussen et al. (2005).
10
The chamber design is of low profile, small footprint and is constructed of quartz glass. Spectroradiograph testing of materials common in mercury flux chamber construction found quartz glass to transmit the full spectrum of incoming solar radiation, in partic-ular UV-B (Fig. 2, Kemp, 2001). Quartz glass is easy to clean and has low sorption characteristics, resulting in low blank qualities.
15
Based on mass balance, steady state and well mixed assumptions the dynamic chamber flux is calculated using the following equation:
F =Q(Cout−Cin)/ A (1)
Where F is the mean flux of GEM (ng m−2h−1),Cout is the mean GEM leaving the
chamber (ng m−3),Cinis the mean GEM concentration entering the chamber (ng m−3),
20
Qis the volumetric flow rate (m3h−1) andAis the chamber areal footprint (m2).
A Tekran®2537 Total Gaseous Mercury Analyser coupled with a Tekran®1110
syn-chronized two port sampling system was used to measure GEM in the inlet and outlet air streams. The sampling protocol was designed to eliminate any mercury analyser
cartridge bias and switching/delay effects in the mean concentration difference
calcu-25
ACPD
12, 27927–27954, 2012Measurements of gaseous elemental mercury – Australia
G. C. Edwards and D. A. Howard
Title Page
Abstract Introduction
Conclusions References
Tables Figures
◭ ◮
◭ ◮
Back Close
Full Screen / Esc
Printer-friendly Version Interactive Discussion
Discussion
P
a
per
|
Dis
cussion
P
a
per
|
Discussion
P
a
per
|
Discussio
n
P
a
per
|
2.3 Experimental design and environmental measurements
Dynamic flux chamber flux measurements of gaseous elemental mercury were under-taken over enriched substrates and background soils at the Pulganbar site. Two pilot field studies were carried out during the Australian autumn (April) and winter (June).
Flux measurements were carried out over six locations during the April and June
5
field campaigns, three mercuriferous and three backgrounds, providing a basis for rep-resentative sampling and assessing variability. The sampling design also allowed for evaluation of the role of overburden and local deposition and variation in controlling parameters.
GEM fluxes were measured continuously at each chamber location except for short
10
periods for blank measurement, calibration checking and servicing the instrumentation. A short period at the beginning of the June study was dedicated to ambient concentra-tion measurement.
A number of meteorological and environmental parameters were measured simulta-neously during the monitoring periods using a suite of field portable instruments
de-15
scribed below. A small caravan housed the Tekran®2537 and computer. The site was
powered by a gasoline fuelled 6 KVA portable generator (Hg emission from exhaust,
at 1.18 ng m−3, was not significantly different from ambient Hg concentration measured
on site).
2.3.1 Environmental variables
20
Ambient measurements of air temperature, humidity, barometric pressure, wind speed and wind direction were obtained at screen height (i.e. 2 m) using a WXT520 mini weather station (Vaisala Pty Ltd.). Nearby, ten meter wind speed and direction were obtained using a propeller wind vane (R. M. Young Inc.). At the same location a tipping bucket precipitation sampler was deployed (Campbell Scientific Inc.). The four
compo-25
nents of solar radiation, long wave incoming, LW↓, and outgoing, LW↑, and short wave
ACPD
12, 27927–27954, 2012Measurements of gaseous elemental mercury – Australia
G. C. Edwards and D. A. Howard
Title Page
Abstract Introduction
Conclusions References
Tables Figures
◭ ◮
◭ ◮
Back Close
Full Screen / Esc
Printer-friendly Version Interactive Discussion
Discussion
P
a
per
|
Dis
cussion
P
a
per
|
Discussion
P
a
per
|
Discussio
n
P
a
per
|
(Campbell Scientific Inc.) at several locations in the measurement footprint at the 1.5 m height. UV-B (280 to 315 nm) was measured near the chamber location with a UVR1-B ultraviolet pyranometer (Middleton Inc.).
Air temperature and relative humidity were measured inside the chamber and just outside the chamber at the 30 cm height using a CS215 temperature and humidity
5
probe (Campbell Scientific Inc.). Soil temperature was measured using thermocouples placed in the soil surface at 2 cm within the chamber footprint, and at the same depth nearby outside the chamber footprint. A soil temperature profile was obtained near the chamber measurement location at the 2, 5 and 10 cm depths, complimented by soil heat flux plates at 5 cm depth. Soil moisture measurements were obtained using a
10
CS616 water content reflectometer (Campbell Scientific Inc.). Soil moisture was also obtained gravimetrically.
Data from the sensors described above were collected using Campbell Scientific Inc. data loggers.
2.3.2 Substrate sampling and analysis
15
At the end of the measurement period, for each chamber location, bulk soil samples
were collected from the chamber footprint (0.1 m2). Substrate samples were taken from
the surface interval (0 to 2 cm) and from a deeper interval (5 to 10 cm below the sur-face). Samples were dried and homogenized, and particle analysis was performed us-ing sieves. The total mercury (THg) concentration in the soil samples was determined
20
using a Milestone®DMA-80 mercury analyser (EPA Method 7473).
To enable comparison of Pulganbar GEM fluxes with NH flux studies where acid di-gestion and CV-ASS analysis was used for THg in soil, a set of Pulganbar soil sample duplicates were sent to an independent laboratory (National Measurement Institute, NSW), for analysis of total mercury using acid digestion and cold vapour atomic
ab-25
ACPD
12, 27927–27954, 2012Measurements of gaseous elemental mercury – Australia
G. C. Edwards and D. A. Howard
Title Page
Abstract Introduction
Conclusions References
Tables Figures
◭ ◮
◭ ◮
Back Close
Full Screen / Esc
Printer-friendly Version Interactive Discussion
Discussion
P
a
per
|
Dis
cussion
P
a
per
|
Discussion
P
a
per
|
Discussio
n
P
a
per
|
the two analytical methods were compared using a standard studentt-test. This
test-ing showed the means of the two methods not to be significantly different.
Elemental determinations were also carried out on the samples using XRF to obtain mineralization profiles. Soil samples were collected to determine soil bulk density. Soil organic and inorganic matter content was determined using the Loss of Ignition (LOI)
5
method described by Nelson and Sommers (1996).
3 Results and discussion
GEM chamber flux measurements were obtained at six locations at the Pulganbar site. Three locations were naturally enriched substrates labelled M1 to M3 and three were
background substrates (i.e.<0.1 µg g−1), labelled B1 to B3. Measurements were
un-10
dertaken over two periods, the first during autumn, 12 April 2011 to 19 April 2011 (DOY 102 to 109) and the second during winter, 17 June 2007 to 26 June 2007 (DOY 168 to 177). Locations M1, M2, B1 and B2 were measured during the April field campaign while M3 and B3 were measured during the June study. The results therefore span a range of substrate concentrations and climatic conditions.
15
Prior to starting the chamber measurements for the June study an ambient back-ground measurement was made over several hours during daytime at the 3 m level.
The average background recorded was 1.22±0.03 ng m−3(p <0.05).
3.1 Substrate characteristics
The mercuriferous substrates were granular sandy soils with grain size fractions of
ap-20
proximately 60 % granule, 20 % sand and 20 % silt plus clay. In contrast the background soils were 50 % silt plus clay, 30 % sand and 20 % granule. XRF analysis showed both mercuriferous and background soils to be approximately 50 % silicates with high Fe, Al, Ag, and Ti content. The mercuriferous soils were also high in Cu and As, while the background soils were below detection limit for these elements. Table 1 summarizes
ACPD
12, 27927–27954, 2012Measurements of gaseous elemental mercury – Australia
G. C. Edwards and D. A. Howard
Title Page
Abstract Introduction
Conclusions References
Tables Figures
◭ ◮
◭ ◮
Back Close
Full Screen / Esc
Printer-friendly Version Interactive Discussion
Discussion
P
a
per
|
Dis
cussion
P
a
per
|
Discussion
P
a
per
|
Discussio
n
P
a
per
|
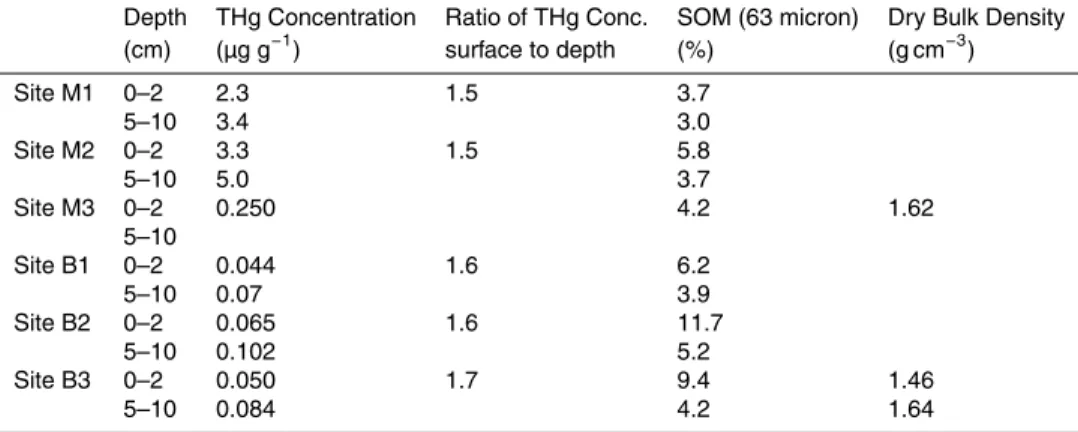
the mercuriferous and background THg content measured with the DMA-80, as well as soil organic matter and bulk density. Due to instrument malfunction soil moisture data are not available.
The THg substrate data consistently showed higher concentrations in the 5 to 10 cm layer than the 0 to 2 cm sample depth for all sites. The ratio of surface to depth THg
5
concentrations is also consistent across all sites with an average ratio of 1.6.
Background sites B1 and B3 were bare soil sites whereas site B2 was a sparsely
vegetated site with mostlyOehorizon leaf litter, twigs, and grass with someOi horizon
grass. Samples of these materials were collected and separated into two categories for analysis; (1) leaf litter and (2) grass and twigs. The samples were homogenized using a
10
stainless steel coffee mill and analysed using a DMA-80 (EPA method 7473). Results of
this analysis showed THg for leaf litter as 0.041±0.001 µg g−1and 0.044±0.005 µg g−1
for grass & twigs. The litter results interestingly compare with Oe horizon litter THg
reported recently by Obrist (2012) for 14 US forests. Lastly, it is noteworthy that Site
B2 also had the highest SOM in the 0 to 2 cm soil sample, suggesting an Oahorizon.
15
GEM flux and SOM will be discussed further in Sect. 3.3.
3.2 GEM flux measurements
The dynamic flux chamber measurements for the six sites were calculated half hourly and are reported here as average daytime and nighttime fluxes (defined by a net
ra-diation threshold of 20 W m−2) and overall flux averages for the period measurements
20
were made at that site. The data are presented in Table 2.
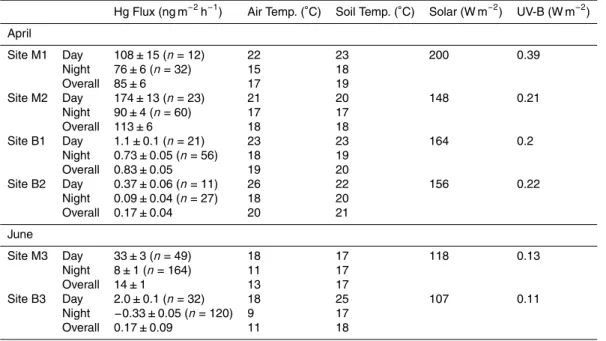
Mean day and night GEM fluxes showed both emission and deposition ranging
from a maximum emission of 174±13 ng m−2h−1 for daytime flux over a
mercurifer-ous substrate, to a deposition flux of−0.33±0.05 ng m−2h−1 for a nighttime flux over
a background substrate. Mean overall fluxes for all sites showed emission, with
back-25
ACPD
12, 27927–27954, 2012Measurements of gaseous elemental mercury – Australia
G. C. Edwards and D. A. Howard
Title Page
Abstract Introduction
Conclusions References
Tables Figures
◭ ◮
◭ ◮
Back Close
Full Screen / Esc
Printer-friendly Version Interactive Discussion
Discussion
P
a
per
|
Dis
cussion
P
a
per
|
Discussion
P
a
per
|
Discussio
n
P
a
per
|
The average GEM flux from all background sites gave means of 1.4±0.1 ng m−2h−1
(daytime) and 0.02±0.05 ng m−2h−1(nighttime) with an overall mean of 0.36±0.06
ng m−2h−1. This small net emission from the background sites is congruent with data
reported by others (Kuiken et al., 2008; Gustin et al., 2006) for low mercury containing substrates.
5
The naturally enriched substrates flux data (i.e. M1 to M3) were obtained over a range of substrate concentrations showing a clear relationship between flux and sub-strate concentration. This general relationship has been observed by others (Engle and Gustin, 2002; Edwards et al., 2001; Rasmussen et al., 1998) and will be explored further in Sect. 3.4.
10
3.3 Environmental correlates
To investigate environmental correlates, data from the June study were selected as
these data offered longer time series for a mercuriferous and background measurement
sites than the April data sets. Figure 3 presents diel composite graphs constructed using the half hour data obtained over four days at the mercuriferous site and four days
15
at the background site.
Figure 3a, b shows the diel flux cycle for the mercuriferous and backgrounds sites respectively, along with the corresponding diel composite of total incoming solar
radia-tion and UV-B (×103) to illustrate the relationship with these components of radiation.
The modality displayed in the composite diel flux graphs results from tree canopy
shad-20
ing variation with solar angle. The locations of the background and mercuriferous sites
were different with respect to canopy architecture, thus the modality differences seen
in the respective diel flux graphs.
It has been observed from laboratory based studies that UV-B radiation enhances GEM flux and it is suggested that this is due to UV-B directly reducing divalent forms
25
ACPD
12, 27927–27954, 2012Measurements of gaseous elemental mercury – Australia
G. C. Edwards and D. A. Howard
Title Page
Abstract Introduction
Conclusions References
Tables Figures
◭ ◮
◭ ◮
Back Close
Full Screen / Esc
Printer-friendly Version Interactive Discussion
Discussion
P
a
per
|
Dis
cussion
P
a
per
|
Discussion
P
a
per
|
Discussio
n
P
a
per
|
background flux diel patterns better mirror total incoming solar than UV-B, especially later in the day where peaks in the flux seen at 16:00 h at both sites are followed by
total solar but not by UV-B. Later in the day UV-B is seen to drop off. The relative role
of UV-B and total solar is unclear. If UV-B plays a role in GEM evasion it may be a function of intensity. The stronger correlation with total solar suggests the fluxes are
5
more temperature driven.
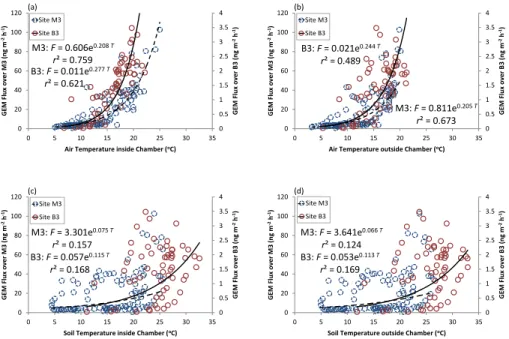
Figure 3c, d shows the same GEM diel flux data correlated with ambient air temper-ature and soil surface tempertemper-ature, measured within the chamber and the chamber’s soil surface footprint respectively. It is evident that the correlation with chamber air temperature is much stronger than with chamber footprint soil surface temperature.
10
During this study both soil surface temperature and chamber ambient air temper-ature were measured inside the chamber and just outside the chamber. This was done to investigate possible chamber influences on the natural temperature regime. Figure 4 shows the results of plotting these four temperatures with their correspond-ing half hourly GEM fluxes for emission only. It is clear from Fig. 4a, b compared to
15
Fig. 4c, d that the GEM fluxes are significantly better correlated with air temperature that soil temperature. This further supports what was observed in the results presented in Fig. 3c, d.
Comparison of the emission flux versus temperature relationships for temperatures within and outside the chamber (i.e. Fig. 4a vs. Fig. 4b and Fig. 4d vs. Fig. 4d) suggests
20
that the chamber is not significantly influencing the flux-temperature relationship. Fig-ure 4a shows a strong exponential relationship between the flux and air temperatFig-ure.
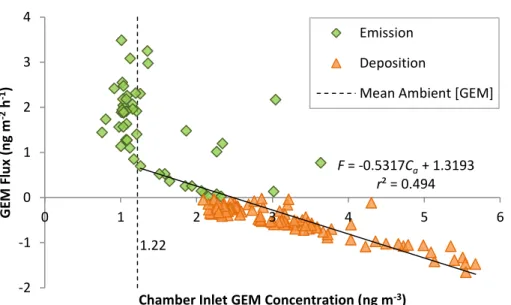
The data collected during the June study, as seen in Fig. 3, highlights that the background site displayed emission during the day and deposition at night. Xin and Gustin (2007) and Gustin et al. (2006) suggested that air GEM concentration is an
25
ACPD
12, 27927–27954, 2012Measurements of gaseous elemental mercury – Australia
G. C. Edwards and D. A. Howard
Title Page
Abstract Introduction
Conclusions References
Tables Figures
◭ ◮
◭ ◮
Back Close
Full Screen / Esc
Printer-friendly Version Interactive Discussion
Discussion
P
a
per
|
Dis
cussion
P
a
per
|
Discussion
P
a
per
|
Discussio
n
P
a
per
|
The dotted vertical line shows the ambient background Hg concentration measured
during the June study (i.e. 1.22±0.03 ng m−3), delineating those emission fluxes that
were removed from the linear correlation constructed in order to determine the com-pensation point. A strong linear relationship is seen, defining the comcom-pensation point
at 2.48 ng m−3. This corresponds well with the results of Xin and Gustin (2007).
5
Soil organic matter (SOM) has been suggested to influence the GEM flux from back-ground soils (Moore and Castro, 2012; Yang et al., 2007; Grigal, 2003). While data
from this study are not sufficient to fully explore this correlate, SOM does not appear
to correlate with the mercuriferous site fluxes as would be expected (Mauclair et al., 2008). However, the data in Tables 1 and 2 do show that the GEM flux decreases with
10
increasing SOM for the background sites.
3.4 Comparison with Northern Hemisphere data
In the absence of Southern Hemisphere air-surface exchange data, modelling efforts
applied to SH domains have had to rely on NH data for emission factors, deposition rates and associated empiricism. As such, natural emissions inventories for Australia
15
have been based on indirect estimates, rather than reliable data.
Over the past decade a series of field studies over naturally enriched and back-ground terrestrial landscapes were carried out in Canada and USA, (Edwards et al., 2001, 2002, 2005; Schroeder et al., 2005; Gustin et al., 1999a, b; Lindberg et al., 1999). Data from these studies showed a strong relationship between emission flux
20
and substrate concentration for naturally enriched sites and highlighted relationships with environmental factors such as temperature, solar radiation, precipitation, and soil moisture. For background substrates the relationship to substrate THg concentration is not as distinct, with air-surface exchange processes for these substrates being con-trolled by additional biological and chemical factors (Rasmussen et al., 2005).
Fig-25
ACPD
12, 27927–27954, 2012Measurements of gaseous elemental mercury – Australia
G. C. Edwards and D. A. Howard
Title Page
Abstract Introduction
Conclusions References
Tables Figures
◭ ◮
◭ ◮
Back Close
Full Screen / Esc
Printer-friendly Version Interactive Discussion
Discussion
P
a
per
|
Dis
cussion
P
a
per
|
Discussion
P
a
per
|
Discussio
n
P
a
per
|
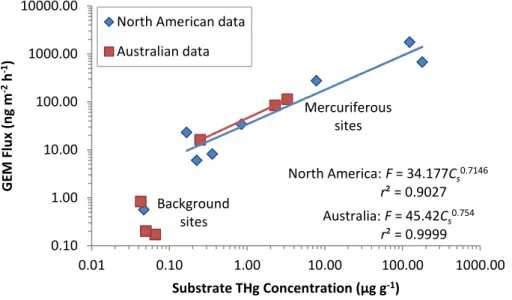
These data were collected over the NH summer season with an overall average
temperature of 14.3◦C. On the same plot we have displayed the data collected over
the mercuriferous and background substrates presented herein where the overall
av-erage temperature for these measurements was 15.5◦C. The Australian mercuriferous
and background data behaved in a similar manner as the NA data, with the naturally
5
enriched substrate data showing a strong relationship between emission flux and sub-strate concentration. The Australian background flux data behaved similar to the NA background flux data by not showing as strong a correlation with substrate THg.
Two separate trend lines were purposely fitted to the NA and Australian data from
mercuriferous sites with a view to illustrating differences in the average behaviour of the
10
naturally enriched data. The slopes for the two data sets are not significantly different
but the intercept is displaced upwards for the Australian data. This displacement is due
to an overall difference in environmental factors between the two data sets.
Tempera-ture is likely to be the principal reason for the shift upward of the Australian trend line as the average temperature of the Australian studies (i.e. autumn/winter season) and
15
the NA data (i.e. summer) data were 1.2◦C warmer for Australian data.
4 Summary and conclusions
Prior to undertaking the GEM air-surface exchange measurements presented here there were no direct measurements of Hg exchange available for Australian land-scapes. GEM fluxes were obtained over both naturally enriched and background soils
20
and over a range of climatic conditions during Australian autumn and winter periods. Large GEM emissions were observed over the naturally enriched sites compared to small net emissions from background sites, with background sites displaying both emis-sion and deposition.
Strong correlations were observed between the GEM flux and the climatic variables
25
ACPD
12, 27927–27954, 2012Measurements of gaseous elemental mercury – Australia
G. C. Edwards and D. A. Howard
Title Page
Abstract Introduction
Conclusions References
Tables Figures
◭ ◮
◭ ◮
Back Close
Full Screen / Esc
Printer-friendly Version Interactive Discussion
Discussion
P
a
per
|
Dis
cussion
P
a
per
|
Discussion
P
a
per
|
Discussio
n
P
a
per
|
uncertainty. GEM emission from both naturally enriched and background substrates correlated strongly with temperature. The background soils with higher soil organic matter showed relatively lower fluxes to those with less soil organic matter content. Exploration of the compensation point for bare soils showed a good agreement with the concept.
5
Strong correlations were observed between substrate THg and fluxes for the mer-curiferous sites but not for the background substrates. This general result is congruent with similar measurements in North America. Comparison of the Australian flux sub-strate relationship for mercuriferous subsub-strates with the North American relationship
showed good agreement with respect to slope however the intercept was offset. The
10
intercept offset was explained by the average temperature difference between the NA
and Australian data. This has interesting implications when it comes to using NA-based emission rates and empiricism to estimate Australian natural emission inventories.
Results from these two pilot studies strongly confirm the need for Australian specific data on air-surface exchange of atmospheric mercury. Characteristic and reliable data
15
are needed that are representative of Australia’s unique climatic conditions, vegeta-tion types, land use patterns, soils, and spatial and temporal variability. With the ratio of natural to anthropogenic sources thought to be 9 : 1, Australia presents a unique opportunity to study and address uncertainties in the global biogeochemical cycle of mercury associated with land-atmosphere cycling.
20
Acknowledgements. Authors would like to thank Macquarie University for funding which con-tributed to the Australian data presented in this paper. The Canadian data presented herein were funded by the Natural Sciences and Engineering Research Council of Canada (NSERC).
Thanks are extended to Orfeo Colebatch (Science Officer at Macquarie University) for
techni-cal and field study support and to Tanya Bradley for overseeing the processing of soil samples 25
ACPD
12, 27927–27954, 2012Measurements of gaseous elemental mercury – Australia
G. C. Edwards and D. A. Howard
Title Page
Abstract Introduction
Conclusions References
Tables Figures
◭ ◮
◭ ◮
Back Close
Full Screen / Esc
Printer-friendly Version Interactive Discussion
Discussion
P
a
per
|
Dis
cussion
P
a
per
|
Discussion
P
a
per
|
Discussio
n
P
a
per
|
References
ABS, Australian Bureau of Statistics: Year Book Australia, 1912, http://abs.gov.au/AUSSTATS, 1912.
BOM, Bureau of Meteorology: Australian Government, Climate of Australia, ISBN: 978 0 642 70601 0, printed by BPA print group PTY Ltd., 214 pp., 2008.
5
Carpi, A., Frei, A., Cocris, D., McCloskey, R., Contreras, E., and Ferguson, K.: Analytical ar-tifacts produced by a polycarbonate chamber compared to a teflon chamber for measuring surface mercury fluxes, Anal. Bioanal. Chem., 388, 361–365, doi:10.1007/s00216-006-1111-0, 2007.
CWGOLD, Central West Gold, 2008 annual report, http://www.centralwestgold.com.au, 2008. 10
Choi, H. D. and Holsen, T. M.: Gaseous mercury fluxes from the forest floor of the Adirondacks, Environ. Pollut., 157, 592–600, doi:10.1016/j.envpol.2008.08.020, 2009.
Cope, M. E., Hibbard M. F., Lee, S., McGregor,J. L., Meyer, C. P., Morrison, A. L., and Nelson, P. F.: The transport and fate of Mercury in Australia: Atmospheric Transport modelling and Dispersion, Appendix 1to report RFT100/0607 to Department of Environment, Water, and 15
Heritage and the Arts, The Centre for Australian Weather and Climate Research, 60 pp., 2009.
Eckley, C. S., Gustin, M., Lin, C. J., Li, X., and Miller, M. B.: The influence of dynamic cham-ber design and operating parameters on calculated surface-to- air mercury fluxes, Atmos. Environ., 44, 194–203, doi:10.1016/j.atmosenv.2009.10.013, 2010.
20
Edwards, G. C. and Howard, D. A.: Flux methods development and application to the mea-surement of the air-surface exchange of atmospheric mercury from natural sources over Australian ecosystems, Composition of the Atmosphere-Abstracts of the fifth CAWCR work-shop, Melbourne, Australia, 15–17 November 2011.
Edwards, G. C., Rasmussen, P. E., Schroeder, W. H., Kemp, R. J., Dias, G. M., Fitzgerald-25
Hubble, C. R., Wong, E. K., Halfpenny-Mitchell, L., and Gustin, M. S.: Sources of variability in mercury flux measurements, J. Geophys. Res.-Atmos., 106, 5421–5435, doi:10.1029/2000jd900496, 2001.
Edwards, G. C., Rasmussen, P. E., Ausma, S., Dharwarkar, G., Steffan, S., Hazlewood, P.,
Schroeder, W. H., and Dias, G. M.: The assessment of the evasion of mercury from a mer-30
ACPD
12, 27927–27954, 2012Measurements of gaseous elemental mercury – Australia
G. C. Edwards and D. A. Howard
Title Page
Abstract Introduction
Conclusions References
Tables Figures
◭ ◮
◭ ◮
Back Close
Full Screen / Esc
Printer-friendly Version Interactive Discussion
Discussion
P
a
per
|
Dis
cussion
P
a
per
|
Discussion
P
a
per
|
Discussio
n
P
a
per
|
CSCE/EWRI of ASCE International Conference on Environmental Engineering, Niagara Falls Canada, 21–24 July 2002.
Edwards, G. C., Rasmussen, P. E., Schroeder, W. H., Wallace, D. M., Halfpenny-Mitchell, L., Dias, G. M., Kemp, R. J., and Ausma, S.: Development and evaluation of a sampling system to determine gaseous mercury fluxes using an aerodynamic micrometeorological gradient 5
method, J. Geophys. Res-Atmos., 110, D10306, doi:10.1029/2004jd005187, 2005.
Engle, M. A. and Gustin, M. S.: Scaling of atmospheric mercury emissions from three naturally enriched areas: Flowery peak, Nevada; Peavine Peak, Nevada; and Long Valley Caldera, California, Sci. Total Environ., 290, 91–104, doi:10.1016/s0048-9697(01)01068-3, 2002. Gillis, A. and Miller, D. R.: Some potential errors in the measurement of mercury gas ex-10
change at the soil surface using a dynamic flux chamber, Sci. Total Environ., 260, 181–189, doi:10.1016/s0048-9697(00)00562-3, 2000.
Grigal, D. F.: Mercury sequestration in forests and peatlands: A review, J. Environ. Qual., 32, 393–405, 2003.
Gustin, M. S.: Are mercury emissions from geologic sources significant? A status report, Sci. 15
Total Environ., 304, 153–167, doi:10.1016/s0048-9697(02)00565-x, 2003.
Gustin, M. S., Lindberg, S., Marsik, F., Casimir, A., Ebinghaus, R., Edwards, G., Hubble- Fitzger-ald, C., Kemp, R., Kock, H., Leonard, T., London, J., Majewski, M., Montecinos, C., Owens, J., Pilote, M., Poissant, L., Rasmussen, P., Schaedlich, F., Schneeberger, D., Schroeder, W., Sommar, J., Turner, R., Vette, A., Wallschlaeger, D., Xiao, Z., and Zhang, H.: Nevada storms 20
project: Measurement of mercury emissions from naturally enriched surfaces, J. Geophys. Res.-Atmos., 104, 21831–21844, doi:10.1029/1999jd900351, 1999a.
Gustin, M. S., Rasmussen, P., Edwards, G., Schroeder, W., and Kemp, J.: Application of a laboratory gas exchange chamber for assessment of in situ mercury emissions, J. Geophys. Res.-Atmos., 104, 21873–21878, doi:10.1029/1999jd900344, 1999b.
25
Gustin, M. S., Engle, M., Ericksen, J., Lyman, S., Stamenkovic, J., and Xin, M.: Mercury ex-change between the atmosphere and low mercury containing substrates, Appl. Geochem., 21, 1913–1923, doi:10.1016/j.apgeochem.2006.08.007, 2006.
Gustin, M. S., Kolker, A., and G ˚ardfeldt, K.: Transport and fate of mercury in the environment, Appl. Geochem., 23, 343–344, doi:10.1016/j.apgeochem.2007.12.005, 2008.
30
ACPD
12, 27927–27954, 2012Measurements of gaseous elemental mercury – Australia
G. C. Edwards and D. A. Howard
Title Page
Abstract Introduction
Conclusions References
Tables Figures
◭ ◮
◭ ◮
Back Close
Full Screen / Esc
Printer-friendly Version Interactive Discussion
Discussion
P
a
per
|
Dis
cussion
P
a
per
|
Discussion
P
a
per
|
Discussio
n
P
a
per
|
Kuiken, T., Gustin, M., Zhang, H., Lindberg, S., and Sedinger, B.: Mercury emission from terrestrial background surfaces in the eastern USA. II: Air/surface exchange of mer-cury within forests from South Carolina to New England, Appl. Geochem., 23, 356–368, doi:10.1016/j.apgeochem.2007.12.007, 2008.
Lindberg, S. E., Zhang, H., Gustin, M., Vette, A., Owens, J., Marsik, F., Casimir, A., Ebinghaus, 5
R., Edwards, G.C., Fitzgerald,C., Kemp, J., Kock, H. H., London, J., Majewski, M., Poissant, L., Pilote, M., Rasmussen, P. E., Schaedlich, F., Schneeberger, D., Sommar, J., Turner, R., Wallschlaeger, D., and Xiao, Z.: Increases in mercury emissions from desert soils in response to rainfall and irrigation, J. Geophys. Res., 104, 21879–21888, 1999.
Mauclair, C., Layshock, J., and Carpi, A.: Quantifying the effect of humic matter on
10
the emission of mercury from artificial soil surfaces, Appl. Geochem., 23, 594–601, doi:10.1016/j.apgeochem.2007.12.017, 2008.
Moore, C. and Carpi, A.: Mechanisms of the emission of mercury from soil: Role of UV radiation, J. Geophys. Res.-Atmos., 110, D24302, doi:10.1029/2004jd005567, 2005.
Moore, C. W. and Castro, M. S.: Investigation of factors affecting gaseous mercury
concentra-15
tions in soils, Sci. Total Environ., 419, 136–143, doi:10.1016/j.scitotenv.2011.12.068, 2012. Nelson, D. W. and Sommers, L. E.: Total carbon, organic carbon, and organic matter, in:
Meth-ods of Soil Analysis part 3. Chemical methMeth-ods, edited by: Sparks, D. L., Page, A. L., Helmke, P. A., Loeppert, R. H., Soltanpour, P. N., Tabatabai, M. A., Johnston, C. T., and Sumner, M. E., Soil Science Society of America, Madison, Wisconsin, 961–1010, 1996.
20
Nelson, P. F., Peterson, C., and Morrison, A.: Atmospheric emissions of mercury–sources and chemistry, Clean Air & Environmental Quality, 36, 48–55, 2004.
Nelson, P. F., Nguyen, H., Morrison, A. L., Malfroy, H., Cope, M. E., Hibberd, M. F., Lee, S., McGregor, J. L., and Meyer, M. C.: Mercury sources, transportation and fate in Australia, Department of Environment, Water, Heritage & the Arts, RFT 100/0607, 2009.
25
Nelson, P. F., Morrison, A. L., Malfroy H., Cope, M., Lee, S., Hibberd, M. F., Meyer, M. C., and McGregor, J. L.: Atmospheric mercury emissions in Australia from anthropogenic, natural and recycled sources, Atmos. Environ., 62, 291–302, 2012.
NSW, New South Wales Office of Environment and Heritage (OEH): Pulganbar Smelter & Mines
Heritage Report, http://www.heritage.nsw.gov.au, 2003. 30
ACPD
12, 27927–27954, 2012Measurements of gaseous elemental mercury – Australia
G. C. Edwards and D. A. Howard
Title Page
Abstract Introduction
Conclusions References
Tables Figures
◭ ◮
◭ ◮
Back Close
Full Screen / Esc
Printer-friendly Version Interactive Discussion
Discussion
P
a
per
|
Dis
cussion
P
a
per
|
Discussion
P
a
per
|
Discussio
n
P
a
per
|
Pirrone, N., Hedgecock, I. M., Cinnirella, S., and Sprovieri, F.: Overview of major processes and
mechanisms affecting the mercury cycle on different spatial and temporal scales, in: ERCA 9
– From the global mercury cycle to the discoveries of Kuiper belt objects, edited by: Boutron, C., EPJ Web of Conferences, 3–33, 2010.
Rasmussen, P. E., Edwards, G. C., Kemp, J., Hubble-Fitzgerald, C., Schroeder, W. H.: Towards 5
and improved natural sources inventory for mercury, in: the proceedings of Metals in the Environment: An international symposium, edited by: Skeaf, J., Metallurgical Society of the Canadian Institute of Mining, Metallurgy, and Petroleum (CIM), Montreal, 73–83, 1998.
Rasmussen, P. E., Edwards, G. C., Schroeder, W. H., Ausma, S., Steffen, A., Kemp, J.,
Hubble-Fitzgerald, C., El Bilali, L., and Dias, G.: Chapter 7: Measurement of gaseous mercury fluxes 10
in the terrestrial environment, in: Mercury: Sources, Measurements, Cycles and Effects.
Short Course Series Vol. 34, Mineralogical Association of Canada, Halifax, Nova Scotia, 2005.
Rytuba, J. J.: Mercury from mineral deposits and potential environmental impact, Environ. Geol. 43, 326–338, 2003.
15
Rytuba, J. J.: Geogenic and mining sources of mercury to the environment. Chapter 2, in:
Mercury: Sources, Measurements, Cycles and Effects. Short Course Series Vol. 34,
Miner-alogical Association of Canada, Halifax, Nova Scotia, 2005.
Schroeder, W. H., Beauchamp, S., Edwards, G., Poissant, L., Rasmussen, P., Tordon, R., Dias, G., Kemp, J., Van Heyst, B., and Banic, C. M.: Gaseous mercury emissions 20
from natural sources in Canadian landscapes, J. Geophys. Res-Atmos., 110, D18302, doi:10.1029/2004jd005699, 2005.
Selin, N. E.: Global biogeochemical cycling of mercury: A review, Annu. Rev. Env. Resour., 34, 43–63, doi:10.1146/annurev.environ.051308.084314, 2009.
United Nations Environment Programme Global Mercury Partnership (UNEP): Session MS18-25
01, 10th International Conference on Mercury as a Global Pollutant (ICMGP), 24–29 July, Halifax, Nova Scotia, 2011.
Xin, M. and Gustin, M. S.: Gaseous elemental mercury exchange with low mercury containing soils: Investigation of controlling factors, Appl. Geochem., 22, 1451–1466, doi:10.1016/j.apgeochem.2007.02.006, 2007.
30
Yang, Y.-k., Zhang, C., Shi, X.-J., Lin, T., and Wang, D.-Y.: Effect of organic matter and
ACPD
12, 27927–27954, 2012Measurements of gaseous elemental mercury – Australia
G. C. Edwards and D. A. Howard
Title Page
Abstract Introduction
Conclusions References
Tables Figures
◭ ◮
◭ ◮
Back Close
Full Screen / Esc
Printer-friendly Version Interactive Discussion
Discussion
P
a
per
|
Dis
cussion
P
a
per
|
Discussion
P
a
per
|
Discussio
n
P
a
per
|
Table 1.Summary of average substrate THg concentration, soil organic matter, and bulk den-sity.
Depth THg Concentration Ratio of THg Conc. SOM (63 micron) Dry Bulk Density (cm) (µg g−1) surface to depth (%) (g cm−3)
Site M1 0–2 2.3 1.5 3.7
5–10 3.4 3.0
Site M2 0–2 3.3 1.5 5.8
5–10 5.0 3.7
Site M3 0–2 0.250 4.2 1.62
5–10
Site B1 0–2 0.044 1.6 6.2
5–10 0.07 3.9
Site B2 0–2 0.065 1.6 11.7
5–10 0.102 5.2
Site B3 0–2 0.050 1.7 9.4 1.46
ACPD
12, 27927–27954, 2012Measurements of gaseous elemental mercury – Australia
G. C. Edwards and D. A. Howard
Title Page
Abstract Introduction
Conclusions References
Tables Figures
◭ ◮
◭ ◮
Back Close
Full Screen / Esc
Printer-friendly Version Interactive Discussion
Discussion
P
a
per
|
Dis
cussion
P
a
per
|
Discussion
P
a
per
|
Discussio
n
P
a
per
|
Table 2.Summary of GEM fluxes and environmental parameters measured over six locations at the Pulganbar site during the April and June field campaigns.
Hg Flux (ng m−2
h−1
) Air Temp. (◦C) Soil Temp. (◦C) Solar (W m−2
) UV-B (W m−2
)
April
Site M1 Day 108±15 (n=12) 22 23 200 0.39
Night 76±6 (n=32) 15 18
Overall 85±6 17 19
Site M2 Day 174±13 (n=23) 21 20 148 0.21
Night 90±4 (n=60) 17 17
Overall 113±6 18 18
Site B1 Day 1.1±0.1 (n=21) 23 23 164 0.2
Night 0.73±0.05 (n=56) 18 19
Overall 0.83±0.05 19 20
Site B2 Day 0.37±0.06 (n=11) 26 22 156 0.22
Night 0.09±0.04 (n=27) 18 20
Overall 0.17±0.04 20 21
June
Site M3 Day 33±3 (n=49) 18 17 118 0.13
Night 8±1 (n=164) 11 17
Overall 14±1 13 17
Site B3 Day 2.0±0.1 (n=32) 18 25 107 0.11
Night −0.33±0.05 (n=120) 9 17
ACPD
12, 27927–27954, 2012Measurements of gaseous elemental mercury – Australia
G. C. Edwards and D. A. Howard
Title Page
Abstract Introduction
Conclusions References
Tables Figures
◭ ◮
◭ ◮
Back Close
Full Screen / Esc
Printer-friendly Version Interactive Discussion
Discussion
P
a
per
|
Dis
cussion
P
a
per
|
Discussion
P
a
per
|
Discussio
n
P
a
per
|
c.
Study site
Fig. 1.Locations of pilot studies at Pulganbar, NSW.(a)Image from Google Earth maps 2010.
(b)Aerial photograph of Pulganbar site (Google Earth image).(c)Pulganbar deposits (Central
ACPD
12, 27927–27954, 2012Measurements of gaseous elemental mercury – Australia
G. C. Edwards and D. A. Howard
Title Page
Abstract Introduction
Conclusions References
Tables Figures
◭ ◮
◭ ◮
Back Close
Full Screen / Esc
Printer-friendly Version Interactive Discussion
Discussion
P
a
per
|
Dis
cussion
P
a
per
|
Discussion
P
a
per
|
Discussio
n
P
a
per
|
ACPD
12, 27927–27954, 2012Measurements of gaseous elemental mercury – Australia
G. C. Edwards and D. A. Howard
Title Page Abstract Introduction Conclusions References Tables Figures ◭ ◮ ◭ ◮ Back Close
Full Screen / Esc
Printer-friendly Version Interactive Discussion Discussion P a per | Dis cussion P a per | Discussion P a per | Discussio n P a per |
(a) (b)
(c) (d)
UV-B (·103)
-80 -40 0 40 80 120 160 200 240 280 320 -20 -10 0 10 20 30 40 50 60 70 80
1 2 3 4 5 6 7 8 9 101112131415161718192021222324
R ad iation ( W m -2) GE M Fl u x (ng m
-2 h -1)
Hour of Day
Site M3 GEM Flux
Solar
UV-B (·103)
-80 -40 0 40 80 120 160 200 240 280 320 -1 -0.5 0 0.5 1 1.5 2 2.5 3 3.5 4
1 2 3 4 5 6 7 8 9 101112131415161718192021222324
R ad iation ( W m -2) GE M Fl u x (ng m
-2 h -1)
Hour of Day
Site B3 GEM Flux
Solar -8 -4 0 4 8 12 16 20 24 28 32 -20 -10 0 10 20 30 40 50 60 70 80
1 2 3 4 5 6 7 8 9 10 11121314151617 18192021222324
Tem p e ratu re ( oC) GE M Fl u x (ng m
-2 h -1)
Hour of Day
Site M3 GEM Flux
Air Temperature Soil Temperature -8 -4 0 4 8 12 16 20 24 28 32 -1 -0.5 0 0.5 1 1.5 2 2.5 3 3.5 4
1 2 3 4 5 6 7 8 9 101112131415161718192021222324
Tem p e ratu re ( oC) GE M Fl u x (ng m
-2 h -1)
Hour of Day
Site B3 GEM Flux
Air Temperature
Soil Temperature
Fig. 3.Diel composite GEM flux, radiation and temperature data from June study. Top graphs
compare GEM flux with radiation measurements taken over a mercuriferous (a) and
back-ground(b)site. Bottom graphs compare GEM flux with temperature measurements taken over
ACPD
12, 27927–27954, 2012Measurements of gaseous elemental mercury – Australia
G. C. Edwards and D. A. Howard
Title Page Abstract Introduction Conclusions References Tables Figures ◭ ◮ ◭ ◮ Back Close
Full Screen / Esc
Printer-friendly Version Interactive Discussion Discussion P a per | Dis cussion P a per | Discussion P a per | Discussio n P a per |
(a) (b)
(c) (d)
0 0.5 1 1.5 2 2.5 3 3.5 4 0 20 40 60 80 100 120
0 5 10 15 20 25 30 35
GE M Fl u x o v e r B 3 (ng m
-2 h -1) GE M Fl u x o v e r M 3 (ng m
-2 h -1)
Air Temperature inside Chamber (oC) Site M3
Site B3
M3: F = 0.811e0.205 T
r² = 0.673 B3: F = 0.021e0.244 T
r² = 0.489
0 0.5 1 1.5 2 2.5 3 3.5 4 0 20 40 60 80 100 120
0 5 10 15 20 25 30 35
GE M Fl u x o v e r B 3 (ng m
-2 h -1) GE M Fl u x o v e r M 3 (ng m
-2 h -1)
Air Temperature outside Chamber (oC) Site M3
Site B3
M3: F = 3.301e0.075 T
r² = 0.157
B3: F = 0.057e0.115 T
r² = 0.168
0 0.5 1 1.5 2 2.5 3 3.5 4 0 20 40 60 80 100 120
0 5 10 15 20 25 30 35
GE M Fl u x o v e r B 3 (ng m
-2 h -1) GE M Fl u x o v e r M 3 (ng m
-2 h -1)
Soil Temperature inside Chamber (oC)
Site M3 Site B3
M3: F = 3.641e0.066 T
r² = 0.124
B3: F = 0.053e0.113 T
r² = 0.169
0 0.5 1 1.5 2 2.5 3 3.5 4 0 20 40 60 80 100 120
0 5 10 15 20 25 30 35
GE M Fl u x o v e r B 3 (ng m
-2 h -1) GE M Fl u x o v e r M 3 (ng m
-2 h -1)
Soil Temperature outside Chamber (oC)
Site M3 Site B3
B3: F = 0.011e0.277 T
r² = 0.621 M3: F = 0.606e0.208 T
r² = 0.759
Fig. 4.GEM emissions fluxes compared to temperature measurements taken over mercurif-erous site M3 (blue, dotted, left scale) and background site B3 (red, solid, right scale) during
June study. Top graphs show air temperature data taken inside (a) and outside (b) the flux
chamber. Bottom graphs show soil surface temperature data taken inside(c)and outside(d)
the chamber footprint. Equations andr2values are for least squares exponential curves, where
ACPD
12, 27927–27954, 2012Measurements of gaseous elemental mercury – Australia
G. C. Edwards and D. A. Howard
Title Page
Abstract Introduction
Conclusions References
Tables Figures
◭ ◮
◭ ◮
Back Close
Full Screen / Esc
Printer-friendly Version Interactive Discussion
Discussion
P
a
per
|
Dis
cussion
P
a
per
|
Discussion
P
a
per
|
Discussio
n
P
a
per
|
F = -0.5317Ca + 1.3193
r² = 0.494
-2 -1 0 1 2 3 4
0 1 2 3 4 5 6
GE
M
Fl
u
x
(ng
m
-2 h -1)
Chamber Inlet GEM Concentration (ng m-3)
Emission
Deposition
Mean Ambient [GEM]
1.22
Fig. 5.GEM fluxes, and GEM concentrations at the chamber inlet, taken over Site B3 during June study. Chamber inlet GEM concentrations greater than the mean ambient taken at the
beginning of the study were used to construct the linear least squares trend, whereF=GEM
ACPD
12, 27927–27954, 2012Measurements of gaseous elemental mercury – Australia
G. C. Edwards and D. A. Howard
Title Page
Abstract Introduction
Conclusions References
Tables Figures
◭ ◮
◭ ◮
Back Close
Full Screen / Esc
Printer-friendly Version Interactive Discussion
Discussion
P
a
per
|
Dis
cussion
P
a
per
|
Discussion
P
a
per
|
Discussio
n
P
a
per
|
Australia: F = 45.42Cs0.754
r² = 0.9999
North America: F = 34.177Cs0.7146
r² = 0.9027
0.10 1.00 10.00 100.00 1000.00 10000.00
0.01 0.10 1.00 10.00 100.00 1000.00
GE
M
Fl
u
x
(n
g
m
-2 h -1)
Substrate THg Concentration (µg g-1) North American data
Australian data
Mercuriferous sites
Background sites
Fig. 6. Mean GEM flux and substrate THg data taken over Australian and North American mercuriferous and background sites. Linear least squares lines are fitted to mercuriferous sites