Who Studies Which Language and Why? : A Cross-Language Survey of First-Year College-Level Language Learners
Kathryn M. Howard University of Pennsylvania
Rachel R. Reynolds Drexel University
Julia Deák
University of Pennsylvania
Abstract
Introduction
In a now often-cited essay, Gambhir (2001) draws a distinc-tion between Less Commonly Taught Languages (LCTLs) and Truly Less Commonly Taught languages (TLCTLs) in the United States. Language programs in the latter, he argues, “face special pedagogic and administrative issues and challenges” (208), with low enrollment numbers and high proportions of heritage language learners. In this article we complicate this distinction, exploring more specifically how the political, economic, and social contexts of language study in the U.S. influence student choices for language study. Reporting data from a survey of students in first-year modern language courses at two universities, the paper investigates which students are choosing to study particular languages at the beginning level and why.
One cannot overlook political, economic, and historical con-ditions that impact not only how immigrant and foreign communities are (mis)understood within the US, but also how these conditions affect the communities themselves, and individuals within those communities (Hornberger & Wang, 2007). The makeup, nature, and location of immigrant communities have been strongly influenced by immigration policies throughout the 20th century. Many of these laws have been strongly ethnocentric, supporting a nativist view of Ameri-ca as essentially protestant, white, English speaking and European. For example, US law placed severe limits on the number of Japanese and Chinese persons allowed to immigrate in the early 20th century, and the National Origins Act of 1924 restricted immigration from non-European groups, leading to larger numbers of Christian, Euro-pean immigrants than those from other races, nationalities, or reli-gious backgrounds. In 1965, the Hart-Celler Act loosened such re-strictions after which immigration from Asia and Latin America increased dramatically. In addition, new Asylum laws during the 1960’s opened the door to many immigrants from Cuba and Vietnam (Hornberger & Wang, 2007; Kumaravadivelu, 2008).
fit within this image may legitimately be considered members of our national community, have led to a double standard regarding lan-guage study. While the study of so-called ‘foreign’ lanlan-guages has been conceptualized (for the most part) as an enriching experience for “truly” American mainstream youth, the maintenance of minority or immigrant languages has been viewed, in some quarters, as a threat to national unity (Pavlenko, 2003; Valdés, 2006). This has affected lan-guage policies and practices regarding which lanlan-guages are offered at which educational levels, who should teach the languages, how they should be taught, and who should be studying them for what purpose (Crawford, 1989; Pavlenko, 2003; Valdés, González, García, & Már-quez, 2008). For the most part, the languages and cultures of our in-digenous and immigrant communities have been painted as toxic to our imagined national identity and, since World War II; we have fo-cused our language educational resources on the languages of per-ceived national enemies or allies as foreign or additional languages. This of course continues into the present context in which national energy and resources are being poured into languages that are per-ceived as ‘critical’ to our national security (Kramsch, 2005).
histori-cal, and geographic context of language classes needs to be taken into consideration when examining the programmatic and pedagogical implications of students’ background and motivation in particular languages.
The Study
Mid way through their second term, students in first year modern language courses at two universities were asked to complete a paper survey (19 questions, see Appendix A). The survey was de-signed to explore the language being taken, motivators for studying the language, self-reported (receptive) proficiency, prior experience and exposure to the language, career plans and goals, expectations for future language study, perceptions about the relevance of the lan-guage to their career, interests in specific aspects of lanlan-guage instruc-tion (such as slang, cultural informainstruc-tion, etc.), student educainstruc-tion level and major, and more, through Likert scale, open-ended and closed questions. Teachers were contacted to invite their participation in the study, and surveys were distributed to those classes whose instructors agreed to participate. Out of 46 languages offered at the University of Pennsylvania, respondents included students enrolled in 15 different languages out of 46 languages offered, while respondents at Drexel University included students enrolled in all 8 languages offered there (see Reynolds et al 2009 for details). Students were told the survey was anonymous and voluntary, and the survey took 5-10 minutes to administer. Data were compiled using SPSS software. Because the number of students surveyed for some languages was relatively low, the survey sample did not provide us with statistically verifiable re-sults for comparing across individual languages. Another weakness of our sample was that not all sections of every language offered at both universities were surveyed. For example, we surveyed only sections of Mandarin Chinese, German or Japanese offered at Drexel University- a science and technology oriented institution; and many courses of-fered at the University of Pennsylvania were not available at the other institution. This difference may have biased our findings somewhat.
Learners” were defined as students who reported that the target lan-guage was regularly spoken in their home growing up. 2) Broadly defined “Heritage Language Learners” were defined as those students who reported that the language was not used regularly at home and who nevertheless responded that they wanted to learn the language in order to understand their heritage or to connect with family. 3) Non-Heritage Language Learners did not fit into either HLL group. Of the 401 students surveyed across languages at the two universities, 14% were narrowly defined HLLs, 27 % were broadly defined HLLs and 60% were non-HLLs (Reynolds et al 2009). That such a significant percentage of first-year ‘foreign’ lan-guage learners report heritage or family connections to the lanlan-guages being studied in itself seems to fly in the face of the monolingual ide-ology (Valdés et al., 2008) that beginning language courses cater pri-marily to language learners who are studying the language and culture of some “other” group.
survey across many universities to obtain reliable data (such as the UCLA Heritage Language Survey), especially for TLCTLs.1
Findings
Who Studies Which Languages?
This section examines various characteristics of the learners studying the languages surveyed, including the breakdown of differ-ent learner types in the languages, their fields of study, their university level, and their self-reported previous competence in and exposure to the language. Across all 19 languages, 43.8% of students in these first-year language courses were freshmen undergraduates, while the courses also included learners across the university levels. Of the 401 students surveyed, 322 (80.3%) reported that they were born in the US. Seven students did not answer the question. The remaining 72 (17.9%) students were born abroad in 41 different countries. There was no significant difference in the proportions of US-born to for-eign-born students between the two universities.
Due to the fact that most immigrant groups shift from their heritage language to English within one or two generations in the United States, one might surmise that courses in the languages of more recent immigrant groups would draw a larger number of herit-age languherit-age learners than would the languherit-ages of groups that immi-grated in large numbers to the United States much earlier. To explore this question, we compared the percentage of each learner type (nar-row HLL, broad HLL, or non-HLL) studying the languages of com-munities that were able to immigrate in increased numbers due to the Hart-Celler Immigration Act of 1965 to the percentage of each learn-er type studying othlearn-er languages, because those groups would likely include more second generation immigrant children of college age than other groups. We compared these ‘Post-65 immigrant’ lan-guages, which include the African languages (aggregated here),
Ara-1 We suspect that such a survey would also detect significant geographical and
institutional differences in the types of learners and motivating factors for
lan-guage study.
bic, Mandarin Chinese, Korean, and Vietnamese,2 with languages that are less obviously tied to that immigration trend including ASL, French, German, Hebrew, Hungarian, Italian, Japanese, Russian, Spanish,3 Turkish, Ukrainian, and Yiddish. The results are presented as percentages in Table 1.
Table 1: Learner Types in Post-65 Immigrant versus Other Languages
language type narrow (N=55) broad (N=107) non (N=238)
A: Post-65
African Languages 6 6 5
Chinese 2 6 15
Arabic 12 10 31
Korean 12 3 9
Vietnamese 11 1 0
SUB-TOTAL 43 26 60
2 We thank an anonymous reviewer who reviewed our previous paper (Reynolds
et al 2009) for Foreign Language Annals for pointing out that these languages
all use non-Western scripts as well.
3 Spanish was included with ‘other’ languages because, while it has long been
and continues to be a major language of international migrants to the U.S., it is
not as clearly linked to the immigration trends resulting from the Hart-Celler Act
of 1965. Moreover, in the metropolitan area of the Northeastern United States in
which this study was conducted, Spanish speaking immigrants have only
recent-ly begun to grow in numbers. In other regions of the United States, however,
Spanish is such an important ‘heritage language’ that many institutions of higher
education offer separate tracks for students with previous knowledge of the
lan-guage. It is striking, in fact, that the Spanish courses at these two universities
contained so few learners with heritage connections to Spanish. Spanish also
differs from the other languages in the Post-65 category in that it utilizes a
Western script.
% in Post-65 78.2% 24.3% 25.2%
B: Other
ASL 0 5 30
French 0 3 12
German 0 5 9
Hebrew 0 16 1
Hungarian 0 1 3
Italian 3 31 47
Japanese 0 1 16
Russian 4 6 13
Spanish 1 6 44
Turkish 0 2 0
Ukrainian 4 1 1
Yiddish 0 4 2
SUB-TOTAL 12 81 178
% in Other 21.8% 75.7% 74.8%
TOTAL 100% 100% 100%
orthog-raphies (Mandarin Chinese, Arabic, Korean, Vietnamese, Russian and Ukrainian).
Previous research on heritage language learning identifies the distinctive needs and challenges involved in teaching languages that are less commonly taught in the United States. For example, Gambhir (2001) stresses that truly less commonly taught language courses (TLCTLs) include the highest proportions of heritage language learners, while less commonly taught (LCTLs) and commonly taught language courses (CTLs) include higher proportions of non heritage language learners. Drawing on
Gam-bhir’s categories, we expected that different proportions of our three learner
types would be found in the TLCTLs (Amharic, ASL, Hebrew, Hungarian, Igbo, Korean, Turkish, Ukrainian, Vietnamese, Yiddish, and Zulu), LCTLs (Arabic, Mandarin Chinese, Italian, Japanese) and CTLs (French, German, Russian, Spanish) that we surveyed. Table 2 shows these proportions.
Table 2: Breakdown of Learner Types by Language
TLCTLs Narrow HLLs Broad HLLs
non-HLLs
Amharic (N=5) 60.00% 20.00% 20.00%
ASL (N=35) 0.00% 14.30% 85.70%
Hebrew (N=17) 0.00% 94.10% 5.90%
Hungarian (N=4) 0.00% 25.00% 75.00%
Igbo (N=5) 60.00% 40.00% 0.00%
Korean (N=24) 50.00% 12.50% 37.50%
Turkish (N=2) 0.00% 100.00% 0.00%
Ukrainian (N=6) 66.70% 16.70% 16.70%
Vietnamese (N=12) 91.70% 8.30% 0.00%
Yiddish (N=6) 0.00% 66.70% 33.30%
Zulu (N=7) 0.00% 42.90% 57.10%
LCTLs
Arabic (N=53) 22.60% 18.90% 58.50%
Chinese (N=23) 8.70% 26.10% 65.20%
Italian (N=82) 3.70% 38.30% 58.00%
Japanese (N=17) 0.00% 5.90% 94.10%
CTLs
French (N=15) 0.00% 20.00% 80.00%
German (N=14) 0.00% 35.70% 64.30%
Spanish (N=51) 2.00% 11.80% 86.30% The category with the largest proportion of learners per language has been highlighted.
As expected, heritage language learners were found in higher proportions in language courses that are truly less commonly taught in US institutions of higher education. We now turn to a closer exam-ination of the variation within these categories of language courses.
Truly Less Commonly Taught Languages: The TLCTLs that we surveyed included Amharic, ASL, Hebrew, Hungarian, Igbo, Korean, Turkish, Ukrainian, Vietnamese, Yiddish and Zulu. The TLCTLs that showed the highest proportions of narrowly defined heritage lan-guage learners were Vietnamese (92%), Ukrainian (67%), Igbo and Amharic (60%), and Korean (50%), most of which are Post-65 immi-grant languages. Yiddish, Hebrew and Turkish on the other hand, had no narrowly defined HLLs, but close to 100% broadly defined HLLs. ASL, Hungarian and Zulu were exceptions to this pattern, all with a majority of non-HLLs enrolled in the first-year courses.
Less Commonly Taught Languages: The LCTLs in our survey in-cluded Arabic, Mandarin Chinese, Italian, and Japanese. As expected, all of these courses had higher enrollments than most of the TLCTLs surveyed, and the majority of students in each of these courses were non heritage language learners: Non-HLLs constituted 58.5% of dents in Arabic, 65.2% of students in Mandarin Chinese, 58% of stu-dents in Italian, and 94% of stustu-dents in Japanese. In all of these lan-guage courses except Arabic, most of the heritage learners were broadly defined rather than narrowly defined HLLs: Among the Mandarin Chinese learners surveyed, 26.1% were broad HLLs and only 8.7% were narrow HLLs; among Italian learners, 38.3% were broad HLLs and 3.7% were narrow HLLs; among Japanese learners, only 5.9% were HLLs, all broadly defined. By contrast, HLLs study-ing Arabic were more evenly divided between narrow HLLs (22.6%), and broad HLLs (18.9%).
% of Spanish learners were narrow HLLs. Unlike these other CTLs, however, nearly half of Russian learners were heritage language learn-ers: 17.4% were narrowly defined HLLs, while 26.1% were broad HLLs. This may be due to differing immigration trends and/or geo-graphical location.
Most narrowly defined heritage language learners identified in the survey (those who reported regularly hearing the language in their home) were studying the languages of more recent immigrant com-munities, and courses in the truly less commonly taught languages included a majority of heritage language learners. The Post-65 immi-grant languages that are truly less commonly taught, in particular, drew a high percentage of the narrowly defined heritage language learners in our survey, and these learners usually comprised the ma-jority of learners in these classes. TLCTLs not affected by these im-migration trends (Hebrew, Turkish, and Yiddish) tended to have higher proportions of broadly defined HLLs in comparison to other learner types. Among the less commonly taught and commonly taught languages, Russian and Arabic drew comparatively high pro-portions of narrowly defined heritage language learners.
Fields of Study
To understand how particular languages draw students from different fields of study, our survey asked learners to identify their field of study (see survey question 12, Appendix A). Looking at the raw data (see Appendix B) we may suggest some trends to be explored in future studies. Most notably, high percentages of students were business majors in both Mandarin Chinese (69.6%) and Spanish (52.9%) courses. Exceptionally high percentages of Hebrew (41.2%) and Italian (39%) learners, on the other hand, identified as Arts/ Humanities/ Social Science majors. Self-identified government/ mili-tary fields were found only in Arabic, Korean, Russian and Italian, the first three of which may be considered highly politicized languages. Prior Attainment
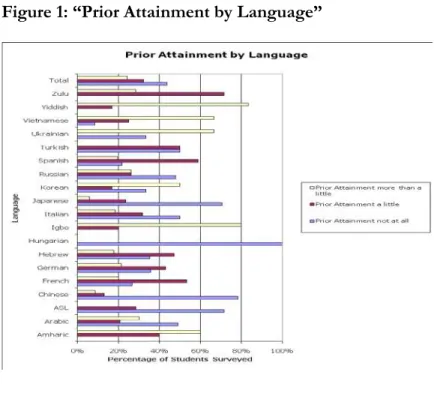
(Val-dés, 1995). We asked learners to report on their prior proficiency in the language being studied, focusing primarily on receptive skills (lis-tening and reading: see question 3, Appendix A).4 In a previous re-port of these data analyzed across languages, we (Reynolds et al 2009) found that narrow HLLs indeed reported higher levels of prior com-petence than broadly defined HLLs or non-HLLs. Comparing these data by language, learners differed in the amount of higher compe-tence reported. Figure 1 compared learners that reported understand-ing the language “not at all”, “a little”, and those that reported more than “a little” competence by indicating all other responses (Note: the category ‘other’ was frequently used to indicate combinations of skills that were not included in the survey choices, or productive skills such as speaking and writing).
Figure 1: “Prior Attainment by Language”
4 As noted in (Reynolds et al 2009), this question was flawed in that it only
des-ignated receptive language skills as options, omitting productive language skills.
In most of these first-year language courses, the majority of learners reported knowing the language only ‘a little’ or ‘not at all’ prior to enrolling, including Arabic, ASL, Mandarin Chinese, French, German, Hebrew, Hungarian, Italian, Japanese, Russian, Spanish, Turkish and Zulu. The other first-year language courses surveyed, however, enrolled a majority of students who understood the lan-guage more than a little prior to lanlan-guage study, including Amharic, Igbo, Korean, Ukrainian, Vietnamese and Yiddish. In fact, no learn-ers of Amharic, Igbo, Yiddish and Zulu reported undlearn-erstanding the language ‘not at all’ prior to enrolling. And certain languages had rela-tively high percentages of students reporting that they understood the language ‘a little’, including French, Hebrew, Spanish, Turkish, and Zulu. We explore how learners of different languages encounter dif-fering opportunities for contact with and exposure to the language and its users in the following section.
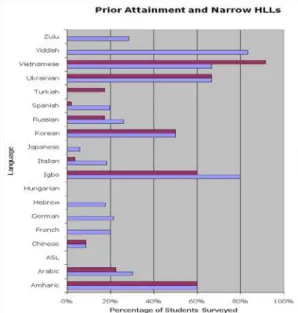
The percentage of learners reporting high prior competence did not always correspond neatly with the proportion of narrow HLLs enrolled in the language. Figure 2 compares the percentages of narrow HLLs in each language with the percentage of students re-porting more than “a little” prior attainment in the language.
Most notably this table shows that learners who did not hear the language regularly in their home (e.g., broad and non-HLLs) nonetheless sometimes perceived themselves to have gained a high level of prior competence by other means (Arabic, French, German, Hebrew, Igbo, Italian, Japanese, Russian, Spanish, Yiddish and Zulu): that is, non-heritage learners may bring previously unnoticed profi-ciencies to the classroom. On the other hand, learners who heard the language regularly in their home (narrow HLLs) do not always per-ceive that they have attained high proficiency in the language (e.g., Vietnamese: 91.7% narrow HLLs, but 65% reported high proficien-cy).
Previous Exposure
products, perhaps reflecting current worldwide interest in the popular cultural products from Korea and Japan, including movies, cartoons, comic books, and other commodities. As might be expected, the lan-guages most commonly studied in elementary or high school were French, German and Spanish.
Why do Learners Choose to Study these Languages?
We asked learners to indicate the reasons that they initially started studying the language (see Likert scale questions 2a-j in Ap-pendix A), and the reasons that they planned to continue studying the language (see questions 10a-e in Appendix A). As reported in previ-ous work (Reynolds et al 2009), the three learner types that we identi-fied differed in their reported initial reasons for studying these lan-guages. We found, for example, that non-HLLs more often reported career motivations than heritage language learners that broad/non HLLs more often reported research or study motivations than nar-row HLLs, and that heritage language learners more often reported literary/artistic motivations than non-HLLs. In this paper, we elabo-rate on the differences we found. Given that the context of language study includes differing language ideologies around the value and meaning of different languages, how these languages relate to learner identity, how they relate to our national history, and their role in the current sociopolitical context, we would expect learners to come to different languages for different reasons, and with different goals in mind.
to study the language and 5 indicated that the learner strongly agreed that it was a reason. Data found to differ significantly at p<.001 by a one-way ANOVA and post-hoc test are indicated by asterisks.
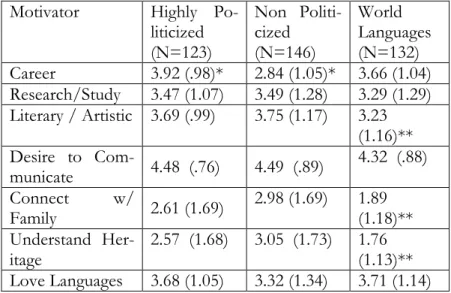
Table 3: Initial Motivation by Language Class
Motivator Highly
Po-liticized (N=123)
Non Politi-cized (N=146)
World Languages (N=132) Career 3.92 (.98)* 2.84 (1.05)* 3.66 (1.04) Research/Study 3.47 (1.07) 3.49 (1.28) 3.29 (1.29) Literary / Artistic 3.69 (.99) 3.75 (1.17) 3.23
(1.16)** Desire to
Com-municate 4.48 (.76) 4.49 (.89)
4.32 (.88)
Connect w/
Family 2.61 (1.69)
2.98 (1.69) 1.89 (1.18)** Understand
Her-itage
2.57 (1.68) 3.05 (1.73) 1.76 (1.13)** Love Languages 3.68 (1.05) 3.32 (1.34) 3.71 (1.14)
N indicates the number of learners surveyed for this category of languages. Numbers in parenthe-ses represent the Standard Deviation. Highlighted numbers differed significantly at p<.001 from one or both other languages. *Numbers differ significantly from each other in the same row; ** number differs significantly from the other two in the same row.5
Learners studying highly politicized languages (Arabic, Man-darin Chinese, Korean and Russian) reported significantly higher de-grees of career motivation than the learners of non-politicized lan-guages, which we surmise are more likely to draw students based on family or heritage considerations (African languages, Hebrew, Hun-garian/Turkish, Italian, Ukrainian, Vietnamese, Yiddish). Learners of the ‘world languages’ (French, German, Japanese, Spanish) reported significantly lower degrees of literary/ artistic, family, and heritage motivation than learners of the other two classes of languages.
5 An ANOVA with a Bonferroni correction was conducted to determine the
sta-tistical significance of these differences. The categories indicated by asterisks
were significantly different at p<.001, as one compares numbers across the row.
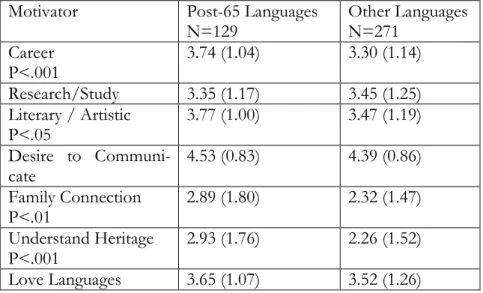
Post-65 immigrant languages versus other languages. Another pattern that emerged as we examined these data was the different types of motivation for the Post-65 immigrant languages versus other lan-guages - categories that were delineated above. Table 4 shows the mean initial motivation scores for students studying these two cate-gories of language. The means of the two groups were compared using an independent t-test. Where an independent T-test showed significant differences is indicated by p-values in the motivator column.
Table 4: Initial Study Motivators in Post-65 versus Other Lan-guages
Motivator Post-65 Languages
N=129
Other Languages N=271
Career P<.001
3.74 (1.04) 3.30 (1.14)
Research/Study 3.35 (1.17) 3.45 (1.25)
Literary / Artistic P<.05
3.77 (1.00) 3.47 (1.19)
Desire to Communi-cate
4.53 (0.83) 4.39 (0.86)
Family Connection P<.01
2.89 (1.80) 2.32 (1.47)
Understand Heritage P<.001
2.93 (1.76) 2.26 (1.52)
Love Languages 3.65 (1.07) 3.52 (1.26)
report-ed significantly higher literary/artistic reasons for enrolling in their language courses.
Differing motivations within learner types
In our previous report (Reynolds et al 2009) we noted some general trends in language study motivation among and between nar-row HLLs versus broad HLLs or non-heritage language learners. Within these learner types, however, a number of differences be-tween languages could be discerned. 6
Career: While narrow HLLs across languages reported lower degrees of career motivation than other learner types (Reynolds et al 2009), individual languages differed. The narrow HLLs who were studying certain ‘highly politicized’ languages reported much higher degrees of career motivation (Arabic 3.75, Mandarin Chinese 5.00, and Russian 4.25; N=18) than narrow HLLs studying other lan-guages. On the other hand, we did find relatively low mean responses that career was a motivator for heritage language learners of Hebrew (2.44), Vietnamese (3.0), and Yiddish (1.25).
Research/study abroad motivation: Breaking down the research and study abroad motivation to examine learner types reveals a more nuanced picture than is clear above. French learners, for example, actually reported exceptionally high research /study abroad motiva-tion compared to learners of other languages, with 100% of broad HLLs and 75% of non-HLLs agreeing or strongly agreeing with the statement about desire to conduct research in the language, or to study abroad. Non-HLLs of Italian also reported a high interest in study abroad. Certain groups reported exceptionally low research /study abroad reasons for choosing their language courses, including: non-HLLs of Korean (N=9; only 20% reported this as a motivator); HLLs of Vietnamese (N=12; only about 10% agreed with the state-ment); narrow HLLs of African languages (n=6; 0%) and all learners of Yiddish (N=6; 0%), none of whom agreed with the statement.
Literary/ artistic motivation: We noted that literary and artistic motivation was especially high for heritage language learners of Ara-bic (75% of narrow HLLs agreed that this was a reason, while 80% of
6 There is not adequate space to report fully on each individual language.
Con-tact the authors for language reports for each individual language.
broad HLLs agreed), and Yiddish (100% of broad HLLs agreed), as well as non-HLLs of Japanese (80% agreed). This type of motivation was, on the other hand, especially low among broad HLLs of Spanish (only 18% agreed).
Desire to communicate: The vast majority of learners indicated a strong desire to communicate with speakers of the language. Narrow HLLs of Mandarin Chinese strayed slightly from this pattern, with only 50% indicating they agreed that this was a reason to study the language. These learners may have high levels of oral proficiency in Mandarin Chinese but low literacy, in which case their primary moti-vation may be to acquire literacy rather than to verbally communi-cate. Connect with my family: One may think of a heritage lan-guage as being used primarily to connect with one’s family. For heritage learners of some of these languages, however, connecting with their family was not a strong reason for studying the language. To our surprise, none of the narrow HLLs of Mandarin Chinese, and only 30% of the broad HLLs of Hebrew agreed with this statement.
To understand my heritage: The results were fairly consistent across languages when learners were asked whether they wanted to understand their heritage by studying the language. Non-HLLs, of course, did not indicate that this was so, while heritage learners gen-erally indicated that this was an important motivation. 100% of broad HLLs of Hebrew, most of who had indicated that family connection was not a motivator, reported that they wanted to connect with their heritage.
Love language learning in general: In our previously published cross-language analysis (Reynolds et al 2009) we found that non HLLs (58.6%) study languages for the love of language learning much more than do HLLs (narrow=38.2%; broad= 48.6%). Manda-rin Chinese heritage language learners, though, were much less likely to agree than were their counterparts (0% of narrow HLLs; and less than 20% of broad HLLs). All of the broadly defined HLLs of Rus-sian, on the other hand, reported this as a reason to study the lan-guage. 100% of broad/non HLLs of the African languages indicated that their love of language learning motivated them to study the lan-guage.
learners of Mandarin Chinese indicated that this was so.
Desired and Expected Attainment
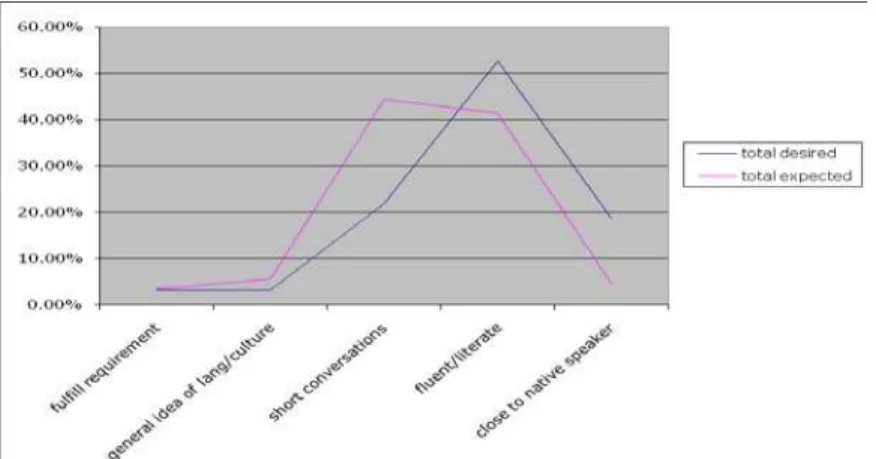
We asked learners to indicate their levels of desired and ex-pected attainment of proficiency in the language (see Survey Ques-tions 10 and 11 in Appendix A). Across languages, learners indicated generally higher desired attainment in the language than what they expected to achieve. This is shown in Figure 3.
Figure 3: Desired versus Expected Attainment
This pattern of higher desired attainment than expected at-tainment was repeated in almost all of the individual language courses that we surveyed. We present the raw percentages here to illustrate this trend and to identify the cases that differed from this trend.
that they only desired to attain a general idea of the language and cul-ture. The desire to become fluent or literate was the most common response across languages, but responses differed a great deal be-tween individual languages. For example, Japanese learners were more likely to indicate that they desired to engage in short conversa-tions (47.1%) than to become fluent/literate (35.3%).
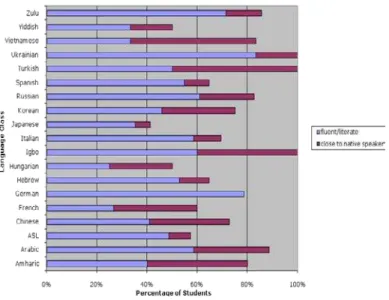
Students who wish to become fluent or to obtain close to na-tive speaker proficiency have high aspirations for mastery of the lan-guage, whereas those wishing to engage in short conversations or less hope only for minimal proficiency in the language. It is interesting, then, to compare across language the percentage of learners who de-sired mastery, and those that expected mastery. Figure 4 presents the percentage of students who indicated these high desired levels of at-tainment in the language.
Figure 4: High Desired Attainment by Language
broadly from 0% of learners of German to 50% of learners of Turk-ish and Vietnamese.
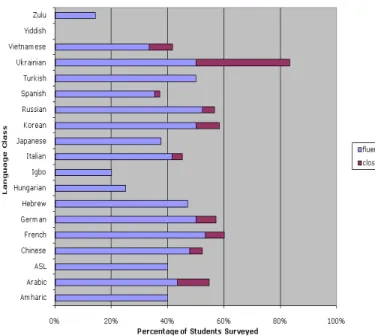
The levels of attainment that students expected to achieve, on the other hand, differed from their desired levels of attainment, and varied greatly by language. Figure 5 shows the percentages of stu-dents indicating high levels of expected attainment.
Figure 5: High Expected Attainment by Language
Of special note here is that students’ expected levels of at-tainment were dramatically lower than their desired levels of attain-ment, across the board. In particular, few students expected to attain native speaker-like language proficiency, and many who desire to be fluent do not expect to achieve it.
Discussion
indi-vidual learners interpret their meaning and relevance to their educa-tional trajectories in both typical and idiosyncratic ways. A survey such as this provides a window into some general trends regarding the impact of these contexts on the learners who decide to study par-ticular languages at the university and why. Our analysis was designed to tease out differences between languages and broader categories of languages that may complicate binary rubrics used in the study of language learners in post-secondary language classrooms, such as her-itage versus non-herher-itage language learners, and commonly taught versus less commonly taught languages.
While the distinction among CTLs, LCTLs and TLCTLs was indeed predictive of the proportion and number of HLLs in language classes, a closer look at these categories provided a more nuanced picture: the courses in TLCTLs related to groups that were able to immigrate in larger numbers after the 1965 Hart-Cellar Act (Post-65 languages) included more narrow HLLs, while TLCTLs not related to this trend included more broadly defined HLLs. This history makes it likely that second generation immigrant children from those groups are now entering higher education. Programs offering courses in Post-65 TLCTLs- languages that typically struggle with low enroll-ments- might benefit from marketing their classes among organiza-tions representing immigrants from those regions. Furthermore, there were unexpectedly high numbers of heritage language learners in CTLs and LCTLs such as Mandarin Chinese, Russian and Arabic, all of which are not only widely spoken world languages but also at-tract the children of immigrants from regions where these languages are dominant.
broader avenues of exposure and use of languages, and hence profi-ciencies, than teachers normally take into account. Indeed, we found that some broad and non-HLLs across a number of languages (both immigrant and world languages) sometimes perceived themselves to have gained a high level proficiency even though the language was not spoken at home. Conversely, narrowly defined HLLs did not al-ways report high levels of prior attainment. Language contact surveys at the beginning of language courses might assist teachers in identify-ing and buildidentify-ing upon the language proficiencies that students bridentify-ing to their courses.7
There are likely a range of factors related to language contact, language use within immigrant communities and demographics un-derlying the perception that one understands a language ‘a little’ or ‘more than a little’. Some languages, for example, have contributed highly visible lexical borrowings to American English (such as Ger-man, Italian, Spanish and Yiddish), others are important languages of global religious use (such as Arabic and Hebrew). Spanish and Kore-an are the lKore-anguages of significKore-ant immigrKore-ant groups, Kore-and they are the language of alternative mass media forms available in the US. In the case of Arabic, many students reported some competence in Arabic literacy. The fact that high percentages of Turkish and Zulu learners were broad HLLs may explain why high percentages of them report-ed understanding the language ‘a little’. Broad HLLs of more recent immigrant languages may indeed differ from those of pre-65 immi-grant groups. Ideally, language teachers should be building on the nature and range of communicative resources and hidden proficien-cies that their learners bring to the classroom, whether they have her-itage associations with the language or not (and teachers should keep heterogeneity and inequality of skill in mind). Students may have
7 One anonymous reviewer suggested, quite aptly, that language teachers could
prepare instructional units that address these varying proficiencies and language
needs, or even to offer specialized units online or for self-directed language
study.
picked up particular styles of speaking and multiple literacies not only from their families, but also from the mass-mediated texts, religious contexts, peer groups, community or business contexts. The avenues of exposure to language may also provide the motivation that propels students into language study, so understanding students’ reasons for studying the language may be related to understanding their prior ex-periences and their aspirations. Likewise, HLL students taking lan-guages related to Post-1965 immigration patterns notably have both integrative and instrumental motivations for language learning, some-thing that could be used to market and design courses more effective-ly.
be that HLLs of languages with Romanized alphabets were able to enter higher levels of language study given their oral proficiency in the language and English literacy, and were therefore absent from our survey sample.
Other aspects of student reasons for studying the languages may come as a surprise, too. For example, learners of widely spoken, global languages (French, German, Spanish) reported significantly lower degrees of interest in literary or artistic pursuits as a reason to study the language (see also Murphy, this volume, for a comparison of motivation to learn across global languages and LCTLs). This may, in fact, be closely related to their status as commonly taught lan-guages given that such lanlan-guages are accessible to a wide range of students who may simply be going through the motions of learning a language without broader aspirations for discovering the perspectives of its speakers. Literary and artistic reasons for language study were, on the other hand, high among learners of post-65 immigrant lan-guages as well as Yiddish and Japanese. Such lanlan-guages are likely to draw students who have broader interests in the language, its speak-ers, and its cultural inheritance. Understanding why all of the broadly defined Russian heritage language learners, and most learners of Afri-can languages reported that love of language learning was a motivat-ing factor for their language study would likely require more in-depth qualitative research amongst those individuals. Having a high per-centage of students who love language learning should encourage teachers of those languages to let their inner-language geek flourish. At the same time, language teachers need to be especially careful to honor the wide variety of rich (yet often non-standard) language re-sources that students bring to class, while providing an environment in which learners become increasingly aware of the sociolinguistic variation present in any language, and more adept at flexibly deploy-ing a growdeploy-ing ldeploy-inguistic repertoire to inhabit their social worlds, to express their identities, and to realize their aspirations.
they have utilized or confirmed this perceived competence. Qualita-tive research could explore in more depth students aspirations for language study, as well as their experiences as language learners in these courses. Some questions for future surveys would include ex-amining how fields of study might be associated with different types of motivation for language study, how different imagined career tra-jectories might lead to the study of particular languages, and how both field of study and motivation might mutually influence the choice of language studied.
Conclusion
From this information, we gather that immigration trends, and the frequency with which particular languages are offered by formal educational institutions (commonly or rarely taught languages) are associated with different populations of students in terms of their heritage associations with the language. The picture was less tidy than one might expect, however, leading us to suggest that the sociopoliti-cal, historisociopoliti-cal, and ideological contexts of language study may play important roles as well. Some factors may include: whether or not the language is written in a Western script, whether the geographical re-gion in which an institution is located has historically received mi-grant families from that language community (e.g., learners of Span-ish and Japanese at these universities have low heritage associations, while in other regions these languages have high numbers of heritage language learners), and the communities’ differing perceptions, atti-tudes and uses of their language (e.g., why were there so few heritage learners of Mandarin Chinese? why so many of Russian?)
expe-riences with ways of speaking and writing in different situations, as well as their aspirations for language study.
References
Beaudrie, S., & Ducar, C. (2005). Beginning level university heritage programs: Creating a space for all heritage language learners.
Heritage Language Journal, 3(1). DOI: http://128.97.165.17/ media/files/beaudrie_and_ducar.pdf
Cho, G. (2000). The role of heritage language in social interactions and relationships: Reflections from a language minority group. Bilingual Research Journal, 24(4), 333-348.
Crawford, J. (1989). Bilingual education: History, politics, theory, and practice. Trenton, NJ: Crane.
Dornyei, Zoltan. (1994). Motivation and Motivating in the Foreign Language Classroom. Modern Language Journal, 78(2), 273-284. Gambhir, S. (2001). Truly less commonly taught languages and herit-age languherit-age learners in the United States. In Heritage languages in America: Preserving a national resource (pp. 207-229). McHenry, IL: Center for Applied Linguistics and Delta Systems.
Gee, J. P. (1990). Social linguistics and literacies: Ideology in discourses. Lon-don and New York: Falmer Press.
Hornberger, N. H., & Wang, S. C. (2007). Who are our heritage lan-guage learners? Identity and biliteracy in heritage lanlan-guage education in the United States. In D. Brinton, O. Kagan & S. Bauckus (Eds.), Heritage Language: A New Field Emerging (pp. 3-37). Mahwah, NJ: Lawrence Erlbaum.
Howard, K. M. (2008). Language socialization and language shift among school-aged children. In P. Duff & N. Hornberger (Eds.), Encyclopedia of language and education, second revised edition: Volume 8: Language socialization (pp. 187-199). New York: Kluwer Academic Publishers.
Kondo, K. (1997). Social-psychological factors affecting language maintenance: Interviews with Shin Nisei university students.
Linguistics and Education, 9, 369-408.
de-velopment: Focus on East Asian immigrants (pp. 243-258). Am-sterdam/ Philadelphia: John Benjamins Publishing Company. Kramsch, C. (2005). Post 9/11: Foreign languages between
knowledge and power. Applied Linguistics, 26(4), 545-567. Kumaravadivelu, B. (2008). Cultural globalization and language education.
New Haven/ London: Yale University Press.
Luo, S. H., & Wiseman, R. L. (2000). Ethnic language maintenance among Chinese immigrant children in the United States. Inter-national Journal of Intercultural Relations, 24, 307-324.
Murphy, D. Sieloff Magnan, S. Back, M. & Garrett-Rucks, P.,(2010). Reasons Students Take Courses in Less Commonlt Taught and More Commonly Taught Languages. Journal of the National Council of Less Commonly Taught Languages, 7, 45-80.
Pavlenko, A. (2003). ‘Language of the enemy’: Foreign language edu-cation and national identity. International Journal of Bilingual Ed-ucation and Bilingualism, 6(5), 313-331.
Portes, A., & Rumbaut, R. G. (2006). Immigrant America: A Portrait. Berkeley: University of California Press.
Portes, A., & Zhou, M. (1993). The new second generation: Seg-mented assimilation and its variants. Annals of the American Academy of Political and Social Science, 530, 74-96.
Reynolds, R. R., Howard, K. M., & Deák, Julia. Heritage Language Learners in First-Year Foreign Language Courses: A Report of General Data across Learner Subtypes. Foreign Language Annals. Summer 2009, 42(2): 250-269. DOI: 10.1111/j.1944-9720.2009.01020.x
Valdés, G. (1995). The teaching of minority languages as academic subjects: Pedagogical and theoretical challenges. The Modern Language Journal, 79, 299-328.
Valdés, G. (2006). The foreign language teaching profession and the challenges of developing language resources. In G. Valdés, J. Fishman, R. Chavez & P. W. (Eds.), Developing minority language resources: The case of Spanish in California (pp. 108-139). Cleve-don/Buffalo/Toronto: Multilingual Matters.
Valdés, G., González, S. V., García, D. L., & Márquez, P. (2008). Heritage languages and ideologies of language: Unexamined challenges. In D. Brinton, O. Kagan & S. Bauckas (Eds.),
Appendix A
Language Learners Survey Spring 2006
The following short survey is designed to learn who takes languages at this univer-sity, which languages they take, and why.
1. What language class are you currently taking this survey in? _____________________________________________
2. This question explores why you ORIGINALLY decided to take this language. Think about how you made that decision as you were planning your degree goals and registering for courses. For each statement below, circle the number that best represents your feelings about why you initially began studying this language.
(1 for Strongly Disagree, 2 for Disagree, 3 for Neutral, 4 for Agree or 5 for Strong-ly Agree)
a. I thought learning about this language would help in my career. 1 2 3 4 5
b. I thought this course would prepare me for study abroad or other res earch. 1 2 3 4 5
c. I had great interest in literature, art, music, etc. in this language. 1 2 3 4 5
d. I wanted to communicate with speakers of this language. 1 2 3 4 5
e. I wanted to use this language to connect with my family. 1 2 3 4 5
f. I wanted to understand my heritage. 1 2 3 4 5
g. The time it was offered fit my schedule. 1 2 3 4 5
h. I could continue to build language skills from high school classes. 1 2 3 4 5
i. I loved to learn languages in general. 1 2 3 4 5
3. Before starting classes in this language, I was able to understand this language… (Circle only one).
a. not at all.
b. a little.
c. as a listener (but I cannot speak it ).
d. as a reader (but I cannot speak it or write it). e. as a listener and a reader (but I cannot speak it).
f. other (please specify): ______________________________________
4. How did you find out about classes in this language at Drexel? (Circle as many as you wish).
a. website(s)
b. student advisor(s)
c. other students
d. professors
e. browsing through BannerWeb
f. other (please specify): _______________________________________
5. What other experiences do you have or have you had with this language outside of the classroom? (Circle as many as you wish).
a. I heard it at home.
b. I heard it in my neighborhood.
c. I heard it at religious or cultural events in the community. d. I hang out with people who speak this language.
e. I studied it in elementary, junior high or high school.
f. I’m familiar with it from movies, music, literature, art or philosophy.
g. I had no previous exposure.
h. Other (please specify): ____________________________________
6. As you were growing up, was a language other than English spoken regularly in your home?
a. No If you answered no to this question, please go to item number #9. b. Yes If you answered yes to this question, please go to item number #7.
7. Which language or languages other than English were spoken in your home? Please list them. _____________________________________________
8. To answer this question, think about the language besides English that was most frequently spoken in your home. Please indicate who in your home spoke that language as you were growing up. (You may circle more than one).
a. mother
b. father
c. brothers and sisters
d. any grandparent
e. other relatives
f. friends, caretakers, people from the neighborhood
9. What is the most important reason or reasons that you will continue to study the language you are taking in this course. (Circle all that apply).
a. It will help in my career.
b. It prepares me for study abroad or other research.
c. I love the literature, art, music or philosophy of the people who speak this language.
d. I want to communicate with speakers of this language. e. It helps me connect with my family.
f. It helps me understand my heritage. g. I have to fulfill a university requirement. h. Love of learning languages in general. i. It’s easy to learn.
j. Other (please specify): ______________________________________
k. I do not plan to continue on in the study of this language.
10. What level of proficiency do you wish to attain ultimately in this language? (Circle only one).
a. I just want a general idea of how the language and/or culture works. b. I want to be able to have short conversations (perhaps limited to a
specif-ic topspecif-ic) with native speakers of this language. c. I want to be fluent and/or literate in this language. d. I want to be as close to native-speaker ability as possible. e. I just want to fulfill the foreign language requirement.
11. What level of proficiency do you expectto attain in this language by complet-ing the sequence of classes offered at Drexel?
a. I expect to gain a general idea of how the language and/or culture works. b. I expect to be able to have short conversations (perhaps limited to a
spe-cific topic) with native speakers of this language.
c. I expect to become fluent and/or literate in this language. d. I expect to become as or almost as proficient as a native-speaker. e. I just want to fulfill the foreign language requirement.
12. In what field do you plan to pursue a career?
a. Science or Engineering
b. Business
c. Medical/Public Health
d. Humanities, Communication or Social Sciences
e. Don’t know
f. Other (Please specify): ______________________________________
13. What aspects of language study would you like covered more in this course? a. Cultural information and experiences
b. Slang/informal speech
c. Reading and writing practice
d. Academic/formal speech and writing
f. Other (Please specify): ______________________________________
14. Would you have taken courses in this language before college (in high school, junior high or Saturday and evening classes) if they had been offered?
a. Yes
b. No
c. Yes, but in another language (Please specify: ___________________)
15. What other language or languages would you like to study? Please list them. ________________________________________________________________
16. What do your parents think about the usefulness of language study in college?
a. I don’t know.
b. They think it’s important for my career.
c. They think it’s important for my intellectual growth. d. They think it’s important for my cultural growth.
e. Other (Please specify): ______________________________________
f. They don’t think it’s important.
17. Where were you born? Please write city, state or county or province, and country.
City or Town: __________________________________
State or Province: _____________________________
Country: ___________________________
18. Please indicate your educational level. a. Freshman/First year student
b. Sophomore
c. Junior or Pre-junior
d. Senior
e. Graduate Student
APPENDIX B
Learner Fields of Study by Language
L an gu ag e Bu si n ess Don ’t K no w Gov ./ M ili ta ry L aw M ed ./ H ea lt h A rt s, H um an it ie s, So cia l Sc i. Sc ie n ce & En gi n ee ri n g
Amharic (N=5) 20.0% 40.0% 20.0% 20.0%
Arabic (N=53) 28.3% 11.3% 7.5% 5.7% 11.3% 22.6% 13.2%
ASL (N=35) 17.1% 14.3% 20.0% 28.6% 20.0%
Chinese (N=23) 69.6% 4.3% 21.7%
French (N=15) 26.7% 6.7% 13.3% 26.7% 26.7%
German (N=14) 42.9% 21.4% 35.7%
Hebrew (N=17) 17.6% 5.9% 5.9% 23.5% 41.2% 5.9%
Hungarian (N=4) 25.0% 50.0%
Igbo (N=5) 60.0% 40.0%
Italian (N=82) 22.0% 9.8% 1.2% 3.7% 11.0% 39.0% 13.4%
Korean (N=24) 29.2% 4.2% 8.3% 4.2% 25.0% 20.8% 8.3%
Russian (N=23) 26.1% 8.7% 8.7% 8.7% 17.4% 30.4%
Spanish (N=51) 52.9% 3.9% 7.8% 31.4% 3.9%
Turkish (N=2) 50.0% 50.0%
Ukrainian (N=6) 50.0% 16.7% 33.3%
Vietnamese (N=12) 25.0% 16.7% 16.7% 33.3% 8.3%
Yiddish (N=6) 16.7% 16.7% 16.7% 50.0%
Zulu (N=7) 57.1% 42.9%
Total % 30.9% 7.5% 2.2% 3.5% 12.2% 27.9% 15.2%
no p re v ar t / lit sc ho ol ha ng w/ spe ak er s re lig io u s/ cu lt u ra l e ve n ts ne ig h bor -ho od hom e Amharic 0
0% 0 0%
1 20% 0 0% 3 60% 1 20% 0 0% 3 60%
Arabic 5
9% 18 34% 8 15% 1 2% 13 25% 18 34% 7 13% 12 23%
ASL 8
23% 18 51% 3 9% 3 9% 2 6% 3 9% 2 6% 1 3%
Chinese 2
9% 4 17% 11 48% 0 0% 7 30% 3 13% 4 17% 3 13%
French 5
33% 2 13% 6 40% 8 53% 3 20% 0 0% 0 0% 0 0%
German 4
29% 4 29% 2 14% 6 43% 3 21% 0 0% 0 0% 2 14%
Hebrew 2
12% 1 6% 2 12% 5 29% 6 35% 15 88% 1 6% 2 12% Hungarian 3
75% 1 25% 0 0% 0 0% 1 25% 0 0% 0 0% 1 25%
Igbo 0
0% 0 0% 0 0% 0 0% 3 60% 2 40% 1 20% 5 100%
Italian 22
27% 19 23% 31 38% 7 9% 11 13% 1 1% 7 9% 17 21%
Japanese 1
6% 4 24% 10 59% 1 6% 2 12% 0 0% 1 6% 0 0%
Korean 2
8% 1 4% 11 46% 3 13% 14 58% 12 50% 5 21% 15 63%
Russian 4
17% 4 17% 7 30% 6 26% 10 43% 2 9% 4 17% 4 17%
Spanish 9
18% 6 12% 15 29% 29 57% 10 20% 2 4% 8 16% 4 8%
Turkish 0
0% 0 0% 0 0% 0 0% 2 100% 1 50% 0 0% 2 100% Ukrainian 1
Vietnamese 1 8%
0 0%
6 50%
1 8%
10 83%
9 75%
4 33%
11 92%
Yiddish 1
17% 0 0%
0 0%
0 0%
0 0%
2 33%
1 17%
4 67%
Zulu 0
0% 3 43%
1 14%
0 0%
2 29%
1 14%
0 0%
0 0%
Total 70 85 117 74 108 76 47 90