Surface-enhanced raman Scattering: metal nanoStructureS coated with
langmuir-Blodgett filmS
1
Priscila alessio,
1carlos J. l. constantino,
2 ∆ricardo F. aroca,
2*osvaldo n. oliveira Jr.
1Faculdade de ciências e tecnologia, UnesP Univ estadual Paulista, Presidente Prudente, 19060-080, sP, Brazil. 2instituto de Física de são carlos, UsP Universidade de são Paulo, são carlos, sP, 13560-970, Brazil.
on leave from the department of chem. and biochem, university of windsor, windsor, ontario, canada.
(Received: August 30, 2010 - Accepted: November 16, 2010) aBStract
This review deals with surface-enhancved Raman scattering (SERS) employing Langmuir-Blodgett (LB) ilms, which serve as model systems for developing theoretical and experimental studies to elucidate the SERS effect. In addition, LB ilms have be used as integral parts of molecular architectures for SERS-active substrates. On the other hand, SERS and surface-enhaced resonant Raman scattering (SERRS) have allowed various properties of LB ilms to be investigated, especially those associated with molecular-level interactions. In the paper, emphasis is placed on single molecule detection (SMD), where the target molecule is diluted on an LB matrix of spectral silent material (low Raman cross section). The perspectives and challenges for combining SERS and LB ilms are also discussed.
Keywords: Surface-enhanced Raman scattering, plasmonics, Langmuir-Blodgett ilms, nanoparticles.
1. introduction
Metal nanoparticles1-3 have been extensively investigated due to their
catalytic4, biological5 and sensing6 properties, quite different from those in the
bulk7. In particular, Ag and Au nanostructures can sustain localized surface
plasmon resonances (LSPR) in the visible range of the electromagnetic spectrum providing the basis for plasmon-enhanced spectroscopy that started with surface-enhanced Raman scattering (SERS)8, 9. The local ield enhancement
is most eficient for the enhancement of the optical signals in aggregated nanoparticles (or similar structures) that can increase the spontaneous Raman scattering cross sections (of the order of 10-29 cm2 per molecule)10 by several
orders of magnitude. An enhanced Raman signal was irst reported in 1974 by Fleischmann et al.11 with pyridine on rough Ag electrodes, an effect that was
interpreted in 1977 as being due to a new physical phenomenon (SERS) by Jeanmaire and Van Duyne9 and Albrecht and Creighton8 in independent studies.
The SERS effect is assigned to the enhancement of the optical signal when the incoming light can enable LSPR of the metal nanoparticles12, 13. Basically,
the electromagnetic enhancement mechanism (EM), at a given excitation frequency, depends on the dielectric function of the metal nanoparticles (mainly Ag and Au), their shape, size and packing in the nanostructures14, 15.
It is also affected by the dielectric constant of the surrounding medium that wraps the metal nanoparticles. The intimate relationship between the plasmon excitation and the optical enhancement led to the development of plasmonics16.
In many cases, the spectral properties of the species adsorbed onto the metal nanoparticles may change on account of the “chemical or physical” interactions with the nanostructure, and, correspondingly, the electromagnetically enhanced SERS spectrum will contain the information that shed light on these molecule-nanostructure interactions17, 18.
The average SERS enhancement factor normally lies between 103 and 106,
but the intense electromagnetic ield in the interstices of the metal nanoparticles (“hot spots”) can lead to a factor of up to 1010 10, 19. Upon exploiting such hot
spots and the high sensitivity of modern Raman spectrometers, it is possible to achieve single molecule detection (SMD) using SERS or surface-enhanced resonance Raman scattering (SERRS), which is the ultimate limit in terms of chemical analysis20-23. Since the highest enhancement factors are obtained
with aggregates or clusters of nanoparticles (where hot spots are generated), there is a hefty number studies on the relationship of packing, size and shape of nanoparticles and the SERS signal19, 24-28. The reproducible fabrication of
nanostructures with maximum enhancement factor, as required for SMD, remains a challenge though. Different strategies have been developed to produce average enhancement factor (up to 107), or higher, in SERS-active
substrates, which involve traditional methods such as colloids29, large
aggregated nanoparticles30, 31, thermally evaporated thin ilms32, oblique
angle vapor deposition33 and electrodeposition34, self-assembly of AuNPs
with different diameters in an array35, dendrimer/Ag nanowire layer-by-layer
(LbL) ilms36, AgNP ilm formed by in-situ reaction37 or cast in a bottom-up
strategy onto treated glass slides38, AuNPs distributed along nanocanals39,
polymer-encapsulated AuNPs by self-assembly40 and gap-tailorable Au-Ag
core-shell nanodumbbells41. Recently, we reported on LbL ilms containing
AgNPs trapped within a phospholipid matrix42 to achieve SERS and SERRS,
which can be used in investigating interactions between guest molecules and phospholipids in membrane mimetic systems. There have also been reviews on the various methods to prepare Ag or Au SERS substrates for analytical applications, as in Lin et al.43. Two possibilities for obtaining SERS-substrates
are illustrated in Figures 1 and 2.
figure 1: SEM images of a monolayer of nanocrystal and nanowires prepared with the Langmuir-Blodgett technique: a) Pt nanospheres, b) Ag nanocubes, c) Ag nanowires, d) Ag octahedral nanoparticles. reproduced with permission from: X.-M. Lin, Y. Cui, Y.-H. Xu, B. Ren, Z.-Q. Tian. analytical and Bioanalytical chemistry 394, 1729-1745 (2009).
figure 2: Schematic diagram of template methods using nanosphere lithography to fabricate ordered nanostructured SERS-active substrate.
Since the optical enhancement in SERS is plasmon driven, it can be applied to all molecular systems, i.e. SERS is not molecule speciic. This is conirmed in the compilation of molecules displaying SERS signal44 and the
database available in www.spectroscopynow.com. Notably, the plasmonic enhancement has been conirmed even for molecules with very low scattering cross section such as water and alkanes. However, the challenge of producing reliable, reproducible SERS substrates with an expected enhancement factor remains for the nanostructure fabrication; that would allow one to routinely apply the capabilities of SERS as an analytical tool45.
Here, we focus the discussion on the SERS/SERRS results obtained for controlled molecular coating of the enhancing nanostructure using the Langmuir-Blodgett (LB) technique46, 47 for molecules that can form LB
ilms or mixed LB ilms (LB-SERS). It is, therefore, possible to monitor the surface coverage of the metal using well deined monolayers, allowing to compare SERS substrates and to estimate the enhancement factor for the target molecule. This review paper is organized as follows. The irst sections present a discussion of the enhanced SERS and SERRS spectra. Then, the advantages and limitations of the SERS/SERRS work with LB ilms are given.
2. SerS/SerrS or plasmon enhanced inelastic scattering
The molecular vibrational ingerprints for characterization are obtained from two complementary techniques: infrared absorption spectroscopy and Raman (inelastic) scattering. Both the infrared absorption and the inelastic scattering can be enhanced using plasmonic. “an inelastic scattering process produces secondary light quanta with different energy. one such process is the raman effect. during the interaction of the primary light quantum with a molecule or crystal, the energy of vibrational and/or rotational states may be exchanged and a secondary light quantum of lower or higher energy is emitted. the energy difference is equal to the vibrational energy evib of a molecule or crystal and/or the rotational energy erot of a molecule. it may be recorded, if monochromatic radiation is used for the primary excitation, as a vibrational, rotational or rotationvibration raman spectrum.” (IUPAC 1997).
The induced dipole produced by the monochromatic electromagnetic radiation (a laser line) used in a Raman experiment is: p=
α
e [1], where a is the molecular polarizability (tensorial and vector notations are omitted for the sake of simpliication). The molecular polarizability tensor component is a function of the vibrational motions within the molecule (time dependence), andα
can be expanded in a Taylor’s series near the equilibrium48. For eachvibrational coordinate 0
(
)
cos
k k k
Q =Q
ω
t [2], we can write:the different boundary conditions that apply to the Maxwell equations give rise to a geometrically determined behavior. The ields induced at the surface, particularly at excitation in or close to the resonance of these LSPR, are responsible for the enhancement in SERS51, 52. As already mentioned, this
enhancement depends essentially on the dielectric function of the metal at the excitation frequency, the dielectric constant of the medium that involves the surface and the shape, size and packing of the metal particles15, 53. The control
of these parameters is intimately related to the success or failure of producing reproducible SERS substrates.
Experimentally, a necessary condition to achieve SERS is the excitation of LSPR. For laser lines within the visible range of the electromagnetic spectrum, the noble metals Au, Ag and Cu are the most eficient. The plasmon absorption of a 6 nm Ag evaporated ilm is shown in Figure 3, where the most commonly used laser lines at 514.5; 632.8 and 785 nm are also marked.
[3]
where the irst term
α
0will give rise to the elastic Rayleigh scattering, and the irst derivatives in the second term are related to the fundamental Raman vibrational frequencies. The third term corresponds to overtones followed by combinations (not shown). When the expression of polarizability is combined withp
=
α
e
, the terms for the Rayleigh and the fundamental vibrational frequencies are obtained:figure 3: On the left a scanning electron microscopy image of a 6 nm Ag evaporated ilm is shown, while at the right the ultraviolet-visible absorption spectrum is shown. The arrays indicate some common laser lines used in the visible range to achieve the SERS effect.
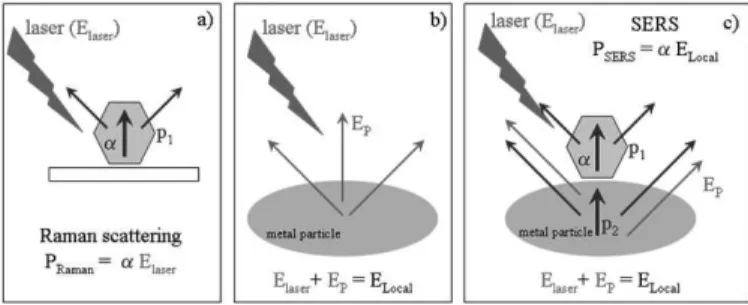
The interaction among the incoming laser, metal nanoparticles and adsorbed molecule and their relation with spontaneous Raman scattering and SERS are presented as simpliied illustrations in Figure 4. Basically, the combination of the electric ield from the laser light (Elaser – Figure 4a) and the
electric ield from the metal nanoparticle (Ep – Figure 4b) comprises ELocal at
the surrounding of the metal particles. These two components of ELocal affect
directly the magnitude of the induced dipole moment of the molecule (p1) that is adsorbed at the metal particle surface (Figure 4c). In other words, the molecule is polarized by ELocal when it is placed on the metal surface and, as a result, the dipole (p1) is induced. The electric ield radiated by this induced
molecular dipole (p1) can also polarize the metal, inducing a dipole in the metal nanoparticle (p2) that oscillates with the same frequency of the induced
molecular dipole (p1).
figure 4: Illustrations showing (a) the dipole moment of the molecule (p1) induced by the incoming laser line in the spontaneous Raman scattering; (b) ELocal at the surrounding of the metal particles composed by the electric ields from the metal nanoparticle (Ep) and from the incoming laser (ELaser); (c) SERS
effect - the molecule placed at the metal surface is polarized by ELocal inducing the molecular dipole (p1) whose radiated electric ield can also polarize the
metal, inducing a dipole in the metal nanoparticle (p2) that oscillates with the same frequency of p1.
A simple model, assuming a spherical metal particle as in Figure 5, is useful to understand this process. For a radius (r) smaller than the wavelength of the incoming radiation (l), the electric ield can be considered uniform through the particle and the surface plasma as an oscillating dipole (pmetal). So, the Rayleigh electrostatic approximation (magnetic effects are neglected) is satisied. In [4]
where p is the oscillating Hertzian dipole. Therefore, the incoming radiation is scattered by the molecule with a slightly different energy and two sets of bands are observed on either side of the elastic scattering band (Rayleigh scattering): Stokes bands of lower energy and anti-Stokes bands of higher energy. When the exciting radiation is in resonance with the electronic absorption of the molecule, i.e. the laser light may also be absorbed by the molecule, then the inelastic scattering is termed resonance Raman scattering (RRS). RRS has a much larger cross section than the spontaneous Raman scattering effect48, 49.
The SERS signal is due to the enhancement in the near ield at the surface of the metal nanoparticles under plasmon excitation, leading to an enhancement factor proportional to E4 50. The intensiication of the electric ield on the
[7] this case the intensity of pmetal is given by relation [5] where emetal, which is
a function of the frequency (w), corresponds to the metal dielectric function, emedium is the dielectric constant of the environment that surrounds the metal
surface, and Elaser is the electric ield of the incoming radiation that oscillates with a frequency wlaser. The dipole pmetal is then maximum for a frequency w =
wlaser in the resonance condition, which means Re (emetal = - 2 emedium) [6].
3. SerS and SerrS from nanostructures coated with
langmuir-Blodgett ilms
Langmuir ilms47 are formed by spreading a small number of molecules
in volatile solutions onto the water subphase in a Langmuir trough. After the evaporation of the solvent, the loating molecules are compressed by barriers forming a monolayer at the air/water interface, i.e. the Langmuir ilm, as shown in Figure 7a. This process is controlled by measuring the surface pressure vs
mean molecular area isotherms (p-A isotherms). Basically, the surface pressure (p) is given by the difference between the surface tension of the water subphase in the absence of the monolayer (g0) and the surface tension of the water
subphase with the monolayer (g), i.e.:
figure 5: Illustration of the model considering a spherical metal particle, with the local electric ield (ELocal) established at the environment of the metal
particle in the SERS effect.
In addition, the dipole p2 induced in the metal particle oscillating with the
same frequency of the induced molecular dipole p1 is also maximized because this vibration frequency, which corresponds to the Raman scattering (wRaman),
is close to the laser frequency, i.e. wlaser ~ wRaman, in a way that the resonance condition (relation [6]) is also obeyed. This p2 is the origin of the main
contribution to the Raman signal ampliication. In the case of spontaneous Raman scattering only p1 contributes to the signal. In general, not only SERS
beneits from this electromagnetic effect but also other processes such as emission, absorption and non-linear effects54, 55. The SERS effect is highly
distance dependent, and is eliminated when the distance d in Figure 5 reaches around 150 Å56.
Although the single nanoparticle is used to give a simple explanation of the EM enhancement mechanism, in practice, SERS/SERRS is observed thanks to the contribution from the highest ield or hot spot found in small nanoparticle dimers and aggregates in which interstitial sites are the super-enhancing locations. Modelling of these nanostructures using the electromagnetic theory is computationally demanding and several approaches have been developed that are becoming widely used with varying degree of success. The simplest model for the junction is that of two closely spaced spheres that can be tackled using extended Mie theory57, 58. The near ield enhancement can be estimated
and directly related to SERS and surface-enhanced luorescence (SEF)59. The
ield enhancement on metal nanoparticles in the time domain can be simulated using inite-difference time-domain method (FDTD), or a combination of the FDTD and the pseudo-spectral time-domain method (PSTD)60. A very powerful
method to simulate light scattering by arbitrarily shaped particles is the discrete dipole approximation (DDA), and a review with applications appears in ref. 61.
Recently, an appealing electrostatic method has been developed, namely the “plasmon hybridization method”62, that could be seen as an electromagnetic
analog of familiar molecular orbital theory. The latter model describes the plasmon response of complex nanostructures of arbitrary shape. A calculation of the near ield distribution for Ag dimer is shown in Figure 6. Here, the highest ield (hot spot) is clearly located in the space between the two nanoparticles separated by 2 nm.
[5]
figure 6: On the right hand side the simulation shows two Ag spheres with an enhanced electric ield (in black) between the spheres. On the left igure, representations are given of different states of aggregation for the metal nanoparticles.
The most common molecules used to produce Langmuir ilms are amphiphilic (shown in the inset in Figure 7b), which possess hydrophobic groups responsible for keeping the molecules loating and hydrophilic groups that allow for spreading over the air/water interface. In analogy to P-V isotherms, during compression of the Langmuir monolayers, thermodynamic phases are identiied which have been named gas, liquid and solid phases as indicated in Figure 7b. These phases are directly related to the packing of the molecules at the air/water interface. For instance, in the gas phase the molecules are randomly dispersed while in the condensed phase the molecules are closely packed.
The Langmuir-Blodgett (LB) ilms46, 47 are produced by transferring the
Langmuir monolayers from the air/water interface onto solid substrates as illustrated in Figure 7c. During transfer the surface pressure is kept constant (usually within the condensed phase of the Langmuir ilm) and the substrate is immersed and withdrawn by means of a dipper into the water subphase. When the Langmuir ilm is transferred only during the upstrokes, the LB ilms are referred to as Z-type. The ilms transferred only in the downstrokes are the X-type ilms, and for transfer in both immersion and withdrawal Y-type LB ilms are formed. It should be stressed that during transfer the barriers are moved to keep the surface pressure constant. The ratio between the decrease in area on the Langmuir trough within the barriers and the area of the substrate covered by the LB ilm is the transfer ratio (TR), which is essential for controlling the LB ilm deposition. Ideally, TR should be 1, for which the hydrophilicity of the substrate and the speed of the dipper play important roles.
The Raman scattering technique has been used with LB ilms since the irst half of the 1970’s.63 In 1985 Aroca et al.64 reported the SERS effect of a
metal-free tetra-tert-butylphthalocyanine ((t-bu)4H2Pc) LB monolayer deposited onto
evaporated In and Ag island ilms, while Chen et al.65 presented SERS results
for LB monolayers and bilayers of polydiacetylene deposited onto evaporated Ag island ilms. The SERS signal was 102 times the RRS signal for both In
and Ag islands [56], consistent with enhancement factors for other molecules. Chen et al.66 also applied RRS and SERS to study structural and electronic
properties of polydiacetylene forming LB monolayer and multilayers. These results represent the irst observation of a “disorder to order” transformation in an LB ilm, which was assigned to the interactions between the irst and the subsequent layers.
The possibility of working at controlled diluted levels (monomolecular scale) and well-deined molecular spatial distribution provided by the LB technique was important for the development of theoretical and experimental studies to elucidate the SERS effect. The distance dependence of the molecule-metallic substrate for SERS was studied by Kovacs et al.56 with LB ilms of
arachidic acid as spacer layers to control the distance between evaporated In and Ag island ilms and LB monolayers of a highly substituted phthalocyanine. This approach was possible due to the large SERS cross section of phthalocyanine and the low SERS cross section of arachidic acid. A fairly quantitative agreement was found between the calculation and experimental results for both the distance and magnitude of the enhancement, as shown in Figure 8. Experiments carried out with three exciting laser lines show that a distance of ca. 150 Å is suficient to extinguish the enhancement. Similar results were reported by Cotton et al.67.
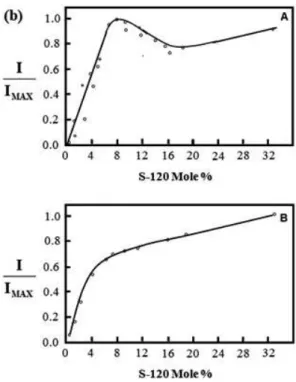
architecture illustrated in Figure 9a indicated that the SERRS intensity was maximized at ca. 8% of the dye, as shown in Figure 9b. This dependence on the coverage might be related to changes in the medium dielectric function and/or dipole-dipole dye interaction.
figure 8: (a) Schematic view of a hemispheroid metal particle covered by an LB monolayer of arachidic acid (spacer layer) and an LB monolayer of phthalocyanine; (b) enhancement factor calculated for In islands using the electromagnetic model (solid line) as a function of distance from the spheroid surface. The experimental points are based on the enhancement factors for the intensity of the 686 cm-1 line of the phthalocyanine LB monolayer. The
wavelength of the exciting laser light was 618 nm. adapted from reference56.
Using LB ilms also made it possible to study how the SERS effect depends on the surface coverage of the metal by the adsorbed dye. Aroca et al.68 produced mixed LB monolayers of phthalocyanine and arachidic acid
onto Ag-coated Sn spheres, evaporated Ag and Au island ilms to enhance the Raman signal. Notably, the maximum enhancement was achieved when the surface coverage was below a monolayer of the dye. Kim et al.69 also
examined the relationship between surface coverage and SERRS for a cyanine dye (S-120) dispersed in LB monolayers containing arachidic acid and methyl arachidate on evaporated Ag island ilms. The results obtained with this ilm
figure 9a: Molecular structure of S-120 and a schematic diagram of the dye-lipid monolayer on the Ag-coated glass slide. The dye and lipid representations are shown approximately to the same scale as the Ag particle (ca. 400 Å diameter). adapted from reference69.
figure 9b: Intensity of the SERRS band at 1360 cm-1vs mole % of dye in
the lipid matrix. Intensities have been normalized to the maximum value. Part A is for data acquired with one scan. The solid and dotted lines correspond to two different batches of evaporated Ag island ilms. Part B is for data acquired by adding 30 scans. adapted from reference69.
The previous examples illustrate how the LB technique has been instrumental to understand SERS mechanisms. At the same time SERS and SERRS have been applied to study a variety of LB ilm properties. For instance, they were used to determine the molecular organization and/or molecular aggregation70-76, to distinguish dye monomer and aggregates77, in molecular
recognition78, 79 and interactions between LB ilm and distinct analytes either in
gas or solution42, 71, 76, 80, 81. The reversible adsorption of NO on phthalocyanine
LB monolayers deposited on 4 nm evaporated Au island ilms was monitored with SERRS spectroscopy82. In a study with three phthalocyanines, namely
-butylphthalocyanine) and YbPc2 (ytterbium bisphthalocyanine), it was shown
that the interaction with the electron-accepting gas affects the intensity of the vibrations of the pyrrole moieties and depends on the central metal atom. The NO-phthalocyanine interaction increases according to the sequence H2TTPc < CuTTPc < YbPc2. Figure 10 shows a pronounced change induced by NOx in
the relative intensities of the stretching frequencies of the macrocycle in the SERRS spectra of YbPc2.
figure 11: (a) DPPG π-A isotherms recorded for the water subphase containing either PAH (0.01 mg/mL) or MB (64x10-6 mg/mL). (b) Scheme
illustrating the DPPG Langmuir ilm at the air-water interface with PAH and MB dissolved in the subphase. (c) SERRS spectra recorded for the one-layer LB ilm for the DPPG transferred onto a 6 nm Ag ilm with the water subphase containing 0.01mg/mL PAH and 64x10-6 mg/mL MB. (d) Optical
image of this one-layer LB ilm on a 6 nm Ag ilm with the line from where the SERRS spectra were collected point-by-point. The inset is a scanning electron microscopy image showing the Ag nanoparticles formed by evaporation of 6 nm Ag onto a glass substrate. In all cases, the SERRS spectra are assigned to MB. reproduced with permission from: P. H. B. Aoki, P. Alessio, M. L. Rodriguez-Mendez, J. A. D. Saez, C. J. L. Constantino. langmuir 25, 13062-13070 (2009).
Aroca and Constantino32 were the irst to report SERS and SERRS images
(mapping and global image) for an LB monolayer. A perylene derivative mixed to arachidic acid (20% and 1% molecular concentration of perylene) was deposited onto an evaporated Ag island ilm. Figure 12 shows at the top SERRS area mappings for the neat and 20% mixed LB monolayers. These area mappings were built collecting SERRS spectra point-by-point from spots of ca. 1 µm in diameter for an area of 40 x 40 µm. The brighter spots represent higher intensities for the SERRS band at 1296 cm-1, which is characteristic
of the perylene derivative. Therefore, the latter reveals that the perylene is more homogeneously dispersed when forming monolayers in a matrix of fatty acid than in neat monolayers. A SEM image of the Ag island ilm with 6 nm mass thickness (SERS-susbtrate) is shown at the bottom (left corner). A line mapping built by collecting SERRS spectra every 1 µm along 100 µm is shown at the bottom right corner for the 1% mixed LB monolayer. The latter result is important because at this % the signal is generated by less than 40,000 perylene molecules and, because the signal-to-noise ratio is ca. 100, it could be concluded that the detection limit for this perylene derivative was in the class of molecules for which SMD could be achieved. This work opened the avenue for SMD by Aroca’s group as will be seen in the next section.
figure 10: SERRS spectra of an LB monolayer of YbPc2 on Au (A), after adsorption of NOx (B) and recovery after gas desorption (C). The pyrrole
frequency region is expanded in the inset. reproduced with permission from:
C. Li, J. Huang, Y. Liang. langmuir 16, 7701-7707 (2000).
Molecular-level interactions between phospholipids and methylene blue (MB) in LB ilms have also been investigated with SERRS83. In order to
figure 12: top - area maps (40 µm x 40 µm) showing the point-by-point variation in the SERRS (514.5 nm irradiation laser line) signal for the baseline-corrected vibrational peaks at 1296 cm-1. The map at the top left corresponds
to the 20% mixed perylene derivative-arachidic acid LB monolayer and at the top right to the neat perylene derivative LB monolayer (both on evaporated Ag island ilms). Bottom – SEM image (20,000X) of the evaporated Ag island ilm (left) and the SERRS line mapping for 1% mixed LB monolayer (right).
adapted from reference32.
Other applications of SERS involve basic spectroscopic studies to infer chemical information through vibrational assignments81, 85-90. Berno et al.91
studied the effect of the laser line excitation energies (1064; 647.1; 514.5 and 488 nm) on enhanced Raman spectra (in and out of resonance with the target molecule), some of these spectra are shown in Figure 13. One and two LB layers of EuPc2 (europium bisphthalocyanine) were deposited onto evaporated substrates containing Ag (6 nm) for SERS experiments and Au (20 nm) for FT-SERS experiments. The latter was presented for the irst time.
Studies involving optical properties at different temperatures have also been reported. Johnson et al.92 (see comment below Figure 14) applied SERRS
spectroscopy to LB monolayers of PDCI (N-octyl-3,4-perylenedicarboximide) deposited onto 6 nm evaporated Ag island ilms. SERRS was recorded at 95 and 293 K as shown in Figure 14, from which it could be concluded that there was a long-range molecular organization in the LB ilms and that the degree of alignment increased with decreasing temperatures.
figure 13: SERS spectra of EuPc2 - (a) one LB monolayer on 20 nm Au
island ilm; (b)-(d) two LB monolayers on 6 nm Ag island ilm. reproduced with permission from: B. Berno, A. Nazri, R. Aroca. Journal of raman spectroscopy 27, 41-47 (1996).
figure 14: SERRS spectra of an LB monolayer of neat PDCl transferred at 25 mN/m on evaporated Ag island ilm recorded at different temperatures.
reproduced with permission from: E. Johnson, R. Aroca, Y. Nagao. Journal of Physical chemistry 95, 8840-8843 (1991).
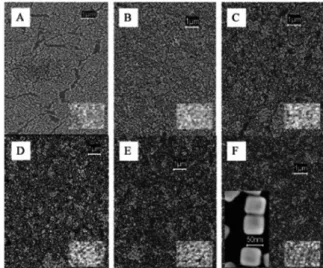
The LB technique has also been used as a strategy to produce SERS-active substrates93-96. Mahmoud et al.95 developed a platform to study SERS
from adsorbed molecules on nanoparticle surfaces. For instance, 50 nm Ag nanocubes were deposited onto quartz substrate at different surface pressures, thus yielding LB monolayers with distinct interparticle distances shown in Figure 15. The natural aggregation of the nanocubes in the LB monolayer is beneicial for SERS spectroscopy as depicted in Figure 16, since aggregation leads to a broad localized surface plasmon band that strongly enhances the scattering of Raman photons.
figure 16: SERS spectra of bulk solid PVP and PVP adsorbed onto the surface of Ag nanocubes deposited onto a quartz substrate at surface pressures of 0, 5, 10, 15, 20, and 25 mN/m. adapted from reference95. PVP =
poly(vinylpyrolidone).
With regard to the type of molecules used for SERS, pyridine dyes were the irst studied. However, there is a wide scope of molecules that have been incorporated into LB ilms for SERS/SERRS studies. They include mono and bis phthalocyanines56, 64, 71, 80, 85, polydiacetylene65, cyanides69, perylenes32, 70, 77, 97-100, lipids78, 90, 101, 102, C
60
103, 104, drugs such as pirarubicin, adriamycin,
daunorubicin and idarubicin, adenosine, thymidine and uridine, methylene blue83, 105, 106, crown ethers93, azobenzenes and azopolymers89, 94, 107-109, pyridine
and derivatives110, rhodamine and derivatives25, 111, poly-p-phenylenevinylene
derivative88, poly(vinyl) pyrrolidone95, xanthene dye112. A detailed discussion
of molecule speciicity for SERS and a list of molecules studied using SERS or SERRS are found in10.
4. SerS/SerrS and single molecule detection (Smd)
Single Molecule Spectroscopy (SMS)113 represents spectroscopic
detection at the ultimate sensitivity level of ca. 1.66 x 10⁻²⁴ moles of the
molecule of interest (1.66 yoctomole), a quantity of moles equal to the inverse of Avogadro’s number. To achieve a situation in which only one molecule is in resonance, one has to dilute the target molecule to work with roughly 10 -10 mole/liter concentrations, in a probed volume of 10 µm3. In addition, very
important for the work described here is the fact that detection of the single molecule must be done in the presence of million or billions of solvent or host molecules. Also important is the occurrence of noise from the measurement itself.
SMS encompasses several techniques. However, given the large molecular cross section of luorescence species, luorescence has been the paramount analytical technique114 in SMD experiments, and has been a reference point
for the development of SMD via SERS/SERRS. The advantage of the SERS/ SERRS approach is in the rich structural information contained in the Raman scattering itself, enabling SMD with molecular recognition and structural selectivity19, 115. In one of the seminal papers of SMD-SERS (Kneipp21), the
experiments were carried out using near-infrared excitation at 830 nm and collecting SERS spectra of crystal violet directly adsorbed onto Ag colloids. It means that the laser line was out of resonance with the electronic absorption of the target molecule. In the second paper (Emory & Nie22) single molecules
were detected at room temperature also on Ag colloids. The dye was rhodamine 6G, and the laser line 514.5 nm, i.e., the effect was enhanced resonance Raman or SERRS.
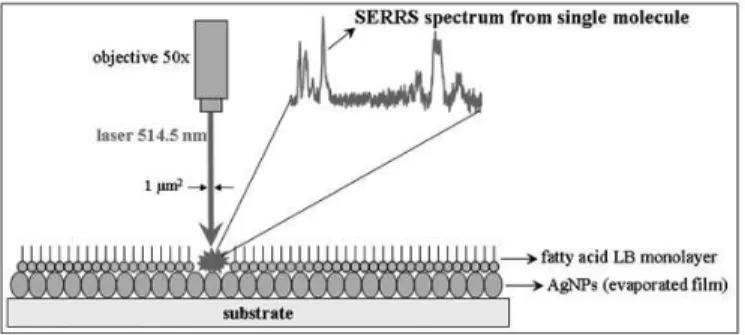
We have adopted a different approach for SMD, which combines SERS/ SERRS and the LB technique for thin ilm fabrication20. The advantages of the
technique have been widely recognized: “in our opinion, the most convincing method based on ultra-low concentrations is possibly the one based on langmuir-Blodgett monolayers, developed by aroca and co-workers.” (Le Ru, Echegoing & Meyer. arXiv:physics/0608139 v1 14 Aug 2006). In the case of SERRS, SMD can be achieved by exploiting the multiplicative effect of RRS ampliication (up to 6 orders of magnitude) together with the plasmon ampliication (up to 7 orders of magnitude in average), leading to (RRS x SERS). In addition, the approach takes advantage of the micrometric spatial resolution in Raman-microscopy, including new spatial mapping capabilities, and high sensitivity available in dispersive systems equipped with CCD detectors. Mapping of the enhancing surface, coated with an LB monolayer, permits to create chemical images that provide a powerful visualization of the variation of the enhancement factor on the two-dimensional nanostructured
surface. When the statistics breaks down, a clear image can be created of the detection of the rare event involving the coupling between the molecule and the hot spot. The common effect of photobleaching116 has been minimized by
working with very low energy density at the sample and short accumulation times. Furthermore, advantage is taken of the precise molecular control provided by the LB technique to produce monolayers containing a certain amount of target molecule per unit area of the LB ilm deposited onto Au or Ag nanoparticles (usually glass covered by AgNPs or AuNPs, formed by vaccum evaporation). Figure 17 shows a scheme where the single molecule to be detected (target molecule) is in a matrix of fatty acid with an average distribution of 1 molecule per micrometer square. This distribution is based on the spatial resolution given by the objective and the laser line used in micro-Raman. In summary, using the LB technique, an analyte of interest can be doped into a matrix of spectral silent material (low Raman cross section), allowing a high degree of control of an analyte’s concentration per unit of surface enhancing area. Furthermore, by spatially “ixing” the analyte onto the SERS substrate, the dynamics that complicate much of SM-SERS in solution can be avoided. The collected dataset (spectral maps) can then be analyzed to achieve a clearer picture of analyte/substrate interactions uncomplicated by the effect of dynamics.
figure 17: experimental setup applied by Aroca’s group to collect SERRS spectra from a single molecule.
The results leading to SMD using SERRS and LB ilms20, 100, 117, 118 are
shown in Figure 18, which presents SERRS global images for single molecules of a perylene derivative dispersed in a LB monolayer of arachidic acid. In the global image the laser is defocused reaching an area with diameter of ca. 40 mm and only the light from a speciic wavenumber is collected (1370 cm-1,
characteristic of the perylene derivative in this case). Therefore, when the target molecule is absent, only a scattered background is observed instead of bright spots. In 2007, SERS (instead of SERRS) was applied to SMD for the irst time using LB ilms118. A step toward SMD in a biological system was
taken recently with a labeled phospholipid in a fatty acid LB monolayer on Ag evaporated island ilms112, as shown in Figure 19. One should note that SMD
could also be achieved with SERRS in perylene dye ilms fabricated with the conventional casting method that can be found in a recent review of SMD using SERRS and SERS27.
figure 18: one global image for neat arachidic acid (AA) LB monolayer on Ag evaporated island ilm (top) and two global images for perylene derivative single molecule LB monolayer (AzoPTCD/AA), all recorded at 1370 cm-1. reproduced with permission from: C. J. L. Constantino, T. Lemma,
figure 19a: components of an LB-SERRS ilm - (a) TRITC-DHPE tagged phospholipid; (b) arachidic acid (AA) as matrix material; (c) illustration of the AA/TRITC-DHPE mixed monolayer on an Ag evaporated ilm. reproduced with permission from: N. P. W. Pieczonka, G. Moula, R. F. Aroca. langmuir
25, 11261-11264 (2009). TRITC-DHPE = N-(6-tetramethylrhodaminethiocarb amoyl)-1,2-dihexadecanoyl-sn-glycero-3-phosphoethanolamine.
figure 19b: ensemble SERRS map of a ilm fabricated with 10:1 AA/ TRITC-DHPE excited at 514.5 nm and ca. 20 μW. Step sizes were 3 μm x 3 μm, and the map was constructed from 1,156 collected spectra. An intensity map was generated from the integrated area of the 1650 cm-1 band. The inset
shows the likely orientation of TRITC-DHPE with respect to the metal surface.
reproduced with permission from: N. P. W. Pieczonka, G. Moula, R. F. Aroca.
langmuir 25, 11261-11264 (2009).
The attempts by various groups to reach SMD using SERS led to developments that deserve to be highlighted. In 1988, the SERRS spectra of rhodamine 6G (R6G) were collected at a concentration of 7x10-14 mol/L in
an Ag colloid solution containing NaCl, which was added to induce AgNPs aggregation and therefore extend the absorption band to the near IR. The latter led to ca. 100 R6G molecules within the volume probed by the laser (10
nL)119. These results were conirmed in 1995 when ca. 60 R6G molecules were
detected within the laser probed volume via SERRS (514.5 nm laser line) for a concentration of 8x10-16 mol/L of R6G in Ag colloid aqueous solution activated
via NaCl120. Still in 1988, SERS signals were obtained from around 100 pyridine
molecules on an Ag electrode121. Taylor et al.122 were able to detect crystal
violet in Ag colloids using SERRS at concentrations below 10-12 mol/L whose
detection limit was estimated at ca. 600 molecules (1 nL probed volume). In 1996 Rodger et al.123 detected ca. 200 rhodamine dye molecules using SERRS
from Ag colloid solutions at 6.87x10⁻¹⁸ mol/L. In 1997 Kneipp et al.21 and
Nie and Emory22 announced the SMD using SERS, which motivated further
studies. In 1998 Zeisel et al.124 obtained the SERS spectra from approximately
300 dye molecules (cresyl fast violet and R6G) on Ag substrates. In 1999 Xu et al.125 detected single hemoglobin (Hb) protein molecules using SERS for a Hb
molecule attached between two AgNPs. Since 2000 Aroca’ group has worked on LB ilms, with detection of 40,00032 and 400126 target molecules (distinct
dye perylene derivatives), and in 2001 the irst article regarding SMD using SERRS and LB ilms was published20. In 2005 Koo et al.127 reported SMD
for deoxyguanosine monophosphate and deoxyadenosine monophosphate using SERS with coherent anti-Stokes Raman scattering and Delino et al.128
for cytochrome C in Ag colloid solution or immobilized onto glass slides using a quasi resonant laser line. In 2006 Kalkan and Fonash reported SMD of luorescein using SERS and Ag surfaces activated by laser129. Zhang et
al.130 announced in 2009 SMD using SERS for azo dyes (related to human
carcinogen) adsorbed on Ag particle aggregates in colloid, while Blackie et al.131 applied the bianalyte approach to detect adenine through SERS.
The theoretical framework for the phenomenology and statistics of SERS signals from single molecules in the presence of the electromagnetic hot spots was put forward by Le Ru et al.132, which could account for various
experimental manifestations of the effect reported in the literature. 5. final remarks and perspectives
After the initial reports of the spectrum of a single molecule21, 133, there
has been a concerted effort to demonstrate and establish SERS/SERRS as an analytical technique for single molecule detection (SMD). Single-molecule-SERS and single-molecule-SERRS, carrying the molecular ingerprints in the Raman vibrational information are on the rise, as complementary methods to luorescence and surface-enhanced luorescence in the emergent ield of single molecule spectroscopy134. The use of the LB technique has played an important
role in the observation of SERS/SERRS spectra of a single molecule and has contributed to validate single molecule detection in several experiments: i) using doped LB monolayers with an average of one molecule in the ield of view of the Raman-microscope135, 136; ii) LB used in the bi-analyte technique, where
two analyte molecules are simultaneously used to conirm the single molecule origin of the observed SERS/SERRS136, 137. SMD has also been conirmed using
isotopes offering unique vibrational signatures for the same electronic state138, 139. The validation of SMD-SERS (SMD-SERRS) led to a consensus on the idea
of “hot spots”: a spatial location in Ag or Au nanostructure aggregates where the enhancement factor is greater than 107.34 Hot spots are described as localized
surface plasmon resonances (LSPR), i.e., spatially localized resonances producing nanoscale spatial locations of highly enhanced electromagnetic ields. Hot spots are found in the junctions of aggregated nanostructures such of Ag and Au; colloidal aggregates or evaporated Ag island ilms among others. The potential and advantages of the 2D LB structures to explore the spectral properties in the transition from the average SERS/SERRS spectra to the single molecule regime have been demonstrated with a large amount of data collected for a single LB on evaporated island ilms. The chemical images created with the SERS/SERRS data provide a mapping of the enhancement factor distribution on the surface coated with the probe molecule. In addition to the simple mapping illustrated in this review, the statistical analysis of the large data collected is under development for single molecule identiication, and many potential applications in biology, medicine and materials science. Future developments of LB-SERS or LB-SERRS will harness either the strong signal in the “average” SERS/SERRS experiments or the unique properties of the spectra of isolated species when the statistical average is broken down. In addition, the LB technique may help the development of SERS substrates as one of the methods used in nanolithography.
acKnowledgementS
referenceS
1. D. L. Feldheim, C. A. Foss, eds. Metal nanoparticles. synthesis, characterization and applications. Marcel Dekker, Inc., New York (2002).
2. C. S. R. Kumar, J. Hormes, C. Leuschner, eds. nanofabrication towards biomedical applications. Verlag GmbH &Co. KGaA, Weinheim (2005). 3. G. Schmid, ed. nanoparticles. From theory to applications.
Wiley-VCH Verlag, Essen (2005).
4. J. M. Campelo, D. Luna, R. Luque, J. M. Marinas, A. A. Romero.
chemsuschem 2, 18-45 (2009).
5. N. G. Khlebtsov, L. A. Dykman. Journal of Quantitative spectroscopy & radiative transfer 111, 1-35 (2010).
6. S. Q. Liu, Z. Y. Tang. Journal of Materials chemistry 20, 24-35 (2010). 7. M. J. Natan, L. A. Lyon. Metal nanoparticles: synthesis,
characterization and applications, New York (2002).
8. M. G. Albrecht, J. A. Creighton. Journal of the american chemical society 99, 5215-5217 (1977).
9. D. L. Jeanmaire, R. P. VanDuyne. Journal of electroanalytical chemistry 84, 1-20 (1977).
10. R. Aroca. surface-enhanced vibrational spectroscopy. John Wiley & Sons, Chichester (2006).
11. M. Fleischmann, P. J. Hendra, A. J. McQuillan. chemical Physics letters 26, 163-166 (1974).
12. M. Moskovits. reviews of Modern Physics 57, 783-826 (1985). 13. K. A. Willets, R. P. Van Duyne. Annual Review of Physical Chemistry
58, 267-297 (2007).
14. E. C. Le Ru, P. G. Etchegoin. Principles of surface enhanced raman spectroscopy (and related plasmonic effects). Elsevier, Amsterdam (2009.).
15. C. Noguez. Journal of Physical chemistry C 111, 3806-3819 (2007). 16. H. A. Atwater. Scientiic American 296, 56-63 (2007).
17. A. Campion, P. Kambhampati. chemical society reviews 27, 241-250 (1998).
18. A. Otto, I. Mrozek, H. Grabhorn, W. Akemann. condens. Matter 4, 1143-1212 (1992).
19. K. Kneipp, H. Kneipp. applied spectroscopy 60, 322A-334A (2006). 20. C. J. L. Constantino, T. Lemma, P. A. Antunes, R. Aroca. analytical
chemistry 73, 3674-3678 (2001).
21. K. Kneipp, Y. Wang, H. Kneipp, L. T. Perelman, I. Itzkan, R. R. Dasari, M. S. Feld. Physical review letters 78, 1667-1670 (1997).
22. S. Nie, S. R. Emory. science (Washington, d. c.) 275, 1102-1106 (1997).
23. B. Tolaieb, C. J. L. Constantino, R. F. Aroca. analyst (cambridge, United Kingdom) 129, 337-341 (2004).
24. E. J. Bjerneld, Z. Foeldes-Papp, M. Kaell, R. Rigler. Journal of Physical chemistry B 106, 1213-1218 (2002).
25. P. J. G. Goulet, R. F. Aroca. analytical chemistry (Washington, dc, United states) 79, 2728-2734 (2007).
26. R. C. Maher, M. Dalley, E. C. Le Ru, L. F. Cohen, P. G. Etchegoin, H. Hartigan, R. J. C. Brown, M. J. T. Milton. Journal of chemical Physics
121, 8901-8910 (2004).
27. N. P. W. Pieczonka, R. F. Aroca. chemical society reviews 37, 946– 954 (2008).
28. R. Zenobi. chimia 53, 35-37 (1999).
29. R. F. Aroca, R. A. Alvarez-Puebla, N. Pieczonka, S. Sanchez-Cortez, J. V. Garcia-Ramos. advances in colloid and interface science 116, 45-61 (2005).
30. G. A. Baker, D. S. Moore. analytical and Bioanalytical chemistry 382, 1751-1770 (2005).
31. G. Braun, I. Pavel, A. R. Morrill, D. S. Seferos, G. C. Bazan, N. O. Reich, M. Moskovits. Journal of the american chemical society 129, 7760-7761 (2007).
32. R. F. Aroca, C. J. L. Constantino. langmuir 16, 5425-5429 (2000). 33. S. B. Chaney, S. Shanmukh, R. A. Dluhy, Y. P. Zhao. appl. Phys. lett.
87, 031908-031910. (2005).
34. S. J. Lee, A. R. Morrill, M. Moskovits. Journal of the american chemical society 128, 2200-2201 (2006).
35. Y. L. Wang, H. J. Chen, E. K. Wang. nanotechnology 19, article number105604. (2008).
36. R. F. Aroca, P. J. G. Goulet, D. S. Dos Santos, Jr., R. A. Alvarez-Puebla, O. N. Oliveira, Jr. analytical chemistry 77, 378-382 (2005).
37. K. Yliniemi, M. Vahvaselka, Y. V. Ingelgem, K. Baert, B. P. Wilson, H. Terryn, K. Kontturi. J. Mater. chem. 18, 199-206. (2008).
38. M. Fan, A. G. Brolo. Phys. chem. chem. Phys. 11, 7381-7389. (2009). 39. H. Ko, V. V. Tsukruk. small 4, 1980-1984 (2008).
40. M. Yang, T. Chen, W. S. Lau, Y. Wang, Q. Tang, Y. Yang, H. Chen.
small 5, 198-202 (2009).
41. D. K. Lim, K. S. Jeon, H. M. Kim, J. M. Nam, Y. D. Suh. nature Materials 9, 60-67 (2010).
42. P. H. B. Aoki, P. Alessio, J. A. De Saja, C. J. L. Constantino. Journal of raman spectroscopy 41, 40-48. (2010).
43. X.-M. Lin, Y. Cui, Y.-H. Xu, B. Ren, Z.-Q. Tian. analytical and Bioanalytical chemistry 394, 1729-1745 (2009).
44. H. Seki. Journal of electron spectroscopy and related Phenomena 39, 289-310 (1986).
45. L. Rodriguez-Lorenzo, R. A. Alvarez-Puebla, I. Pastoriza-Santos, S. Mazzucco, O. Stephan, M. Kociak, L. M. Liz-Marzan, F. J. G. de Abajo.
J. am. chem. soc. 131, 4616-4618. (2009).
46. M. C. Petty. langmuir-Blodgett Films: An Introduction. Cambridge University Press, Cambridge (1996).
47. G. Roberts. langmuir-Blodgett Films. Plenum Press, New York (1990). 48. D. A. Long. the raman effect. John Wiley & Sons, Ltd, Chichester
(2001).
49. J. J. Laserna. Modern techniques in raman spectroscopy. John Wiley & Sons, Toronto (1996).
50. E. C. Le Ru, P. G. Etchegoin. chemical Physics letters 423, 63-66 (2006).
51. J. P. Camden, J. A. Dieringer, J. Zhao, R. P. Van Duyne. accounts of chemical research 41, 1653-1661 (2008).
52. G. C. Schatz, R. P. Van Duyne. In Handbook of vibrational spectroscopy
(J. M. C. a. P. R. Grifiths, ed.), pp. 759-774. John Wiley & Sons, Ltd (2002).
53. K. L. Kelly, E. Coronado, L. L. Zhao, G. C. Schatz. Journal of Physical chemistry B 107, 668-677 (2003).
54. J. Kneipp, H. Kneipp, K. Kneipp. chemical society reviews 37, 1052-1060 (2008).
55. E. Giorgetti, G. Margheri, S. Sottini, M. Muniz-Miranda. synthetic Metals 139, 929-932 (2003).
56. G. J. Kovacs, R. O. Loutfy, P. S. Vincett, C. Jennings, R. Aroca.
langmuir 2, 689-694 (1986). 57. G. Mie. Physik. Z. 8, 769 (1908).
58. H. Xu, M. Kall. sensors and actuators, B: chemical B87, 244-249 (2002).
59. H. Xu, X.-H. Wang, M. P. Persson, H. Q. Xu, M. Kall, P. Johansson.
Physical review letters 93, 243002/243001-243002/243004 (2004). 60. W. H. P. Pernice, F. P. Payne, D. F. G. Gallagher. optics express 15,
11433-11443 (2007).
61. M. A. Yurkin, A. G. Hoekstra. Journal of Quantitative spectroscopy & radiative transfer 106, 558-589 (2007).
62. E. Prodan, C. Radloff, N. J. Halas, P. Nordlander. science 302, 419-422 (2003).
63. J. Cipriani, S. Racine, R. Dupeyrat, H. Hasmonay, M. Dupeyrat, Y. Levy, C. Imbert. optics communications 11 70-73 (1974).
64. R. Aroca, C. Jennings, G. J. Kovac, R. O. Loutfy, P. S. Vincett. Journal of Physical chemistry 89, 4051-4054 (1985).
65. Y. J. Chen, G. M. Carter, S. K. Tripathy. solid state comm. 54, 19-22 (1985).
66. Y. J. Chen, S. K. Tripathy, G. M. Carter, B. S. Elman, E. S. Koteles, J. George. solid state comm. 58, 97 (1986).
67. T. M. Cotton, R. A. Uphaus, D. Mobius. J. Phys. chem. 90, 6071 (1986).
68. D. Battisti, R. Aroca. Journal of Molecular structure 218, 351-356 (1990).
69. J. H. Kim, T. M. Cotton, R. A. Uphaus, D. Moebius. J. Phys. chem. 93, 3713-3720 (1989).
70. A. K. Maiti, R. Aroca, Y. Nagao. Journal of raman spectroscopy 24, 351-356 (1993).
71. J. Souto, R. Aroca, J. A. DeSaja. Journal of raman spectroscopy 22, 349-353 (1991).
72. C. J. L. Constantino, P. A. Antunes, E. C. Venancio, N. Consolin, F. J. Fonseca, L. H. C. Mattoso, R. F. Aroca, O. N. Oliveira, Jr., A. Riul, Jr.
sensor letters 2, 95-101 (2004).
74. C. J. L. Constantino, R. F. Aroca, J. A. He, V. Zucolotto, L. Li, O. N. Oliveira, Jr., J. Kumar, S. K. Tripathy. applied spectroscopy 56, 187-191 (2002).
75. C. J. L. Constantino, R. F. Aroca, S. Yang, V. Zucolotto, L. Li, O. N. Oliveira, Jr., A. L. Cholli, J. Kumar, S. K. Tripathy. Journal of Macromolecular science, Pure and applied chemistry A38, 1549-1557 (2001).
76. C. Heywang, M. S.-P. Chazalet, M. Masson, J. Bolard. spectrosc. Biol. Mol.: new dir., eur. conf., 8th, 339-342 (1999).
77. U. Guhathakurta-Ghosh, R. Aroca, R. O. Loutfy, Y. Nagao. Journal of raman spectroscopy 20, 795-800 (1989).
78. J. Huang, C. Li, Y. Liang. langmuir 16, 3937-3940 (2000). 79. C. Li, J. Huang, Y. Liang. langmuir 16, 7701-7707 (2000).
80. R. E. Clavijo, D. Battisti, R. Aroca, G. J. Kovacs, C. A. Jennings.
langmuir 8, 113-117 (1992).
81. Y. Gorbunova, M. L. Rodriguez-Mendez, J. Souto, L. Tomilova, J. A. de Saja. chem. Mater. 7, 1443-1447 (1995).
82. D. Battisti, R. Aroca. Journal of the american chemical society 114, 1201-1204 (1992).
83. P. H. B. Aoki, P. Alessio, M. L. Rodriguez-Mendez, J. A. D. Saez, C. J. L. Constantino. langmuir 25, 13062-13070 (2009).
84. L. Gaffo, C. J. L. Constantino, W. C. Moreira, R. F. Aroca, O. N. Oliveira. Jr. spectrochimica acta, Part a: Molecular and Biomolecular spectroscopy 60A, 321-327 (2004).
85. D. Battisti, L. Tomilova, R. Aroca. chemistry of Materials 4, 1323-1328 (1992).
86. T. Lemma, R. F. Aroca. Journal of raman spectroscopy 33, 197-201 (2002).
87. G. G. Siu, L. Yulong, X. Shishen, X. Jingmei, L. Tiankai, X. Linge.
thin solid Films 274, 147-149 (1996).
88. M. Ferreira, C. J. L. Constantino, C. A. Olivati, A. L. Vega, D. T. Balogh, R. F. Aroca, R. M. Faria, O. N. Oliveira. Jr. langmuir 19, 8835-8842 (2003).
89. M. Haro, D. J. Ross, L. Oriol, I. Gascon, P. Cea, M. C. Lopez, R. F. Aroca. langmuir 23, 1804-1809 (2007).
90. D. Volpati, A. E. Job, R. F. Aroca, C. J. L. Constantino. Journal of Physical chemistry B 112, 3894-3902 (2008).
91. B. Berno, A. Nazri, R. Aroca. Journal of raman spectroscopy 27, 41-47 (1996).
92. E. Johnson, R. Aroca, Y. Nagao. Journal of Physical chemistry 95, 8840-8843 (1991).
93. A. Feofanov, A. Ianoul, E. Kryukov, S. Maskevich, G. Vasiliuk, L. Kivach, I. Nabiev. analytical chemistry 69, 3731-3740 (1997). 94. J. Zhang, J. Zhao, H. X. He, H. L. Zhang, H. L. Li, Z. F. Liu. langmuir
14, 5521-5525 (1998).
95. M. A. Mahmoud, C. E. Tabor, M. A. El-Sayed. Journal of Physical chemistry C 113 (14), 5493-5501 (2009).
96. M. A. Mahmoud, M. A. El-Sayed. nano letters 9 (8), 3025-3031 (2009).
97. E. Johnson, R. Aroca, J. Pahapill. Journal of Molecular structure 293, 331-335 (1993).
98. P. J. G. Goulet, N. P. W. Pieczonka, R. F. Aroca. analytical chemistry
75, 1918-1923 (2003).
99. P. J. G. Goulet, N. P. W. Pieczonka, R. F. Aroca. Journal of raman spectroscopy 36, 574-580 (2005).
100. C. J. L. Constantino, T. Lemma, P. A. Antunes, R. Aroca. spectrochimica acta, Part a: Molecular and Biomolecular spectroscopy 58A, 403-409 (2002).
101. M. Saint-Pierre Chazalet, M. Masson, C. Bousquet, G. Bolbach, Y. Ridente, J. Bolard. thin solid Films 244 852-856 (1994).
102. W. Miao, X. Du, Y. Liang. Langmuir 19 (13), 5389-5396 (2003). 103. G. G. Siu, Y. Liu, S. Xie, J. Xu, T. Li, L. Xu. thin solid Films 274
147-149 (1996).
104. G. Xu, F. Yan. spectrochimica acta Part a: Molecular and Biomolecular spectroscopy 70, 104-108 (2008).
105. C. Heywang, M. S.-P. Chazalet, M. Masson, A. Garnier-Suillerot, J. Bolard. langmuir 12, 6459-6467 (1996).
106. C. Heywang, M. S.-P. Chazalet, M. Masson, J. Bolard. Biophysical Journal 75, 2368-2381 (1998).
107. C. J. L. Constantino, R. F. Aroca, C. R. Mendonca, S. V. Mello, D. T. Balogh, O. N. Oliveira. Jr. spectrochimica acta, Part a: Molecular and Biomolecular spectroscopy 57A, 281-289 (2001).
108. C. J. L. Constantino, R. F. Aroca, C. R. Mendonca, S. V. Mello, D. T. Balogh, S. C. Zilio, O. N. De Oliveira, Jr. advanced Functional Materials 11, 65-68 (2001).
109. N. Marquestaut, A. Martin, D. Talaga, L. Servant, S. Ravaine, S. Reculusa, D. M. Bassani, E. Gillies, F. Lagugne-Labarthet. langmuir
24, 11313-11321 (2008).
110. X. L. Hou, L. X. Wu, W. Q. Xu, L. D. Qin, C. S. Wang, X. Zhang, J. C. Shen. colloid surf. a-Physicochem. eng. asp. 198, 135-140 (2002). 111. A. Tao, F. Kim, C. Hess, J. Goldberger, R. He, Y. Sun, Y. Xia, P. Yang.
nano letters 3, 1229-1233 (2003).
112. N. P. W. Pieczonka, G. Moula, R. F. Aroca. langmuir 25, 11261-11264 (2009).
113. W. E. Moerner. 106, 910-927 (2002).
114. J. R. Lakowicz, C. D. Geddes, I. Gryczynski, J. Malicka, Z. Gryczynski, K. Aslan, J. Lukomska, E. Matveeva, J. Zhang, R. Badugu, J. Huang.
Journal of Fluorescence 14, 425-441 (2004).
115. P. G. Etchegoin, M. Meyer, E. Blackie, E. C. Le Ru. analytical chemistry ACS ASAP (2007).
116. P. G. Etchegoin, P. D. Lacharmoise, E. C. Le Ru. analytical chemistry
81, 682-688 (2009).
117. P. Goulet, N. Pieczonka, R. Aroca. canadian Journal of analytical sciences and spectroscopy 48, 146-152 (2003).
118. P. J. G. Goulet, R. F. Aroca. canadian Journal of analytical sciences and spectroscopy 52, 172-177 (2007).
119. K. Kneipp. experimentelle technik der Physik (Berlin) 36, 161-166 (1988).
120. K. Kneipp, Y. Wang, R. R. Dasari, M. S. Feld. applied spectroscopy
49, 780-784 (1995).
121. K. Kneipp, H. Kneipp, I. Itzkan, R. R. Dasari, M. S. Feld. chemical reviews (Washington, d. c.) 99, 2957-2975 (1999).
122. G. T. Taylor, S. K. Sharma, K. Mohanan. applied spectroscopy 44, 635-640 (1990).
123. C. Rodger, W. E. Smith, G. Dent, M. Edmondson. Journal of the chemical society, dalton transactions: inorganic chemistry, 791-799 (1996).
124. D. Zeisel, V. Deckert, R. Zenobi, T. Vo-Dinh. chemical Physics letters
283, 381-385 (1998).
125. H. Xu, E. J. Bjerneld, M. Kall, L. Borjesson. Physical review letters
83, 4357-4360 (1999).
126. C. J. L. Constantino, J. Duff, R. Aroca. spectroc. acta Pt. a-Molec. Biomolec. spectr. 57, 1249-1259 (2001).
127. T.-W. Koo, S. Chan, A. A. Berlin. optics letters 30, 1024-1026 (2005). 128. I. Delino, A. R. Bizzarri, S. Cannistraro. Biophysical chemistry 113,
41-51 (2005).
129. A. K. Kalkan, S. J. Fonash. applied Physics letters 89, 233103/233101-233103/233103 (2006).
130. Z. L. Zhang, Y. F. Yin, J. W. Jiang, Y. J. Mo. Journal of Molecular structure 920 297-300. (2009).
131. E. J. Blackie, E. C. Le Ru, P. G. Etchegoin. J. am. chem. soc. 131, 14466-14472 (2009).
132. E. C. Le Ru, P. G. Etchegoin, M. Meyer. Journal of chemical Physics
125, 204701/204701-204701/204713 (2006). 133. S. Nie, S. R. Emory. science 275, 1102-1106 (1997). 134. W. E. Moerner. J. Phys. Chem. B 106, 910-927 (2002).
135. C. J. Constantino, T. Lemma, P. A. Antunes, R. Aroca. analytical chemistry 73, 3674-3678. (2001).
136. P. J. G. Goulet, R. F. Aroca. analytical chemistry 79, 2728-2734 (2007).
137. E. C. Le Ru, M. Meyer, P. G. Etchegoin. Journal of Physical chemistry
B 110, 1944-1948 (2006).
138. J. A. Dieringer, R. B. Lettan, II, K. A. Scheidt, R. P. Van Duyne.
Journal of the american chemical society 129, 16249-16256 (2007). 139. P. G. Etchegoin, E. C. Le Ru, M. Meyer. Journal of the american