BGD
7, 4089–4126, 2010Fluxes of CO2, CH4 and N2O from
savannah
S. Castaldi et al.
Title Page
Abstract Introduction
Conclusions References
Tables Figures
◭ ◮
◭ ◮
Back Close
Full Screen / Esc
Printer-friendly Version
Interactive Discussion
Discussion
P
a
per
|
Dis
cussion
P
a
per
|
Discussion
P
a
per
|
Discussio
n
P
a
per
Biogeosciences Discuss., 7, 4089–4126, 2010 www.biogeosciences-discuss.net/7/4089/2010/ doi:10.5194/bgd-7-4089-2010
© Author(s) 2010. CC Attribution 3.0 License.
Biogeosciences Discussions
This discussion paper is/has been under review for the journal Biogeosciences (BG). Please refer to the corresponding final paper in BG if available.
Fluxes of CO
2
, CH
4
and N
2
O from soil of
burned grassland savannah of central
Africa
S. Castaldi1, A. de Grandcourt2, A. Rasile1, U. Skiba3, and R. Valentini4
1
Dipartimento di Scienze Ambientali, Seconda Universit `a di Napoli, via Vivaldi 43, 81100 Caserta, Italy
2
Centre de cooperation Internationale en Recherche Agronomique pour le Developpement (CIRAD), Persyst, UPR80, TA B-80/D, 34398 Montpellier Cedex 5, France
3
Centre for Ecology and Hydrology, Edinburgh, Bush Estate, Penicuik, Midlothian EH26 QB, UK
4
Department of Forest Environment and Resources (DISAFRI), University of Tuscia, via S. Camillo de Lellis, 01100 Viterbo, Italy
Received: 17 April 2010 – Accepted: 4 May 2010 – Published: 1 June 2010
Correspondence to: S. Castaldi (simona.castaldi@unina2.it)
BGD
7, 4089–4126, 2010Fluxes of CO2, CH4 and N2O from
savannah
S. Castaldi et al.
Title Page
Abstract Introduction
Conclusions References
Tables Figures
◭ ◮
◭ ◮
Back Close
Full Screen / Esc
Printer-friendly Version
Interactive Discussion
Discussion
P
a
per
|
Dis
cussion
P
a
per
|
Discussion
P
a
per
|
Discussio
n
P
a
per
|
Abstract
Grassland savannah ecosystems subject to frequent fires are considered to have an almost neutral carbon balance, as the C released during burning mostly balance the C fixed by the photosynthetic process. However, burning might modify the net soil-atmosphere exchange of GHGs in the post burning phase so that the radiative balance 5
of the site might shift from neutrality. In the present study the impact of fire on soil fluxes of CO2, CH4 and N2O was investigated in a grassland savannah (Congo Braz-zaville) where high frequency burning is the typical management form of the region. An area was preserved for one season from annual burning and was used as “unburned” treatment. Two field campaigns were carried on at different time length from the fire 10
event, 1 month, in the middle of the dry season, and 8 months after, at the end of the growing season. CO2, CH4 and N2O fluxes, as well as several soil parameters,
were measured in each campaign from burned and unburned plots. Rain events were simulated at each campaign to evaluate magnitude and length of the generated GHG flux pulses. In laboratory experiments, on soil samples from the two treatments, mi-15
crobial biomass, net N mineralization, net nitrification, N2O, NO and CO2 emissions
were analyzed in function of soil water and/or temperature variations. Results showed that fire had a significant effect on GHG fluxes but the effect was transient, as after 8 months differences between treatments were no longer significant. One month after burning CO2 soil emissions were significantly lower in the burned plots, CH4 fluxes 20
were dominated by net emissions rather than net consumption in the unburned area and fire shifted the CH4flux distribution towards more negative values. No significant
effect of fire was observed in the field on N2O fluxes. It was assumed that the low water content was the main limiting factor as in fact laboratory data showed that only above 75% of water saturation, N2O emissions increased sharply and more strongly in the
25
BGD
7, 4089–4126, 2010Fluxes of CO2, CH4 and N2O from
savannah
S. Castaldi et al.
Title Page
Abstract Introduction
Conclusions References
Tables Figures
◭ ◮
◭ ◮
Back Close
Full Screen / Esc
Printer-friendly Version
Interactive Discussion
Discussion
P
a
per
|
Dis
cussion
P
a
per
|
Discussion
P
a
per
|
Discussio
n
P
a
per
sufficient to significantly stimulate CO2production in the laboratory and rain simulation in the field stimulated soil respiration. However in the laboratory the highest fluxes were measured in burned soil whereas in the field the opposite was observed. Increasing the incubation temperature from 25◦C to 37◦C affected negatively microbial growth and activities (mineralization and nitrification) but stimulated gas production (N2O and
5
CO2). Overall, data indicate that fire would have a reductive or null impact on soil GHG
emissions in savannah sites presenting similar soil characteristics (acidic, well drained, nutrient poor) and land management (high fire frequency).
1 Introduction
In the African continent fire is a widespread phenomenon, which occurrence varies 10
from “natural” events, based entirely on lightning as ignition source, to actively applied burning systems, based on rangeland management (Bothma and Du, 1996; Trollope, 1990). African savannas, which represent approximately half of the African land sur-face (Scholes and Walker, 2004), are mostly characterized by the co-dominance of trees and grasses (Sankaran et al., 2005), and are distributed in areas characterized 15
by a clear dry season, followed by a rainy season (Huntley and Walker, 1982; Scholes and Hall, 1996). Mean annual precipitation, disturbance by fire and/or herbivory, du-ration of dry season and soil fertility are the key factors which determine the density of grasses, trees and shrubs (Sankaran et al., 2005; Bond, 2008). Above 650 mm of mean annual precipitation, the water input to the ecosystem would be sufficient for 20
woody canopy closure, and the coexistence of trees and grassed is the result of burn-ing or strong herbivory pressure (Sankaran et al., 2005). Pastoral activity is always combined with burning.
Savannah fires do also influences nutrient cycling patterns by modifying plant cover and biodiversity (Menault, 1977; Swaine et al., 1992; Sankaran et al., 2005), and by 25
BGD
7, 4089–4126, 2010Fluxes of CO2, CH4 and N2O from
savannah
S. Castaldi et al.
Title Page
Abstract Introduction
Conclusions References
Tables Figures
◭ ◮
◭ ◮
Back Close
Full Screen / Esc
Printer-friendly Version
Interactive Discussion
Discussion
P
a
per
|
Dis
cussion
P
a
per
|
Discussion
P
a
per
|
Discussio
n
P
a
per
|
have been reported in burned savannas at the onset of rainy season (Adedejii, 1983; Singh et al., 1991). Soil NH+4 concentration was found to increase in savannah and shrubland soils after burning (Christensen, 1973; Singh et al., 1994; Castaldi and Aragosa, 2002), as result of organic matter combustion and temperature induced re-lease from organo-mineral soil complexes (Raison, 1979; Kovacic et al., 1986; Prieto-5
Fernandez et al., 2004). Andersson et al. (2004b) measured increased values of NH+4, dissolved organic N and C in savannahs soil after burning, which supported higher rates of mineralized and nitrification as soon as soil water content allowed for micro-bial activation. This generally coincides with rain events in seasonally-dry ecosystems and is accompanied by pulses of NOx, N2O, CO2 emissions (Davidson et al., 1993;
10
Breuer et al., 2000; Garcia-Montiel, 2003; Butterbach-Bahl et al., 2004; van Haren et al., 2005). These have a variable length and magnitude which depends on fire occur-rence, plant cover, soil nutrient status and soil matrix potential (Pinto et al., 2002; Rees et al., 2006; Williams et al., 2009), being generally enhanced by wetting-drying cycles (Davidson et al., 1993; Mills and Fey, 2004; van Haren et al., 2005; Jenerette et al., 15
2008). On an annual base fire might influence the rate of soil CO2efflux by changing
the contribution of live roots to CO2 emissions and by modifying the amount of soil organic matter in the top soil. Burning of grasslands often results in earlier growth of grass in the growing season, which increases dry-matter production (Ojima et al., 1994). Fire management, by maintaining the dominance of grasses over shrubs and 20
trees, increases detritus to the upper soil centimetres, having grasses a shallower root-ing system, compared with shrubs and trees (Ansley et al., 2002). On the other hand, high frequency burning can also lead to a decline in soil C as a result of fire combus-tion of the SOM in the upper few cm of the soil, aboveground biomass and leaf litter (Fynn et al., 2003; Knicker, 2007), hence reducing the source of C for heterotrophic 25
BGD
7, 4089–4126, 2010Fluxes of CO2, CH4 and N2O from
savannah
S. Castaldi et al.
Title Page
Abstract Introduction
Conclusions References
Tables Figures
◭ ◮
◭ ◮
Back Close
Full Screen / Esc
Printer-friendly Version
Interactive Discussion
Discussion
P
a
per
|
Dis
cussion
P
a
per
|
Discussion
P
a
per
|
Discussio
n
P
a
per
for CH4 oxidation. However, most of the available studies on tropical seasonally-dry ecosystems indicate that fire increases the net consumption of CH4 (Castaldi et al.,
2006).
Savannas are generally regarded as modest C sinks (per surface unit area) (Bombelli et al., 2009), and, where fire frequency is high, they are considered to have a almost 5
neutral carbon balance (Saarnak, 2001; Bombelli et al., 2009). High uncertainty is associated to this value due to the lack of sufficient studies which also include the overall balance of GHG in unburned and burned conditions. Data on post burning variations of soil greenhouse gas (GHG) fluxes from savannahs are relatively few and do not give a clear and univocal answer. Few of these studies have been conducted 10
in Africa (Levine et al., 1996; Zepp et al., 1996; Andersson et al., 2004b; Michelsen et al., 2004), while most of them refer to the South American ecosystems (Castaldi et al., 2006).
The present work investigates the impact of fire on post-burning fluxes of CO2,CH4 and N2O from a grassland savannah ecosystem of central-western Africa, with the
15
specific objectives of verifying that: a) burning increases the availability of extractable N substrates and stimulates microbial growth, microbial activity, CO2, N2O and NO production; b) rain events induce gas pulses of CO2and N2O, the length and magnitude
of which is higher in burned areas; c) fire enhances the soil CH4sink.
For this purpose GHG fluxes were measured in the field at different time length from 20
the fire event (1 and 8 months after burning) in burned and control plots manipulated with simulated rain events. Laboratory manipulation experiments of soil water content and temperature were also performed on burned and control soils. The study site was chosen in Congo Brazzaville which is highly representative for this type of ecosystem management. From 60 to 80% of the total land surface of the “Guinea Zone” savannah 25
BGD
7, 4089–4126, 2010Fluxes of CO2, CH4 and N2O from
savannah
S. Castaldi et al.
Title Page
Abstract Introduction
Conclusions References
Tables Figures
◭ ◮
◭ ◮
Back Close
Full Screen / Esc
Printer-friendly Version
Interactive Discussion
Discussion
P
a
per
|
Dis
cussion
P
a
per
|
Discussion
P
a
per
|
Discussio
n
P
a
per
|
2 Materials and methods
2.1 Study site
The research site is located in the littoral region of Congo, close to Tchizalamou (4◦17′20.61′′13 S and 11◦39′22.78′′E, Kouilou district, 82 m a.s.l.). The region is cov-ered by a forest-savannah mosaic lying between the coastline and the Mayombe forest 5
(Favier et al., 2004). The present grass and shrub savannahs result from two inter-acting factors: seasonally-dry climate and expansion of populations practising savan-nah burning. Before Upper Holocene, the open vegetation during dry climate periods was made by open forest or at least tree savannahs (Schwartz et al., 1995). The cli-mate of the Tchizalamou site is a two-season transition equatorial type, characterized 10
by a long cool dry and cloudy season from mid-May to mid-October, followed by a rainy season from mid-October to mid-May. An optional short dry season may occur around mid-February to mid-March. The mean annual rainfall is about 1200 mm pre-cipitation and the annual temperature is about 25◦C, with seasonal variations of ca. 5◦C (Pointe Noire airport meteorological station 1982–2001). The herbaceous layer in
15
savannahs is dominated by taller Poaceae such as Loudetia simplex, Loudetia arund-inacea, or Andropogon shirensis with some occurrence of short Poaceae, Joncaceae and Cyperaceae (e.g., Ctenium newtonii, Bulbostylis laniceps). The Poaceae Loude-tia simplex makes up more than 50% of the aerial biomass of this savannah, which reached about 3.8 Mg ha−1of dry matter at the end of the rainy season (de Grandcourt 20
et al., 2010). Some shrubs of 1–2 m height are present, in particular Annona arenaria (less than 5 ha−1). The soils are Ferralic Arenosols (FAO classification), homogeneous in the landscape in terms of colour (greyish in upper soil layers to ochre in deep lay-ers), texture (the sand content is>85%), structure (always distinctive) chemically poor (CEC<0.5 cmolckg−
1
whatever the soil layer) with a bulk density of 1.43 g cm−3and a 25
BGD
7, 4089–4126, 2010Fluxes of CO2, CH4 and N2O from
savannah
S. Castaldi et al.
Title Page
Abstract Introduction
Conclusions References
Tables Figures
◭ ◮
◭ ◮
Back Close
Full Screen / Esc
Printer-friendly Version
Interactive Discussion
Discussion
P
a
per
|
Dis
cussion
P
a
per
|
Discussion
P
a
per
|
Discussio
n
P
a
per
occur during the short dry season in February. Fires are generally very rapid and su-perficial. No agriculture or cattle breeding are conducted in the grassland. The only human activity is the mushrooms harvest, occurring at the beginning of the wet season.
2.2 Experimental design
Two intensive campaigns were organized at the experimental site, the first starting 5
two weeks after the day of burning (11 June 2007), during the dry season, and the second 8 months after burning, in February 2008. This latter period corresponded to a particularly severe “short dry season”, within a period generally regarded as “wet season”, that extended from mid-January to mid-April. Being the area interested every year by large fires induced by villagers, the plots we used as control cannot be taken as 10
representative of unburned savannah ecosystems, rather they can be used to compare plots which retain their plant cover and litter layer over the year (control) with plots where the plant cover disappears and an input of elements in form of partially of totally uncombusted material gets to the soil (burned). To create this “unburned treatment” a grassland area of about 1/2 hectare was isolated by preventively burning a perimeter 15
of vegetation around it, which avoided flame propagation during the seasonal massive fires.
To simulate dry-wet cycles event, a 20 m2area was rain-shaded with a transparent plastic tent kept a two meters height (to limit sun shading and temperature increase) in each treatment (control and burned) so to ensure a quite low water content before sim-20
ulating a rain event. This was performed as 30 mm of rain which, based on the analysis of rain events at the station from the two previous years, corresponded to typical large rain events. Within each rain-shaded area 3 subplots were watered in different mo-ments before the starting of gas sampling (15, 7, 1 day prior gas sampling) so to have a gradient of soil water contents to follow at the beginning of the gas flux measurement 25
BGD
7, 4089–4126, 2010Fluxes of CO2, CH4 and N2O from
savannah
S. Castaldi et al.
Title Page
Abstract Introduction
Conclusions References
Tables Figures
◭ ◮
◭ ◮
Back Close
Full Screen / Esc
Printer-friendly Version
Interactive Discussion
Discussion
P
a
per
|
Dis
cussion
P
a
per
|
Discussion
P
a
per
|
Discussio
n
P
a
per
|
2.3 Field GHG flux sampling and measurements
CO2, N2O and CH4fluxes were measured from each plot on 4 replicates. To measure
N2O and CH4 fluxes we used closed static chambers (Hutchinson and Mosier, 1981; Smith et al., 1995) made of PVC collars (7 cm high for 31.5 cm diameter) inserted in the soil to about 5 cm depth, in a slot previously formed by a metal cutting ring 5
and chamber lids (20 cm high for 31.5 cm diameter), which were provided with a 2 way stopcock sampling port. To determine N2O and CH4fluxes, gas samples (20 ml)
were withdrawn using Hamilton syringes from the chamber headspace at 0, 20 and 60 min after closure, stored in pre-evacuated glass tight vials and then shipped at the end of the campaign to the DSA-SUN (ITALY) for gas chromatographic analysis. Soil 10
temperature (HI93510 thermometer, Hanna Instruments Canada Inc., Laval, Quebec) and soil water content (ThetaProbe ML2, Delta-T Device Ltd, Cambridge, UK) were measured in correspondence of each chamber at each sampling date.
Soil respiration (Rs) was measured using the Li 8100 soil respiration infrared gas analyzer system with a 8 cm-diameter chamber (LiCor Inc, Lincoln, NE, USA) which 15
was placed on collars (7 cm eight) inserted in the soil to a depth of 5 cm. The increase of the CO2 concentration was measured over an interval of 2 min (including a dead
band of 30 s) starting at the ambient CO2concentration. Soil temperature at 0–40 cm
depth was monitored simultaneously with soil CO2 efflux using a copper/constantan thermocouple penetration probe (Li6000-09 TC, LiCor Inc) in the vicinity of the soil 20
respiration chamber and was used to normalize soil respiration values at 25◦C, using the Arrhenius relation:R(T)=R(25◦)Q
(T−25) 10
10 , with a Q10 value equal to 2.9, as determined
by Epron et al. (2004). This normalization was used to compared the effect of wetting treatments on soil respiration getting independent of the temperature factor. In fact, soil respiration was measured in different hours of the day depending on the daily 25
BGD
7, 4089–4126, 2010Fluxes of CO2, CH4 and N2O from
savannah
S. Castaldi et al.
Title Page
Abstract Introduction
Conclusions References
Tables Figures
◭ ◮
◭ ◮
Back Close
Full Screen / Esc
Printer-friendly Version
Interactive Discussion
Discussion
P
a
per
|
Dis
cussion
P
a
per
|
Discussion
P
a
per
|
Discussio
n
P
a
per
location.
All gases were measured at least 5 times within 2 weeks from all the treatments (unburned, burned x control, and 3 different timing of water addition).
2.4 Soil sampling
Soil was sampled at 0–10 cm depth at the end of the two campaign periods from un-5
burned and burned control plots (unwatered) by taking 4 soil cores from each plots. Soil was immediately sieved (2 mm mesh) air dried (2 day max required) and shipped to the department of environmental sciences (DSA-SUN, Italy) and CEH UK for subsequent analyses.
2.5 Laboratory incubations
10
Two laboratory experiments were set up. The first (at DSA-SUN, Italy) aimed at in-vestigating the effect of burning on temperature and water content responses of N2O
and CO2 fluxes, as well as some related microbial parameters (net N mineralization, net nitrification, microbial biomass). For this purpose 50 g of sieved soil samples were repacked into columns (10 cm height, 5.5 cm inner diameter) which were incubated 15
in half litre conic flasks (on triplicate). Soils were incubated for 15 days at 0, 25%, 50%, 100% of water saturation (33% for burned and 37% for unburned soil measured on repacked sieved soil columns) and at two temperatures (25◦C and 37◦C) in ther-mostated cells. In order to observe the pulse effect of water addition on dry soil no pre-incubation was made. Flask were kept open and losses of water were corrected 20
everyday by gravimetrical determination. Gas fluxes were measured on days 0, 1, 3, 10 and 15, by closing the flask with air tight lid and sampling gas at t0 and after 24 h. At the beginning and at the end of the incubation (15 days) soil mineral N was deter-mined to quantify mineralization and nitrification net rates, soil microbial biomass was quantified at the end of the experiment.
BGD
7, 4089–4126, 2010Fluxes of CO2, CH4 and N2O from
savannah
S. Castaldi et al.
Title Page
Abstract Introduction
Conclusions References
Tables Figures
◭ ◮
◭ ◮
Back Close
Full Screen / Esc
Printer-friendly Version
Interactive Discussion
Discussion
P
a
per
|
Dis
cussion
P
a
per
|
Discussion
P
a
per
|
Discussio
n
P
a
per
|
For the second incubation experiment (at Centre for Ecology and Hydrology, Edin-burgh) sieved soil samples (100 g on triplicate) repacked into clear Perspex columns (20 cm height, 5.5 cm inner diameter) were incubated at 25◦C at 10% and 50% of water saturation. NO emissions were measured atT0 and 1 h, 5 days and 7 days after wa-ter addition, using a gas flow-trough system described in details by Dick et al. (2001). 5
NO was analysed by chemiluminescence (42C model, Thermo-Environmental Instru-ment) and O3by UV absorption (427 model, Thermo-Environmental Instrument). N2O fluxes were determined in the same day (30 min after NO flux determination) closing the columns for 30 min and sampling 20 ml of gas from the column headspace atT0
and T30 min. N2O concentration in the samples was determined by gas chromatog-10
raphy. Soil cores were left uncapped in between gas sampling events and losses of water were corrected everyday by gravimetrical determination
2.6 Analytical technique
Soil mineral N was extracted with 0.5 M K2SO4 (1:4 soil extractant v/v) and filtered with Wathmann filter no. 42. NH+4 and NO−3 were then determined on extracts by 15
potenziometric analysis using specific electrodes for NH+4 (Model Orion 9512) and NO−3 (Model Orion 9707). Soil water saturation was determined gravimetrically on repacked soil column using sieved soil. Soil total carbon and nitrogen content were determined on homogenized soil sample by flash combustion-gas chromatography on a NCS-soil Thermo FlashEA 1112. Net N mineralization and net nitrification rates, 20
over 15 days, were calculated as the difference between the mineral N (NH+4+NO−3) or the sole NO−3, respectively, measured after 15 days of incubation and that measured at time zero. Spectrophotometric ninhydrin method, developed by Moore and Stein (1954), was used to quantify theα-amino-N present in soil extracts (soil: extract 1:5) using 0.5 M K2SO4. This techniques allow to quantify soluble proteins, aminoacids and 25
BGD
7, 4089–4126, 2010Fluxes of CO2, CH4 and N2O from
savannah
S. Castaldi et al.
Title Page
Abstract Introduction
Conclusions References
Tables Figures
◭ ◮
◭ ◮
Back Close
Full Screen / Esc
Printer-friendly Version
Interactive Discussion
Discussion
P
a
per
|
Dis
cussion
P
a
per
|
Discussion
P
a
per
|
Discussio
n
P
a
per
fraction of the cell constituents made available by the fumigation was extracted shak-ing the soil with 20 ml of 0.5 M K2SO4 for 1 h and filtering the suspension with paper filter (Whatman no. 42). The ninhydrin-N deriving from the biomass was calculated as the ninhydrin-N of the fumigated samples minus the ninhydrin-N of the unfumigated samples. From the value obtained it is possible to calculate biomass N using a conver-5
sion factor of 62 (Ocio and Brookes, 1990).
CH4, N2O and CO2determination on field and laboratory gas samples carried on at
DSA-SUN were made using a gas chromatograph (Fison series 800) equipped with an electron capture detector (ECD) maintained at 280◦C and a flame ionization detector (FID) set up to analyse the three gases on the same 2 ml sample, using as well a 10
fronthflush and a backflush system (Castaldi et al., 2004). Column and precolumn were stainless steel packed with Porapak Q, both maintained at 60◦C. N2was used as
carrier gas (flow rate 40 cm3min−1). The injection port was provided with a 2 ml loop. N2O analysis at CEH were done using a gas chromatograph (Hewlett Packard, 5890) equipped with an electron capture detector kept a 350◦C, columns were stainless steel 15
packed with Porapak Q (oven 50◦C) and Ar/CH4 was used as carrier at a flow rate of
40 ml min−1.
2.7 Statistical analyses
As the same sites were sampled over consequent days, a two-way “repeated measure-ments” analysis of variance (ANOVA) was used to determine differences of gas fluxes, 20
considering treatment and season as sources of variation of gas fluxes. When the dif-ference was significant (P <0.05) an “all pairwise” comparison was carried out using the “Student Newman-Keul test”. When normality test failed a Kruskal-Wallis ANOVA on ranks was performed. Simple linear regressions, multiple linear regression and non-linear regression analysis were performed to find the relationship between independent 25
BGD
7, 4089–4126, 2010Fluxes of CO2, CH4 and N2O from
savannah
S. Castaldi et al.
Title Page
Abstract Introduction
Conclusions References
Tables Figures
◭ ◮
◭ ◮
Back Close
Full Screen / Esc
Printer-friendly Version
Interactive Discussion
Discussion
P
a
per
|
Dis
cussion
P
a
per
|
Discussion
P
a
per
|
Discussio
n
P
a
per
|
3 Results
3.1 Soil parameters
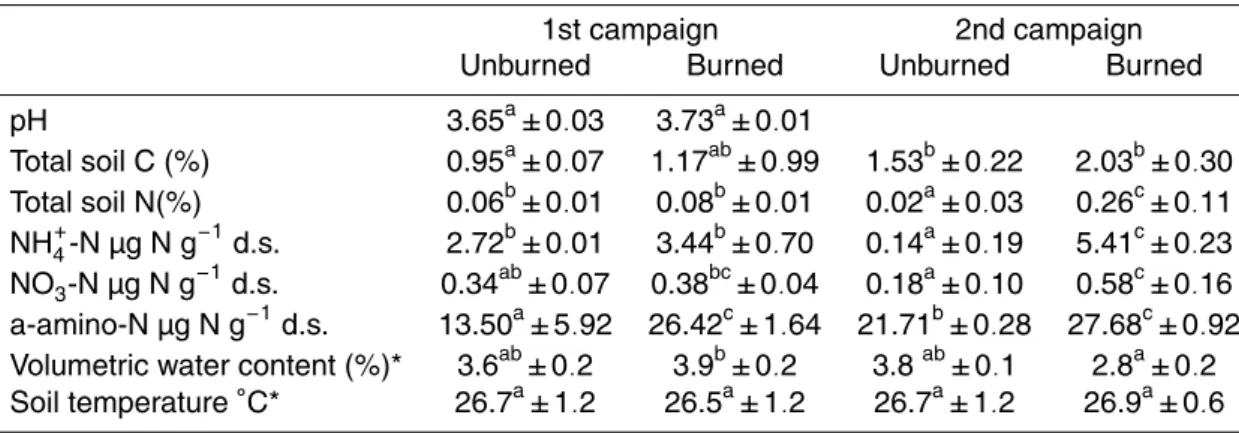
The analysed soil was characterized by a quite acid pH, slightly higher in the burned plots, and low content of total C and N (Table 1). Total C increased in both treatments after 8 months but no significant difference was observed between burned and un-5
burned plots. Total N was significantly higher after 8 months in the burned plots, on the contrary one month after burning it was equally low in both treatments (Table 1). NH+4 -N was the dominant form of soil mineral -N in both sampling campaigns (Table 1), and it was slightly higher in the burned plots (Table 1). The soil content of extractable organic N measured asα-amino-N (aminoacids, peptides, proteins, etc) was much higher than 10
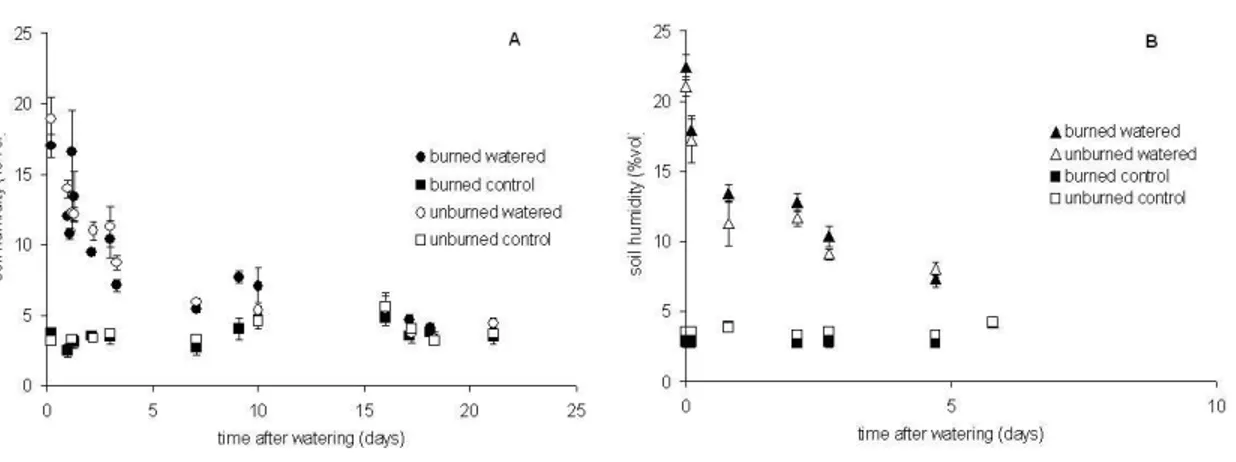
mineral N in both sampling periods, and it was significantly higher in burned plots (Ta-ble 1). The average soil water content (mean of five sampling days over 2 weeks of campaign) measured in the un-watered plots was extremely low during both campaigns and, as also observed for soil temperature, it did not change significantly between treat-ments (Table 1, Fig. 1). The presence of the rain-shading tent did not seem to influence 15
soil conditions as in fact both soil water content and temperature measured in the un-watered plots outside the tent were not significantly different from those measured in the unwatered control under the tent, in both seasons (data not shown).
When the rain event was simulated, the maximum volumetric water content obtained within 5 h after water addition was about 19.7±0.79% during the first campaign and 20
23,5±0.92% during the second campaign in the upper 5 soil centimetres (Fig. 1), which corresponded to a water filled pore spaces of 42.8% for the first campaign and 51.0% for the second campaign. Soil water content decreased rapidly after water addition, go-ing back to values comparable to control plots within 10 days durgo-ing the first campaign and 7 days for the second campaign (Fig. 1) with no significant differences between 25
BGD
7, 4089–4126, 2010Fluxes of CO2, CH4 and N2O from
savannah
S. Castaldi et al.
Title Page
Abstract Introduction
Conclusions References
Tables Figures
◭ ◮
◭ ◮
Back Close
Full Screen / Esc
Printer-friendly Version
Interactive Discussion
Discussion
P
a
per
|
Dis
cussion
P
a
per
|
Discussion
P
a
per
|
Discussio
n
P
a
per
3.2 Soil respiration
As no difference between CO2effluxes measured from unwatered controls outside and
under the rain-shading tent was found, average soil respiration daily fluxes were calcu-lated using all the replicates from unwatered plots. The average daily soil respiration, calculated from 12 days of measurements in the 1st campaign and 6 days during the 5
2nd campaign, was 7732.1±316.1 mg of CO2m− 2
day−1(unburned) and 5478.3±101.3 (burned) mg of CO2 m−2day−1, in the 1st campaign and 11797.6
±905.7 mg of CO2
m−2day−1(unburned) and 12663.5±1711.1 (burned) mg of CO2m− 2
day−1, during the second campaign. The increase of soil respiration observed in the 2nd campaign for both treatments was statistically significant (P <0,05 two-way ANOVA). Only in the 10
1st campaign the difference between treatments was statistically significant (P <0.05 Two-way ANOVA). To compare the effect of watering on soil respiration in burned and unburned plots, being independent from the effect of soil temperature on CO2 emis-sions, these were normalized at 25◦C, as described in the method section. Watering induced a pulse of CO2emissions which had its maximum in the first day after water
15
addition and decreased with a trend comparable to that observed for soil water con-tent (Figs. 1 and 2), getting back to control (unwatered) levels within 10 days and 7 days in the 1st and 2nd campaign, respectively. On a daily base CO2 emissions from
unburned watered plots were usually significantly higher than emissions from burned watered plots during the first campaign (Fig. 2a). The maximum soil respiration val-20
ues induced by watering were just slightly higher in the second campaign, for both treatments.
The normalized soil respiration increased linearly with the increase of soil water filled pores space (WFPS) in both campaigns (Fig. 3). The rate of increase (see equa-tions reported in the Fig. 3) was similar in the two treatments one month after burning, 25
BGD
7, 4089–4126, 2010Fluxes of CO2, CH4 and N2O from
savannah
S. Castaldi et al.
Title Page
Abstract Introduction
Conclusions References
Tables Figures
◭ ◮
◭ ◮
Back Close
Full Screen / Esc
Printer-friendly Version
Interactive Discussion
Discussion
P
a
per
|
Dis
cussion
P
a
per
|
Discussion
P
a
per
|
Discussio
n
P
a
per
|
treatment (Fig. 3). The rate of increase per unit of soil water content was slower compared with the first campaign, although the intercept was higher. No significant difference was observed between the frequency distribution of soil respiration values for unburned and burned treatments in both campaigns, and data were normally dis-tributed (Kolmogorov-Smirnov test).
5
3.3 Methane fluxes
The average CH4flux calculated from control (unwatered) plots, also in this case using
average daily fluxes from both control outside and inside the tent (no statistical diff er-ence, Two-way ANOVA, P >0.05), resulted in a net emission in the unburned plots (0.70±0.62 mg CH4 m−
2
day−1) and in a net, although weak, sink in the burned plots 10
(−0.34±0.27 mg CH4 m− 2
day−1) one month after burning (1st campaign). The diff er-ence was statistically significant (P <0.05). In the second campaign the site acted as a weak net CH4 sink in both unburned (−0.40±0.57 mg CH4 m−
2
day−1) and burned (−0.75±0.75 mg CH4 m−
2
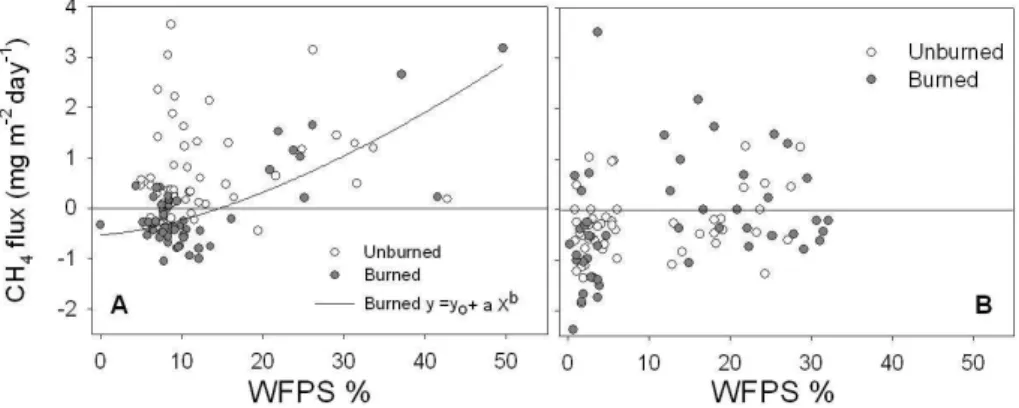
day−1) plots, having this time no significant difference be-tween treatments. Fluxes showed an elevated variability (Fig. 4). A significant diff er-15
ence in the distribution of CH4 fluxes among size classes was observed for the two treatments one month after burning (Fig. 4). In fact, a significant reduction in the fre-quency of fluxes above 0.80 mg CH4m−
2
day−1, and an increase of fluxes below 0 mg CH4 m−2day−1 was observed in the burned plots (Fig. 4). Eight months after burning
the frequency distributions in the two treatments were similar (Fig. 4). Analysing the 20
relationship between soil water content and CH4fluxes obtained including the watered
plots (Fig. 5) it can be observed that in the 1st month after burning most of the fluxes were positive (net emission) in the unburned plots and negative (net consumption) in the burned plots for values of WFPS below 15% (6.9% vol. water content). Above this threshold most of the measured fluxes were positive in both treatments. In the second 25
BGD
7, 4089–4126, 2010Fluxes of CO2, CH4 and N2O from
savannah
S. Castaldi et al.
Title Page
Abstract Introduction
Conclusions References
Tables Figures
◭ ◮
◭ ◮
Back Close
Full Screen / Esc
Printer-friendly Version
Interactive Discussion
Discussion
P
a
per
|
Dis
cussion
P
a
per
|
Discussion
P
a
per
|
Discussio
n
P
a
per
as observed in the previous campaign, although above 10% of WFPS the frequency of positive fluxes increased (Fig. 5).
3.4 Nitrous oxide fluxes
Nitrous oxide fluxes were quite low, and in the second campaign many of the an-alyzed fluxes were below the detection limit of the used technique (0.7 µg of N2O 5
m−2
h−1
for single flux measurement), which were hence assigned a value of zero. The daily average N2O flux, calculated from 5 days of measurements in both
cam-paigns, was 0.02±0.13 mg of N2O m− 2
day−1 in unburned (range −0.7 to 0.6) and 0.02±0.10 mg of N2O m−
2
day−1in burned plots (range−0.4 to 0.5) in the 1st campaign and−0.03±0.11 mg of N2O m−
2
day−1in unburned (range
−0.6 to 0.0) and 0.0±0.4 mg 10
of N2O m− 2
day−1in burned plots (range−0.1 to 0.2) during the 2nd campaign. A slight shift of flux frequency distribution toward more positive (emission) fluxes was observed in burned plots, compared with unburned ones (Fig. 6), however the average flux in the two treatments was not significantly different (Table 2). Water addition did not produced any detectable increase of N2O emissions (data not shown) neither in unburned or in
15
burned plots.
3.5 Laboratory incubations
The 92% of N2O production in the first incubation experiment occurred within the first
day after water addition, thereafter fluxes decreased exponentially within 2 days (data not shown). N2O emission was significantly stimulated by burning but the difference 20
with unburned plots could be appreciated only above 50% of water saturation (WS) (corresponding to about 75% of water holding capacity) (Fig. 7). In fact, fluxes of N2O
raised exponentially with increasing water content, faster in the burned plots (Fig. 7, insert). No significant effect of rising temperature from 25◦C to 37◦C was instead
observed even at saturation. The pulse of CO2peaked the first day after water addition.
25
BGD
7, 4089–4126, 2010Fluxes of CO2, CH4 and N2O from
savannah
S. Castaldi et al.
Title Page
Abstract Introduction
Conclusions References
Tables Figures
◭ ◮
◭ ◮
Back Close
Full Screen / Esc
Printer-friendly Version
Interactive Discussion
Discussion
P
a
per
|
Dis
cussion
P
a
per
|
Discussion
P
a
per
|
Discussio
n
P
a
per
|
days. At the end of the incubation (day 15), CO2emissions from watered plots (25, 50 and 100% of WS) were still significantly higher than CO2 emissions from unwatered
(0% WS) soil (data not shown). Figure 7, which reports the cumulative CO2measured
at day 1, 2, 3, 4, 5, 7 and 15 of incubation, shows that respiration was significantly stimulated by water addition at 25% of WS (40% of water holding capacity) and further 5
water addition did not change significantly the rate of CO2production. The increase of
incubation temperature from 25◦C to 37◦C stimulated significantly CO2production. At 25◦C the effect of burning on soil CO2 emission was not significant, whereas at 37◦C
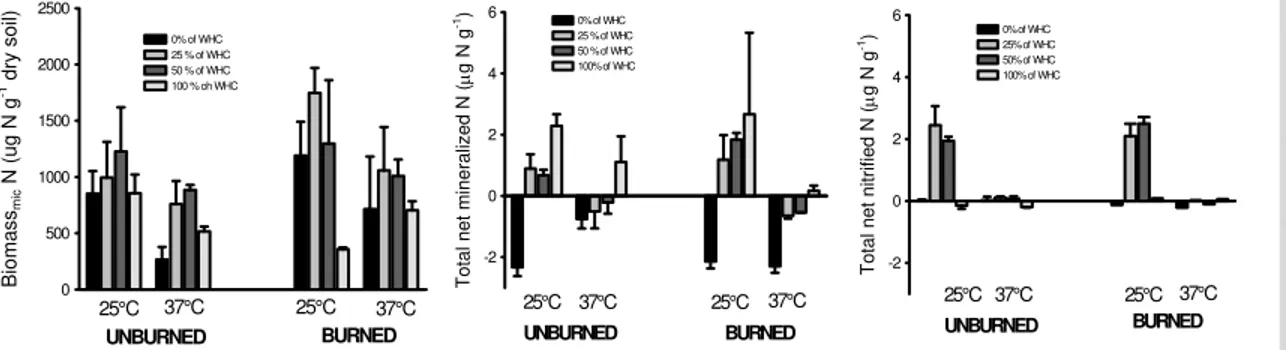
soil respiration was significantly higher in the burned watered soil (Fig. 7). Microbial biomass N, net N mineralization and net nitrification were lower at 37◦C than at 25◦C 10
(Fig. 8). Net nitrification was almost completely blocked at all tested soil water contents at 37◦C. At 25◦C both nitrification and microbial biomass showed a maximum between 25 and 50% of WS, whereas 100% of WS reduced biomass growth and blocked net nitrification. Net N mineralization increased similarly to N2O production for increasing soil water content up to 100% of WS (Figs. 7, 8). The effect of burning was in most 15
cases not significant although values of microbial biomass N were slightly higher in the burned plots. Burning significantly increased the potential of soil NO emission, which was significantly higher at 10% of WS compared with 50% WS (Fig. 9). The NO pulse induced by water addition (zero flux at time zero, 1 h before watering, data not shown) was significantly reduced already after 5 days of incubation and at all sampling times 20
NO emissions were the dominant form of N gas measured. In fact at 10% WS no N2O production was detected whereas at 50% of WS N2O emissions never exceeded
BGD
7, 4089–4126, 2010Fluxes of CO2, CH4 and N2O from
savannah
S. Castaldi et al.
Title Page
Abstract Introduction
Conclusions References
Tables Figures
◭ ◮
◭ ◮
Back Close
Full Screen / Esc
Printer-friendly Version
Interactive Discussion
Discussion
P
a
per
|
Dis
cussion
P
a
per
|
Discussion
P
a
per
|
Discussio
n
P
a
per
4 Discussion
4.1 Soil respiration
Data indicate that fire had some transient effect on one or both the components of soil respiration, microbial activity (heterotrophic component) and root respiration (au-totrophic component) (Singh and Gupta, 1977). Burned plots emitted significantly less 5
CO2 than unburned plots during the 1st campaign (one month after burning, dry sea-son) but this difference was not detectable any longer in the 2nd campaign (growing season). The clearest effect of fire was the immediate disappearance of the above-ground vegetation, which despite being partially dry due to the strong water limitation, had still about 20% of green biomass. This was most probably supporting the main-10
tenance activity of roots of these perennial grass species, rather than growth, which typically stops during the driest period of the year, as demonstrated by ingrowth core methodology (de Grandcourt et al., 2010). Hence, fire might have partially reduced this source of soil respiration by destroying the remaining active photosynthetic tis-sues. Fire also consumed most of the litter, which in these grasslands typically dries 15
out as aerial litter before falling on the ground. This litter would represent a source of C for microbial respiration during the decomposition process. One sole season of fire exclusion was not sufficient to vary significantly the soil content of total C in the unburned plots, compared with the burned plots, on the contrary a higher content of extractableα-amino-N products was found in the burned soil 1 month after fire. An-20
dersson et al. (2004) reported an increase of dissolved organic C in savannah soils immediately after burning, which he suggested might in part include low molecular weight compounds released from the microbial biomass killed by heating, generally including also peptides and proteins. Laboratory soil analyses showed that in very dry soil (no water addition) microbial biomass still persisted after more than a month from 25
BGD
7, 4089–4126, 2010Fluxes of CO2, CH4 and N2O from
savannah
S. Castaldi et al.
Title Page
Abstract Introduction
Conclusions References
Tables Figures
◭ ◮
◭ ◮
Back Close
Full Screen / Esc
Printer-friendly Version
Interactive Discussion
Discussion
P
a
per
|
Dis
cussion
P
a
per
|
Discussion
P
a
per
|
Discussio
n
P
a
per
|
in the field. The similar rate of increase of CO2emissions in function of increasing soil water content observed in the burned and unburned plots (field data), despite the very different condition of plant cover (20% of active plant standing tissue still present in unburned plots), suggests that soil microbial activity might be the main contributor to the enhanced CO2efflux induced by water addition, whereas the extra CO2flux
occur-5
ring in the unburned plots at all water contents (higher intercept with y-axis) might be due to root respiration. However, our experimental design did not allow for a conclu-sive partitioning of the CO2flux between autotrophic and heterotrophic sources. Both
laboratory and field data showed that around 10 days were necessary to extinguish the CO2 pulse generated by water addition in the dry season and that the maximum 10
emission occurred within a day after water addition. Several authors reported quick response of the ecosystem respiration to a rain pulse in dry conditions (Jenerette et al., 2008; Xu and Baldocchi, 2004; Williams et al., 2009), but the pulse was generally ending within one to three days. In the second campaign the pulse peak was compa-rable to that obtained in the first campaign, although the pulse lifetime was shorter (7 15
days) and the background (unwatered) rate of soil respiration was higher. No signifi-cant difference was evidenced in this second campaign between burned and unburned plots. At this time of the year both treatments presented similar plant cover density and grass height. The higher biomass corresponded also to higher soil total C andα-amino N content, probably reflecting the increase of C in the soil associated to root growth, 20
turnover and exudation. These might have stimulated microbial growth and activity resulting in higher rates of soil respiration but also a faster consuming of substrates made available by water addition to the dry soil in the second campaign (shorted pulse lifetime). Clearly also the autotrophic component contributed significantly to the CO2
efflux during the growing period. 25
Overall the impact of burning on CO2 emissions in the present experiment seemed not relevant in terms of stimulation of CO2 losses from the soil. On the contrary fire
BGD
7, 4089–4126, 2010Fluxes of CO2, CH4 and N2O from
savannah
S. Castaldi et al.
Title Page
Abstract Introduction
Conclusions References
Tables Figures
◭ ◮
◭ ◮
Back Close
Full Screen / Esc
Printer-friendly Version
Interactive Discussion
Discussion
P
a
per
|
Dis
cussion
P
a
per
|
Discussion
P
a
per
|
Discussio
n
P
a
per
savannahs showed no difference in Nigeria, Venezuela and South Africa (Adedeji, 1983; Hao et al., 1988; Zepp et al., 1996) or a slight stimulating effect in Brazilian cerrado, but only after wetting the soil (Poth et al., 1995). Michelsen et al. (2004) found higher soil respiration in forest and woodland subject to sporadic burning compared with frequently burnt grasslands. Similarly to the results found in the present grass-5
land, lower soil respiration rates were found in burned grassland savannah areas in Ethiopia compared with unburned areas (Andersson et al., 2004).
4.2 Methane fluxes
The very low water content of the soil at the time of measurement, and its loose struc-ture, mainly dominated by sand, should create favourable conditions for significant 10
methanotrophic activity (Striegl et al., 1992; Potter et al., 1996; Castaldi and Fierro, 2005; Castaldi et al., 2006). However, data showed that the unburned grassland plots were a CH4source rather than a good sink. Similar results were previously reported
for some tropical ecosystems (Hao et al., 1988; Poth et al., 1995; Scharffe et al., 1990; Sanhueza et al., 1994; Zepp et al., 1996: Castaldi et al., 2004; Br ¨ummer et al., 2009). 15
Net CH4emissions were observed even at 7% of WFPS, hence at very dry conditions,
which makes quite unlikely that this CH4source might derive from anaerobic hotspots of microbial activity, as hypothesised in other studies (Castaldi et al., 2004; Verchot et al., 2000). A more probable source of CH4 might be represented by termite activity,
also considering that site presented a very high frequency of termite nests. Care was 20
taken at the moment of sampling to keep distant from termite nests, however termite activity can occur several meters far from the nest, and the pattern of this source can-not be easily predicted. Fire reduced significantly the frequency of net CH4emissions,
and this was particularly evident in the first campaign, immediately after burning. We could hypothesise that fire temporarily reduced termite activity outside the nest. In-25
deed even CH4production inside the termite nests was significantly reduced in the first
BGD
7, 4089–4126, 2010Fluxes of CO2, CH4 and N2O from
savannah
S. Castaldi et al.
Title Page
Abstract Introduction
Conclusions References
Tables Figures
◭ ◮
◭ ◮
Back Close
Full Screen / Esc
Printer-friendly Version
Interactive Discussion
Discussion
P
a
per
|
Dis
cussion
P
a
per
|
Discussion
P
a
per
|
Discussio
n
P
a
per
|
differences in the burned and unburned plots, although fluxes were on average lower (more negative), compared with the previous dry season, probably as a consequence of the drier conditions which might have slowed termite activity overall and also facil-itated CH4 uptake in the deeper soil layers (Striegl et al., 1992; Castaldi and Fierro,
2005). Other authors have evidenced that clearance of savannah soil surface (grasses 5
and litter) by burning produces a significant reduction of the methane production from the soil-grass system (Poth et al., 1995; Zepp et al., 1996). Indeed, destroying most of the litter, burning reduces that amount of palatable substrate that termites can use, ei-ther directly as litter or as SOM. Soil-feeding termites as those belonging to the genus Cubitermes or those feeding on litter such as Nasutitermes, both found at the site, 10
would be affected by substrate reduction consequent to fire.
4.3 Nitrous oxide emissions
The analysed savannah ecosystem showed extremely low N2O fluxes, as also found in
previous studies in savannas characterized by acidic and nutrient poor soils (Scholes et al., 1997; Andersson et al., 2004a, b; Castaldi et al., 2006). In general the range of 15
fluxes measured in undisturbed savanna ecosystems is quite narrow, going from small uptake values to few mg N2O-N m−
2
day−1(Castaldi et al., 2006) except if soil receives significant amount of fertilizer (Br ¨ummer et al., 2008). Higher fluxes from undisturbed savannahs have been only measured in isolated patches of nutrient rich savannas in nutrient poor soils (Otter and Scholes, 2000) or savannas located in valleys character-20
ized by higher soil water retention and accumulation of organic matter (Sanhueza et al., 1990). Higher N2O fluxes in seasonally dry tropical environment are reported only for
forests (Sanhueza et al., 1990; Verchot et al., 1999; Castaldi et al., 2006). A combina-tion of environmental factors concur to keep N2O fluxes low: good soil drainage, low pH and low nutrient status (Castaldi et al., 2006), as reported in the present study. During 25
BGD
7, 4089–4126, 2010Fluxes of CO2, CH4 and N2O from
savannah
S. Castaldi et al.
Title Page
Abstract Introduction
Conclusions References
Tables Figures
◭ ◮
◭ ◮
Back Close
Full Screen / Esc
Printer-friendly Version
Interactive Discussion
Discussion
P
a
per
|
Dis
cussion
P
a
per
|
Discussion
P
a
per
|
Discussio
n
P
a
per
water filled pore space (WFPS %) was always below 51%, even immediately after a big rain event simulation. This WFPS value is below the value at which O2diffusion is
suf-ficiently reduced to allow for a sharp increase of N2O production (Davidson, 1991). In
fact, N2O production by denitrification generally increases exponentially between 60% and 90% of WFPS, but also N2O production by nitrifiers improves as soil water
con-5
tent increases and aeration becomes restricted, with optimum values around 60% of WFPS (Davidson, 1991). Coherently with these results, the rain simulation at our site did not allow to observe a significant increase of N2O emissions. Equally, laboratory
incubations demonstrated that only above 75% of WS the increase of N2O production
was sharper. This value cannot be compared directly with field WFPS but gives an 10
indication that the water content required to induce significant N2O production is cer-tainly higher than that required to stimulate significantly CO2 production. However, a
second limiting factor for N2O production in these environments is represented by the
very low contents of soil C and N, in particular N in the form of mineral N. During the dry season mineralization and nitrification activity might concur quite little to produced 15
significant amounts of available mineral N, as demonstrated by laboratory data. When soil water content increases, during the wet season, the most intense mineralization activity would probably coincides with resprouting of shrubs and growth of herbaceous plants making the competition for N quite high (Bate, 1981). Burning grasslands often results in grass growth earlier in the growing season, (Ojima et al., 1994), which might 20
enhance the competing effect of plant with microbes at the onset of the rainy season, when pulses of N2O might occur with higher frequency.
Laboratory data showed that significant losses of NO could occur after smaller rain events (low soil water content) and that burning triplicated the emission measured in the control. The flush was much higher at water contents below 10% of WS, but most of the 25
BGD
7, 4089–4126, 2010Fluxes of CO2, CH4 and N2O from
savannah
S. Castaldi et al.
Title Page
Abstract Introduction
Conclusions References
Tables Figures
◭ ◮
◭ ◮
Back Close
Full Screen / Esc
Printer-friendly Version
Interactive Discussion
Discussion
P
a
per
|
Dis
cussion
P
a
per
|
Discussion
P
a
per
|
Discussio
n
P
a
per
|
the amount of mineral N was quite high compared with our study, where N could have been an important limiting factor for NO and N2O emissions. Hence data suggest that the occurrence of burning in savannahs ecosystems such the one investigated in this study might lead mostly to have an increase of NO production but no or little N2O
production, as previously reported by Levine et al. (1996) and Johansson et al. (1988). 5
Fast spreading fires, such as those occurring in grassland savannahs, do not seem to affect, on the other hand, microbial biomass and activity involved in N transformations. Higher N2O emissions following burning might be expected only in clay reach and poorly drained soil following a rain event which might allow for transient saturation of soil pores.
10
5 Conclusions
Burning increased the soil availability of extractable N, both as mineral N and organic compounds containing amino groups. This might have lead to increased N2O
produc-tion in burned soils if enough water might have been retained in the soil during rain events, as shown by lab data. However field observation indicated that this condition 15
never occurred in the field, so that no appreciable effect of fire on N2O fluxes could be
observed. Rain simulation stimulated a significant CO2 pulse, which lasted up to 10 days in the dry season. The slightly stimulating effect of burning on microbial growth and activity, as observed in the lab, was probably balanced by the negative effect of fire on the autotrophic component of soil respiration, so that overall the burned soils 20
tended to respire less even after water addition. The studied soil was not a CH4 sink
as expected on the base of soil and climatic characteristics, and during at least part of the year, it acted as a slight CH4source, even at very dry conditions, however, fire shifted the CH4source/sink towards more negative values (consumption).
Overall data indicate that fire might reduce the GHG emissions into the atmo-25
BGD
7, 4089–4126, 2010Fluxes of CO2, CH4 and N2O from
savannah
S. Castaldi et al.
Title Page
Abstract Introduction
Conclusions References
Tables Figures
◭ ◮
◭ ◮
Back Close
Full Screen / Esc
Printer-friendly Version
Interactive Discussion
Discussion
P
a
per
|
Dis
cussion
P
a
per
|
Discussion
P
a
per
|
Discussio
n
P
a
per
The only significant contribution to enhanced release of GHG gases at burned sites might hence derive by N2O and CH4emissions produced during the flaming and
smoul-dering phase of burning.
Acknowledgements. Financial support for this scientific research came from the European
Commission, which has been funding the project “CarboAfrica” (GOCE, 037132) under the
5
VI Framework Programme (FP6). Analysis at CEH were supported by an EU Accent-Biaflux grant.
References
Andersson, M., Michelsen, A., Jensen, M., and Kjoller, A.: Tropical savannah woodland: effects
of experimental fire on soil microorganisms and soil emissions of carbon dioxide, Soil Biol.
10
Biochem., 36, 849–858, 2004a.
Andersson, M., Michelsen, A., Jensen, M., Kjoller, A., and Gashew, M.: Carbon stock, soil res-piration and microbial biomass in fire-prone tropical grassland, woodland and forest ecosys-tems, Soil Biol. Biochem., 36, 1707–1717, 2004b.
Ansley, R. J., Dugas, W. A., Heuer, M. L., and Kramp, B. A.: Bowen ratio/energy balance
15
and scaled leaf measurements of CO2flux over burned Prosopsis savanna, Ecol. Appl., 12,
948–961, 2002.
Bate, G. C.: Nitrogen cycling in savanna ecosystems, edited by: Clark, F. E. and Rosswall, T., Terrestrial Nitrogen Cycles, Ecological Bulletin (Stockholm), 33, 463–475, 1981.
Bombelli, A., Henry, M., Castaldi, S., Adu-Bredu, S., Arneth, A., de Grandcourt, A., Grieco, E.,
20
Kutsch, W. L., Lehsten, V., Rasile, A., Reichstein, M., Tansey, K., Weber, U., and Valentini, R.: An outlook on the Sub-Saharan Africa carbon balance, Biogeosciences, 6, 2193–2205, doi:10.5194/bg-6-2193-2009, 2009.
Bond, W. J.: What Limits Trees in C4 Grasslands and Savannas?, Annu. Rev. Ecol. Evol. S., 39, 641–659, 2008,
25
Bothma, J. and Du, P.: Game counts, editd by: Du, P. and Bothma, J., Game RanchManage-ment, National Book Printers, Western Cape, 1996.
Breuer, L., Papen, H., and Butterbach-Bahl, K.: N2O emission from tropical forest soils of
BGD
7, 4089–4126, 2010Fluxes of CO2, CH4 and N2O from
savannah
S. Castaldi et al.
Title Page
Abstract Introduction
Conclusions References
Tables Figures
◭ ◮
◭ ◮
Back Close
Full Screen / Esc
Printer-friendly Version
Interactive Discussion
Discussion
P
a
per
|
Dis
cussion
P
a
per
|
Discussion
P
a
per
|
Discussio
n
P
a
per
|
Br ¨ummer, C., Br ¨uggemann, N., Butterbach-Bahl, K., Falk, U., Szarzynski, J., Vielhauer, K.,
Wassmann, R., and Papen, H.: Soil-Atmosphere Exchange of N2O and NO in Near-Natural
Savanna and Agricultural Land in Burkina Faso (W. Africa), Ecosystems, 11, 582–600, 2008.
Br ¨ummer, C., Papen, H., Wassmann, R., and Br ¨uggemann, N.: Fluxes of CH4 and CO2from
soil and termite mounds in south Sudanian savanna of Burkina Faso (West Africa), Global
5
Biogeochem. Cycles, 23, GB1001, doi:10.1029/2008GB003237, 2009.
Butterbach-Bahl, K., Kock, M., Willibald, G., Hewett, B., Buhagiar, S., Papen, H., and Kiese, R.: Temporal variations of fluxes of NO, NO2, N2O, CO2, and CH4 in a tropical rain forest ecosystem, Global Geochem. Cycles, 18, GB3012, doi:10.1029/2004GB002243, 2004.
Castaldi, S., Ermice, A., and Strumia, S.: Fluxes of N2O and CH4from soils of savannas and
10
seasonally-dry ecosystems, J. Biogeogr., 33, 401–415, 2006.
Castaldi, S. and Fierro, A.: Soil-atmosphere methane exchange in undisturbed and burned Mediterranean shrubland of Southern Italy, Ecosystems, 8(2), 182–190, 2005.
Castaldi, S., De Pascale, R. A., Grace, J., Montes, R., and SanJos ´e, J.: Nitrous oxide and
Methane fluxes from soil of Orinoco savanna under different land use, Global Change Biol.,
15
10, 1947–1960. 2004.
Castaldi, S. and Aragosta, D.: Factors influencing nitrification and denitrification variability in a natural and fire disturbed Mediterranean shrubland, Soil Biol. Fertil., 36, 418–425, 2002.
Castaldi, S. and de Grandcourt A.: CH4fluxes from termite activity in African grassland savanna
and its influence on the CH4flux budget at site, in preparation, 2010.
20
Christensen, N. L.: Fire and the nitrogen cycle in California chaparral, Science, 181, 66–68, 1973.
Davidson, E. A.: Fluxes of nitrous oxide and nitric oxide from terrestrial ecosystems, edited by: Rogers, J. E. and Whitman, W. B., Microbial production and consumption of greenhouse gases: Methane, nitrogen oxides and halomethanes, pp. 219–235, American Society for
25
Microbiology, Washington, D.C., 1991.
Davidson, E. A., Matson, P. A., Vitousek, P. M., Riley, R., Dunkin, K., Garcia-Mendez, G.,
Maass, J. M.: Processes regulating soil emission of NO and N2O in a seasonally dry tropical
forest, Ecology, 74, 130–139, 1993.
de Grandcourt, A., Thongo Mbou, A., Kinana, A., Ngoyi, S., Minzele, C., Caquet, B., Nouvellon,
30
Y., and Saint-Andr ´e, L.: Vegetation dynamics, aboveground and belowground productions in tropical grassland in Congo, in preparation, 2010.
Ugan-BGD
7, 4089–4126, 2010Fluxes of CO2, CH4 and N2O from
savannah
S. Castaldi et al.
Title Page
Abstract Introduction
Conclusions References
Tables Figures
◭ ◮
◭ ◮
Back Close
Full Screen / Esc
Printer-friendly Version
Interactive Discussion
Discussion
P
a
per
|
Dis
cussion
P
a
per
|
Discussion
P
a
per
|
Discussio
n
P
a
per
dan agroforest soils, Phyton – Ann. Rei. Bota. A, 41, 73–80, 2001.
Epron, D., Ngao, J., and Granier, A.: Interannual variation of soil respiration in a beech forest ecosystem over a six-year study, Ann. For. Sci., 61, 499–505, 2004.
Favier, C., de Namur, C., and Dubois, M. A.: Forest progression modes in littoral Congo, Central Atlantic Africa, J. Biogeogr., 31, 1445–1461, 2004.
5
Firestone, M. K. and Davidson, E. A.: Microbiological basis of NO and N2O production and
consumption in soil, edited by: Andreae, M. O. and Schimel, D. S., Exchange of trace gases between terrestrial ecosystems and the atmosphere, pp. 7–21, John Wiley & Sons, New York, USA, 1989.
Fynn, R. W. S., Haynes, R. J., and O’Connor, T. G.: Burning causes long-term changes in
10
soil organic matter content of a South African grassland, Soil Biol. Biochem., 35, 677–687, 2003.
Garcia-Montiel, D. C., Steudler, P. A., Piccolo, M., Neill, C., Melillo, J. M., and Cerri, C. C.: Nitrogen oxide emissions following wetting of dry soils in forest and pastures in Rondonia, Brazil, Biogeochemistry, 64, 319–336, 2003.
15
Hao, W. M., Scharffe, D., Crutzen, P. J., and Sanhueza, E.: Production of N2O, CH4 and CO2
from soils in the tropical savannah during the dry season, J. Atmos. Chem., 7, 93–105, 1988. Hutchinson, G. L. and Mosier, A. R.: Improved soil cover method for field measurements of
nitrous oxide fluxes, Soil Sci. Soc. Am. J., 45, 311–316, 1981.
Huntley, B. J. and Walker, B. H.: Ecology of tropical savannas, Springer-Verlag, Berlin, 1982.
20
Jenerette, G. D., Scott, R. L., and Huxman, T. E.: Whole ecosystem metabolic pulses following precipitation events, Funct. Ecol., 22, 924–930, 2008.
Johansson, C., Rodhe, H., and Sanhueza, E.: Emissions of NO in tropical savanna and a cloud forest during the dry season, J. Geophys. Res.-Atmos., 93, 7180–7192, 1988.
Knicker, H.: How does fire affect the nature and stability of soil organic nitrogen and carbon? A
25
review, Biogeochemistry, 85, 91–118, 2007.
Kovacic, D. A. D., Swift, M., Ellis, J. E., and Hakonson, T. E.: Immediate effects of prescribed
burning on mineral soil nitrogen in ponderosa pine of New Mexico, Soil Sci., 141, 71–76, 1986
Levine, J. S., Winstead, E. L., Parsons, D. A. B., Scholes, M. C., Scholes, R. J., Cofer, W. R.,
30
Cahoon, D. R., and Sebacher D. I.: Biogenic soil emissions of nitric oxide (NO) and nitrous
oxide (N2O) from savannas in South Africa: The impact of wetting and burning, J. Geophys.
BGD
7, 4089–4126, 2010Fluxes of CO2, CH4 and N2O from
savannah
S. Castaldi et al.
Title Page
Abstract Introduction
Conclusions References
Tables Figures
◭ ◮
◭ ◮
Back Close
Full Screen / Esc
Printer-friendly Version
Interactive Discussion
Discussion
P
a
per
|
Dis
cussion
P
a
per
|
Discussion
P
a
per
|
Discussio
n
P
a
per
|
Menault, J. C.: Evolution of plots protected from fire since 13 years in a guinea savanna of Ivory Coast, 4th Symp. Tropical Ecology, Panama, 1977.
Menault, J. C., Abbadie, L., Lavenu, F., Loudjani, P., and Podaire, A.: Biomass burning in West African savannas, edited by: Levine, J., Global Biomass Burning: Atmospheric, Climatic and Biospheric Implications, MIT Press, Cambridge, pp 133–149, 1991.
5
Michelsen, A., Andersson, M., Jensen, M., Kjøller, A., and Gashew, M.: Carbon stocks, soil res-piration and microbial biomass in fire-prone tropical grassland, woodland and forest ecosys-tems, Soil Biol. Biochem., 36, 1707–1717, 2004.
Mills, A. J. and Fey, M. V.: Frequent fires intensify soil crusting: Physico-chemical feedback in the pedoderm of long-term burn experiments in South Africa, Geoderma, 121, 45–64, 2004.
10
Moore, S. and Stein, W. H.: A modified ninhydrin reagent for the photometric determination of amino acids and related compounds, J. Biol. Chem., 211, 907–913, 1954.
Ojima, D., Schimel, D. S., Parton, W. J., and Owensby, C. E.: Long and short-term effects of
fire on nitrogen cycling in tallgrass prairie, Biogeochemistry, 24, 67–84, 1994.
Otter, L. B. and Scholes, M. C.: Methane sources and sinks in a periodically flooded South
15
African savanna, Global Biogeochem. Cycles, 14, 97–111, 2000.
Pinto, A. S., Bustamante, M. M. C, Kisselle, K., Burke, R., Zepp, R., Viana, L. T., Varella,
R. F., and Molina, M.: Soil emissions of N2O, NO, and CO2in Brazilian savannas: Effects
of vegetation type, seasonality, and prescribed fires, J. Geophys. Res., 107(D20), 8089, doi:10.1029/2001JD000342, 2002.
20
Poth, M., Anderson, I. C., Miranda, H. S., Miranda, A. C., and Riggan, P. G.: The magnitude
and persistence of soil NO, N2O, CH4and CO2fluxes from burned tropical savanna in Brasil,
Global Biogeochem. Cycles, 9, 503–513, 1995.
Potter, C. S., Davidson, E. A., and Verchot, L. V.: Estimation of global biogeochemical controls and seasonality in soil methane consumption, Chemosphere, 32, 2219–2246, 1996.
25
Prieto-Fernandez, A., Carballas, M., and Carballas, T.: Inorganic and organic N pools in soils burned or heated: immediate alteration and evolution after forest wildfires, Geoderma, 121, 291–306, 2004.
Raison, R. J.: Modification of the soil environment by vegetation fires, with particular reference to nitrogen transformations: a review, Plant and Soil 51, 73–108, 1979.
30
Rees, R. M., Wuta, M., Furley, P. A., and Li, C.: Nitrous oxide fluxes from savanna (miombo) woodlands in Zimbabwe, J. Biogeogr., 33, 424–437, 2006.