BGD
6, 5589–5622, 2009Air-sea CO2 fluxes in the Atlantic
X. A. Padin et al.
Title Page
Abstract Introduction
Conclusions References
Tables Figures
◭ ◮
◭ ◮
Back Close
Full Screen / Esc
Printer-friendly Version
Interactive Discussion Biogeosciences Discuss., 6, 5589–5622, 2009
www.biogeosciences-discuss.net/6/5589/2009/ © Author(s) 2009. This work is distributed under the Creative Commons Attribution 3.0 License.
Biogeosciences Discussions
Biogeosciences Discussionsis the access reviewed discussion forum ofBiogeosciences
Air-sea CO
2
fluxes in the Atlantic as
measured during the FICARAM cruises
X. A. Padin1, M. V ´azquez-Rodr´ıguez1, M. Casta ˜no1, A. Velo1, F. Alonso-P ´erez1, J. Gago2, M. Gilcoto1, M. ´Alvarez3, P. C. Pardo1, M. de la Paz1, A. F. R´ıos1, and F. F. P ´erez1
1
Instituto de Investigaciones Marinas, CSIC, Eduardo Cabello 6, 36208 Vigo, Spain
2
Instituto Espa ˜nol de Oceanograf´ıa (IEO. Vigo), Cabo Estai – Canido, Apartado 1552, 36200 Vigo, Spain
3
Institut Mediterrani d’Estudis Avanc¸ats, CSIC-UIB, Miquel Marqu ´es 21, 07190 Esporles, Spain
Received: 18 May 2009 – Accepted: 21 May 2009 – Published: 12 June 2009
Correspondence to: X. A. Padin (padin@iim.csic.es)
BGD
6, 5589–5622, 2009Air-sea CO2 fluxes in the Atlantic
X. A. Padin et al.
Title Page
Abstract Introduction
Conclusions References
Tables Figures
◭ ◮
◭ ◮
Back Close
Full Screen / Esc
Printer-friendly Version
Interactive Discussion
Abstract
A total of fourteen hydrographic cruises spanning from 2000 to 2008 were conducted during the spring and autumn seasons between Spain and the Southern Ocean, under the framework of the Spanish research project FICARAM. The performed underway measurements are processed and analysed to describe the meridional air-sea CO2 5
fluxes (FCO2) along the Atlantic Ocean. The data was organised into different
biogeo-chemical oceanographic provinces, according mainly to the thermohaline characteris-tics. The obtained spatial and temporal distributions ofFCO2follow the generally
ex-pected patterns and annual trends. The Subtropical regions in both hemispheres alter-nated the CO2source and sink nature from autumn to spring, respectively. On the other
10
hand, Tropical waters and the Patagonian Sea clearly behaved as sinks of atmospheric CO2like the waters of the Drake Passage during autumn. The obtained results during
the cruises also revealed significant long-term trends, such as the warming of equato-rial waters (0.11±0.03◦C yr−1) and the decrease of surface salinity (−0.16±0.01 yr−1)
in tropical waters caused by the influence of the Amazon River plume. This reduction
15
in surface salinity appears to have a direct influence over the CO2 storage rates,
fos-tering the uptake capacity of atmospheric CO2(−0.09±0.03 mol m−2yr−1). An analysis
of the biogeochemical forcing on the CO2 fugacity (fCO2) variability performed from
an empirical algorithm highlighted the major role of the Amazon River input in the trop-ical North Atlantic fluxes. In addition, it has provided a quantitative measure of the
20
importance of the thermodynamic control ofFCO2at temperate latitudes.
1 Introduction
The CO2 emissions linked with human activity, such as fossil fuel burning, changes in land-use or cement production, have greatly altered the atmospheric CO2
concen-trations (Keeling and Whorf, 2000; Houghton, 2003). However, out of the total CO2 25
BGD
6, 5589–5622, 2009Air-sea CO2 fluxes in the Atlantic
X. A. Padin et al.
Title Page
Abstract Introduction
Conclusions References
Tables Figures
◭ ◮
◭ ◮
Back Close
Full Screen / Esc
Printer-friendly Version
Interactive Discussion 2007) remains under a stationary storage state in this environmental compartment
(Sarmiento and Gruber, 2002; Sabine et al., 2004). In this regard, the oceanic and ter-restrial ecosystems play out a major part as they sequestrate a good deal of this green-house gas, thus modulating its atmospheric presence and thereby affecting greatly the temperature that is sensed in the biosphere (Siegenthaler and Sarmiento, 1993).
5
The air-sea CO2 fluxes (FCO2) has lingered over the years as one of the most
loosely-tracked and uncertain terms in the carbon system, introducing large uncer-tainties in global carbon budget estimates, particularly at interannual scales (Keeling et al., 1995; Francey et al., 1995; Battle et al., 2000). This stems from the sparseness and shortage of in situFCO2measurements and from the lack of time-series records 10
on a long-term basis. In this context, it is important to strive for a better monitoring of this variable in order to restrain the uncertainties attached to ocean CO2 uptake
estimates and to its variability. The coverage of in situ measurements can be largely enhanced through international cooperation research programs and from the use of as much of the available ship-potential as possible. This was the motivation that
fos-15
tered the Spanish project FICARAM (Air-sea CO2fluxes along meridional tracks in the
Atlantic Ocean), which was born as part of an international effort to carry out exten-sive measurements that would cover ocean basin scales. More specifically, FICARAM was developed within the framework of larger European projects such as CAVASOO (Carbon Variability Studies by Ships Of Opportunity) and CARBOOCEAN (Marine
Car-20
bon Sources and Sinks Assessment). The compendium of datasets generated during FICARAM has been made available from several global databases.
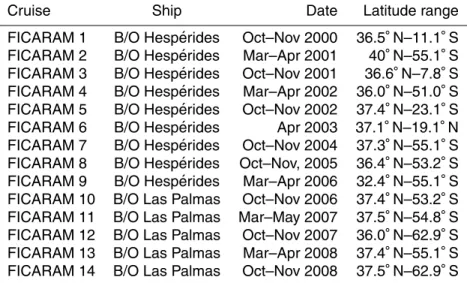
The FICARAM cruises (Table 1) were carried out profiting from courses carried reg-ularly on a six-month basis between Spain and the Antarctic from 2000 to present day, before and after the Antarctic research programme during the austral summer. The
un-25
BGD
6, 5589–5622, 2009Air-sea CO2 fluxes in the Atlantic
X. A. Padin et al.
Title Page
Abstract Introduction
Conclusions References
Tables Figures
◭ ◮
◭ ◮
Back Close
Full Screen / Esc
Printer-friendly Version
Interactive Discussion desirably refine theFCO2 estimates and our knowledge of its long-term trends. The
assort of regions sampled during the FICARAM cruises varies from highly productive areas located in upwelling systems to oligotrophic intertropical gyres. The tracks also covered the large areas of the North and South Atlantic Oceans, known to behave as important sinks of atmospheric CO2at (Takahashi et al., 2008). The aim of the present 5
work is presenting a comprehensive outlook of the fCOsw2 datasets collected during the FICARAM cruises, analyzing the seasonal differences recorded and the interan-nual variability along the meridional transects in the Atlantic Ocean.
2 Dataset and methods
2.1 The FICARAM cruises
10
A total of fourteen FICARAM cruises were conducted on board the research vessels B/O Hesp ´erides and B/O Las Palmas beginning in October 2000 until to nowadays (Table 1). While covering approximately the same transit between the southern Span-ish and northern Moroccan coasts and the Southern Ocean (Fig. 1), the heading of the courses was southward during boreal falls and northward in boreal springs. The
15
tracks were under military steering and framed within the Antarctic research program for doing maintenance chores and bringing supplies to the Spanish Antarctic bases Gabriel de Castilla and Juan Carlos I, located in the Deception and Livingston Islands, respectively.
The FICARAM cruises mainly sampled the Eastern North and Western South
At-20
lantic basins. Nonetheless, in order to record as faithfully as possible the meridional variability offCOsw2 it was initially attempted to stick as much as possible to meridian 28◦W while underway, but this was normally subject to ship-time availability. Unfortu-nately, this practice ceased after the FICARAM 9 cruise, when the vessels started op-erating as ships of opportunity and sailed directly from departure to arrival ports. The
25
BGD
6, 5589–5622, 2009Air-sea CO2 fluxes in the Atlantic
X. A. Padin et al.
Title Page
Abstract Introduction
Conclusions References
Tables Figures
◭ ◮
◭ ◮
Back Close
Full Screen / Esc
Printer-friendly Version
Interactive Discussion for long.
2.2 Equipment installation
The underway measurements of sea-surface and atmospheric molar fractions of CO2
(xCOsw2 and xCOatm2 , respectively) were performed with a GASPAR apparatus. This autonomous device was fully devised and assembled at Instituto de Investigaci ´ons
5
Mari ˜nas (IIM-CSIC, Vigo-Spain), based on a previous setup developed by researchers at the Institut f ¨ur Meereskunde (Kiel-Germany; K ¨ortzinger et al., 1996). The analytical principle of the GASPAR is based on the equilibration of a carrier gas phase with the seawater parcel under analysis. Subsequently, the CO2mixing ratio in the carrier gas is determined with an infrared analyser.
10
There exist several systems that allow reaching the equilibration between the car-rier gas phase and the sample. The equilibrator system of GASPAR combines the advantages of a laminar flow system (Poisson et al., 1993) and a bubble-type system (Takahashi, 1961). The bubble equilibrator is a chamber of 1.5 L volume that is being constantly renewed with incoming seawater, while the laminar flow equilibrator consists
15
of a 30 cm high glass column with two concentric cylinders to provide thermal insula-tion for the water flow that is centered at the top of the water chamber. A fixed volume of air recirculates through this system at a flow rate of 0.8 L min−1and it is virtually in
continuous equilibrium with the seawater phase that is being constantly renewed. The system is vented to the atmosphere through an air ballast bottle flushed by an external
20
air stream to the ship for avoiding enriched CO2 air inputs from the lab. Meanwhile, seawater is being continuously pumped from 3 m under the waterline into the ship’s hull at a high flow rate to avoid warming of the seawater sample (1.5 L) prior to entering the apparatus. The atmospheric air is thrusted with an air pump through a Dekabon tube mounted on the windward side of the ship’s mast to avoid exhaust fumes from the
25
ship’s engine.
BGD
6, 5589–5622, 2009Air-sea CO2 fluxes in the Atlantic
X. A. Padin et al.
Title Page
Abstract Introduction
Conclusions References
Tables Figures
◭ ◮
◭ ◮
Back Close
Full Screen / Esc
Printer-friendly Version
Interactive Discussion practice to determine the partial pressure of CO2 (pCO2) in an air-flushing
equilibra-tor (DOE, 1994). This instrument has a reference channel (apart from the measuring channel) where a dry CO2-free gas is recirculated at a rate of 0.2 L min−
1
. Altogether, two standards were used through this channel alternatively, namely, CO2-free air and a CO2 standard gas of known concentration (375 ppm) certified by Instituto Meteo-5
rol ´ogico Nacional de Iza ˜na (Canary Islands, Spain). The different gas streams are passed through the Li-COR via miniature solenoid valves, which were used as selec-tion switches between the different measuring modes, i.e., atmosphere, air from the equilibrator or standard gases. A visual basic software routine allowed for the automa-tion of the system by managing the measuring intervals of each mode. The typical
10
measuring routine configuration consisted of a calibration phase, in which 20 mea-surements for each of the two gas standards were performed. Immediately after, a routine of 24 uninterrupted cycles of one hour long each (55 min devoted to seawater sample measurements and 5 min for atmospheric air records) is started.
A thermosalinograph (SBE-45-MicroTSG) fed by a bifurcation of the uncontaminated
15
seawater supply was coupled to GASPAR and recorded underway surface temperature (SST) and salinity (SSS) during the B/O Las Palmas cruises. When onboard the B/O Hesp ´erides these data were gathered via the vessel-mounted oceanographic data ac-quisition system.
2.3 Estimation of air and seafCO2and air-sea CO2exchanges 20
ThexCOatm2 values were linearly interpolated versus latitude, using monthly measure-ments from selected meteorological stations of the NOAA/ESRL Global Monitoring Di-vision located close to ship tracks (Fig. 1), namely: Mace Head (Ireland, 53.33◦N), Azores (Portugal, 38.77◦N), Iza ˜na (Spain, 28.3◦N), Ascension (UK, 7.92◦S),
Arem-bepe (Brazil, 12.77◦S), Tierra de Fuego (Argentina, 54.87◦S) and Palmer Station (US,
25
afore-BGD
6, 5589–5622, 2009Air-sea CO2 fluxes in the Atlantic
X. A. Padin et al.
Title Page
Abstract Introduction
Conclusions References
Tables Figures
◭ ◮
◭ ◮
Back Close
Full Screen / Esc
Printer-friendly Version
Interactive Discussion mentioned interpolation infers negligible random errors in the air-sea flux calculations
for the large majority of the seasonal cycle (Padin et al., 2007). The record gaps in the time-series from these stations were completed from a fit between ship measurements and a theoretical curve, which consists of a combination of a seasonal cycle trend with the annual and semi-annual harmonics (Padin et al., 2007). The finalxCOatm2 dataset
5
was then converted to pCOatm2 (Eq. 1) and, for this conversion, the partial pressure of water vapour (pH2O, in atm) was calculated from in situ SST (Tis, in ◦C) readings
(Cooper et al., 1998) (Eq. 2). Finally, when calculatingfCOatm2 frompCOatm2 values, a decrease of 0.3% is considered of acceptable accuracy (Weiss, 1974) while for greater differences the values are flagged.
10
pCOatm2 =xCOatm2 (patm−pH2O) (1)
pH2O=0.981 exp(14.32602−(5306.83/(273.15+Tis))) (2)
The measuredxCOsw2 data was converted tofCOsw2 referenced to saturated water vapour pressure using the atmospheric pressure readings from the DOE Handbook (1994) compliant barometer installed in the GASPAR system. ThefCOsw2 values were
15
then corrected for the seawater temperature shift caused by the passing from the hull’s inlet into the equilibration chamber that was usually lower than 1◦C. This temperature tracking was done with platinum resistance thermometers and then applying the em-pirical equation proposed by Takahashi et al. (1993;δlnpCO2/δT=0.04231C◦−
1
).
FCO2=a k S∆fCO2 (3)
20
TheFCO2(mol m−2yr−1) was calculated applying Eq. (3), where “a” is a unit conver-sion factor, “S” (mol kg−1atm−1) stands for the solubility of CO
2in seawater (Weiss et
al., 1974), “k” (cm h−1) is the CO2 transfer velocity (Wanninkhof, 1992) and ∆fCO2
(µatm) is the air-sea fCO2 gradient (i.e. fCO sw
2 −fCO
atm
2 ). The coefficient “k” was
computed from daily anemometric wind speed records at 10 m above sea-surface
BGD
6, 5589–5622, 2009Air-sea CO2 fluxes in the Atlantic
X. A. Padin et al.
Title Page
Abstract Introduction
Conclusions References
Tables Figures
◭ ◮
◭ ◮
Back Close
Full Screen / Esc
Printer-friendly Version
Interactive Discussion from the NCEP/NCAR reanalysis project (Kalnay et al., 1996). Data was accessed
via the website of the NOAA-CIRES Climate Diagnostics Center, Boulder, Co, USA (http://www.cdc.noaa.gov/). The∆fCO2 was initially estimated with a 1-min frequency
but it was then averaged to 5-min cycles.
In addition remotely sensed chlorophyll-a (chl-a) was included in the FICARAM
5
dataset as a proxy of photosynthetic activity. Weekly fields of chl-a, with a spatial resolution of 9 km2were remotely recorded by Sea-viewing Wide Field-of-view Sensor (SeaWIFS) Level 3 (Hooker et al., 1992) and downloaded from http://oceancolor.gsfc. nasa.gov/. The selected satellite records of chl-ado not have an exact spatiotemporal match with ship measurements: they were chosen from pixels that were taken within
10
±4 days (orbital over-passing) of the ship measurement date and found within±6.3 km
offthe track of the cruise.
2.4 Biogeochemical oceanographic provinces
The study of the meridional AtlanticfCOsw2 has been focused on selected biogeochem-ical provinces, after the pioneering works on this subject from Longhurst et al. (1995)
15
and Hooker et al. (2000). The FICARAM tracks over the Atlantic Ocean (excluding the Mediterranean basin) were delimited according to average boundaries established from SST-SSS relationships, resulting in the following ten regions (Fig. 1):
Eastern North Atlantic Subtropical Gyre (ENAS; 39◦N–27◦N) is dominated by the Azores Current (R´ıos et al., 1992) that is the northeast component of the North Atlantic
20
Subtropical Gyre.
TheCanary Current (CC; 27◦N–16◦N) is also a part of the northern subtropical gyre with a moderate flow characterised by a salinity maximum that demarcates the begin-ning of the tropics. A coastal upwelling is located in the West African continental margin at these latitudes, and its influence can reach as far as 300 km offshore (Mittelstaedt,
25
1991).
TheNorth Equatorial Current (NEC; 16◦N–8◦N) region is located amidst the zonal
BGD
6, 5589–5622, 2009Air-sea CO2 fluxes in the Atlantic
X. A. Padin et al.
Title Page
Abstract Introduction
Conclusions References
Tables Figures
◭ ◮
◭ ◮
Back Close
Full Screen / Esc
Printer-friendly Version
Interactive Discussion province (12◦N–8◦N) characterized by its seasonal upwelling events that stretch from
December to April or May (Barton et al., 2001). Despite this, the underway measure-ments were not affected by the upwelled waters because the cruises normally sailed too far offshore at these latitudes.
TheNorth Equatorial Counter Current province (NECC; 8◦N–1◦N) features a
max-5
imum flow from the easterly current during the Boreal Autumn that fades away almost completely during the winter and early spring (Richardson and Reverdin, 1987). This province is also characterized by a band of low-density waters from the Amazon River with a core at 4◦N–5◦N (M ¨uller-Karger et al., 1988) with SST values of∼25◦C (Emery
and Dewar, 1982) and a SSS<35.
10
TheSouth Equatorial Currentprovince (SEC; 1◦N–15◦S) displays a seasonal forcing with a maximum westward flow during the austral winter in the vicinity of the Equator. The South Equatorial Counter Current (SECC) is weakly present between 7◦S–9◦S.
The South Atlantic Tropical Gyre province (STG; 15◦S–31◦S) has relatively stable thermohaline properties with a gradual decrease of its SST and SSS values. An
im-15
portant poleward component of the Brazil Current that runs along the South American continental shelf is also included in this region.
The South American Shelf province (SAS; 31◦S–40◦S) is also dominated by the Brazil Current, that extends southward as far as 44◦S, but has its most outstanding
particularity on the strong influence the Plata river exerts here.
20
The South Atlantic Convergence zone (SAC; 40◦S–51◦S) is a frontal area where the northward Falkland and southward Brazil currents converge that generate high temperature gradients and large heterogeneity in the concentration fields of several chemical properties.
TheFalkland Current (FC; 51◦S–56◦S) is a northward looping excursion of the
Cir-25
cumpolar Current that forms a jet of SST and SSS under 10◦C and 34.3, respectively (Bianchi et al., 1993).
BGD
6, 5589–5622, 2009Air-sea CO2 fluxes in the Atlantic
X. A. Padin et al.
Title Page
Abstract Introduction
Conclusions References
Tables Figures
◭ ◮
◭ ◮
Back Close
Full Screen / Esc
Printer-friendly Version
Interactive Discussion dominated by a racing eastward flow of Antarctic Circumpolar Current. The
South-ern Ocean is characterized by a latitudinal succession of circumpolar frontal structures such as the Subantarctic Front, the Polar Front and the Continental Water Boundary.
In addition to the former division, a depth of 200 m was chosen as a boundary to separate ocean from shelf areas in the African and South American continents (Fig. 1).
5
The CO2source-sink changes within the continental shelf with respect to depth were
also considered: while the distal shelf normally behaves as a CO2 sink, the proxi-mal shelf is essentially influenced by continental inputs and non-stratified conditions that favour the outgasing of CO2to the atmosphere (Thomas et al., 2004; Padin et al.,
2007; Chen and Borges, 2009). Consequently, surface (<50 m) coastal waters that
cor-10
responded mainly to harbour areas were excluded from the database. The ETOPO2v2 (USDC, NOAA, NGDC 2006) bathymetry was used for merging depth records using two-dimensional linear interpolation functions of every measurement. After applying all of these selection criteria filters the FICARAM dataset comprised a total of 67 845 observations.
15
3 Results and discussion
3.1 Thermohaline sea-surface variability
The observed thermohaline distribution of the selected biochemical provinces (Fig. 1) springs directly from the meridional differences in the radiation balance, evaporation-precipitation rates and continental inputs (Fig. 2a, b, e, f). In general, Northern
Hemi-20
sphere waters were warmer than Southern waters during the boreal autumn while the opposite prevailed during boreal springs (Fig. 2a, e). At a seasonal scale the SST changes are maxima in the subtropical regions (4.3◦C and 3.5◦C at the ENAS and STG regions, respectively; Table 2). Differently, almost negligible seasonal SST differences were observed in equatorial regions (NECC region; Table 2). Regarding the meridional
25
BGD
6, 5589–5622, 2009Air-sea CO2 fluxes in the Atlantic
X. A. Padin et al.
Title Page
Abstract Introduction
Conclusions References
Tables Figures
◭ ◮
◭ ◮
Back Close
Full Screen / Esc
Printer-friendly Version
Interactive Discussion unlike the latter the seasonal variability appears not be so clearly distinguishable in
either hemisphere (Fig. 2b, f).
On a more local scale, the ENAS and CC provinces show an equatorward warming of surface waters (2.7 and 2.4◦C during autumn and spring, respectively), parallel to a modest increase in SSS. Interestingly, the coastal upwelling offAfrican coasts,
be-5
tween Cape Blanc (21◦N) and Cape Bojador (26◦N), was recorded during the autumn seasons of the last cruises, manifested from the cooling and SSS decrease observed in the CC province.
The intense intertropical (23.4◦S–23.4◦N) precipitation rates cause an inversion in the direct SST-SSS relationship observed in Northern Hemisphere provinces.
More-10
over, the massive continental discharge contributions from the Amazon River generate a sharp and wide band of minimum SSS values in the NECC province. These low SSS values were especially marked in autumn given the most frequent rain during summer and the intensification of eastward currents (Richardson and McKee, 1984). This autumn intensification of freshwater inputs produced a seasonal SSS difference
15
of 0.5, and the fresher record (33.63) was spotted at 4.3◦N during autumn 2008. The warmest waters (28.2±0.6◦C) of the Atlantic Ocean are also found in the NECC region
(Table 2) in autumn, putting forward the evidence of the aforementioned intertropical inverse SST-SSS correlation. The overall warmest waters were located south, in the SEC province during the spring season (Table 2). An average value of 28.7±0.3◦C was
20
reached and an outstanding peak of 29.9◦C was recorded at 8.6◦S during April 2008.
As in the case of Subtropical waters in the North Hemisphere, a clear poleward decrease of SST and SSS was observed in the STG province (Fig. 2a, b, e, f). This trend is also observed in the southward ocean tracks but with colder and fresher waters of coastal origin. The influence of continental inputs was especially intense in the SAS
25
BGD
6, 5589–5622, 2009Air-sea CO2 fluxes in the Atlantic
X. A. Padin et al.
Title Page
Abstract Introduction
Conclusions References
Tables Figures
◭ ◮
◭ ◮
Back Close
Full Screen / Esc
Printer-friendly Version
Interactive Discussion The frontal region formed by the convergence of the warm and saline Brazil
Cur-rent and the cold and less saline Falkland CurCur-rent generates the strong thermohaline gradients observed offshore in the northern boundary of the SAC region, especially during autumn (Fig. 2e, f). A sharp southward decrease of SST and SSS (∼6◦C and ∼2 units, respectively) was found during FICARAM 7 (Fig. 2). Surprisingly, the
under-5
way measurements along the Patagonian shelf did not reveal the typical circumpolar convergence structures in these latitudes. The distal shelf in this region was usually occupied by a mixture of waters from the Falkland and Brazilian currents and diluted mainly with freshwater outflows from the Plata River (Gordon, 1989). Additionally, it can be inferred from the seasonal changes observed in estuarine flows from shelf
wa-10
ters of the SAC province that freshwater runoffs and the seasonally dominant wind fields determine the influence of fluvial waters in the Patagonian shelf (Table 2, Fig. 2). Accordingly, the dominant southward winds during the boreal autumn-winter seasons (northward in spring-summer) produced the low SSS values registered during the au-tumn cruises.
15
Yet another local SSS minimum (average 32.9±0.5) was recorded on the distal shelf
of the FC (Fig. 2) during autumn cruises (Table 2). This SSS decrease was driven by the important outflow of low salinity waters from the Magellan Strait (Bianchi et al., 2005) caused by the continental ice melting in the Pacific coast of Tierra de Fuego (Pi-ola and Rivas, 1997). On the contrary, none of either the coastal freshwater influence
20
or the seasonal changes reached oceanic waters (Table 2).
The Southern Ocean waters in the DP province were only sampled four times in November 2007 and 2008. The thermohaline spatial distribution shows clearly the well-known meridional zonation of Antarctic waters. Two regions of rapid SST tran-sition at the Antarctic Circumpolar Current point out the locations of the Subantarctic
25
Front (∼57◦S) and the Polar Front (58.7◦S), respectively (Fig. 2e). Yet another front,
BGD
6, 5589–5622, 2009Air-sea CO2 fluxes in the Atlantic
X. A. Padin et al.
Title Page
Abstract Introduction
Conclusions References
Tables Figures
◭ ◮
◭ ◮
Back Close
Full Screen / Esc
Printer-friendly Version
Interactive Discussion Alternatively, surface waters close to the Livingston Island were the coldest records of
all the FICARAM cruises, with an average temperature of−0.8±0.7◦C, which is
signifi-cantly colder than oceanic waters in this region (average 1.1±2.0◦C; Table 2). Antarctic
waters showed significant interannual variability, with a remarkable 0.8◦C warmer and 0.2 salinity units fresher waters during autumn 2008 (Fig. 2e, f).
5
3.2 Distributions of∆fCO2andFCO2
The ∆fCO2 variability of the northern provinces (Fig. 1) follows roughly the spring
and autumn meridional SST distributions, and has an analogous equatorward trend to that of declining SST seasonal amplitudes (Fig. 2c, g). The largest seasonal∆fCO2 variability (43µatm of amplitude) was measured for the ENAS province, while the
10
NECC province showed virtually no variability (max. 2µatm differences) (Table 2). The maximum air-sea disequilibria in each province corresponded to the autumn sea-son in the Northern Hemisphere, the highest ∆fCO2 being 16±13µatm, in the CC
region. On the other hand, the lowest ∆fCO2 in these latitudes were recorded
dur-ing the sprdur-ing season reachdur-ing minimum values of−34±12µatm in the ENAS region.
15
Strongly undersaturated surface waters were sampled in the cruises conducted closer to the coast, such as the FICARAM 9 and 14 (Fig. 1). The maximum undersaturation was found around 20◦N, corresponding to the upwelling system along the Mauritanian
coast and its typically associated biologically enhanced CO2 drawdown. The
north-eastern Atlantic provinces behaved as a sink of atmospheric CO2 during the succes-20
sive spring seasons, with an averageFCO2of−1.8±1.2 and−1.4±1.0 mol m−2yr−1in
the ENAS and CC, respectively. In spite of behaving as a net sink of−0.22 PgC yr−1
at an annual scale (Takahashi et al., 2008), the CO2 sink behaviour in these regions
swapped to CO2source during autumn, yielding averageFCO2values of 0.2±0.4 and
0.6±0.5 mol m−2yr−1.
25
The tropical Atlantic regions (14◦N–14◦S) were measured to behave as net CO2
Neverthe-BGD
6, 5589–5622, 2009Air-sea CO2 fluxes in the Atlantic
X. A. Padin et al.
Title Page
Abstract Introduction
Conclusions References
Tables Figures
◭ ◮
◭ ◮
Back Close
Full Screen / Esc
Printer-friendly Version
Interactive Discussion less, the NEC province did not act as a CO2source to the atmosphere in any FICARAM
cruises. It remained CO2 undersaturated (−17±10µatm) during the spring cruises
and close to equilibrium in autumn (Table 2). This quasi-equilibrium also extended across the NECC province during both seasons, with nearly absent CO2 exchanges. The equatorial upwelling system in the SEC province was highly supersaturated with
5
CO2 in both spring and autumn (Fig. 2c, g). An average∆fCO2value of 30±11µatm
during spring exceeded slightly the 24±12µatm autumn records and caused a
sub-tle shift of released CO2 between the spring and autumn seasons in this region, from
0.7±0.5 mol m−2yr−1to 1.0±0.7 mol m−2yr−1, respectively. Alternatively, the stretch of
surface waters acting as a CO2source showed important changes at a seasonal scale, 10
and reached even the southern latitudes during autumn season (Fig. 2c, g).
Regarding the Southern Hemisphere, the subtropical waters of the STG province were characterized by a poleward undersaturation increase with respect to the atmo-sphere, parallel to the SST and SSS decreases (Fig. 2c, g). The estimatedFCO2 for open ocean waters revealed an inverse seasonal behaviour to the one observed in
15
the North Atlantic: STG oceanic waters acted as a source of 0.6±0.6 mol C m−2yr−1
during spring and as a slight sink of−0.2±0.7 mol C m−2yr−1in autumn (Table 2).
Op-posite to the seasonal variability expected for ocean waters, the distal shelf of the STG region behaved as a slight CO2 source during the spring and autumn seasons
(0.4±0.4 mol m−2yr−1and 0.5±0.7 mol m−2yr−1, respectively) (Table 2).
20
On the contrary, most provinces in the Patagonian Sea acted as an intense CO2 sink during the autumn and spring seasons, particularly in shelf areas. In general, the estimated∆fCO2 and FCO2 distributions match roughly with some recently reported
results in the Patagonian Sea by Bianchi et al. (2009). The latter has reported average autumn∆fCO2andFCO2values of−67µatm and−2.5 mol m−
2
yr−1, respectively and
25
−20µatm and−1.1 mol m−2yr−1for the spring seasons. Surprisingly, such results are
BGD
6, 5589–5622, 2009Air-sea CO2 fluxes in the Atlantic
X. A. Padin et al.
Title Page
Abstract Introduction
Conclusions References
Tables Figures
◭ ◮
◭ ◮
Back Close
Full Screen / Esc
Printer-friendly Version
Interactive Discussion shelf waters of the Patagonian Sea from copious nutrient inputs (Bakun and Parrish,
1991) and photosynthetic cell accumulation in frontal regions (Froneman et al., 1999) would not be responsible for the biological CO2drawdown. Most of these primary
pro-duction stimulating mesoscale processes, such as continental runoffs, current interac-tions and frontal regions produced abrupt changes in the∆fCO2andFCO2distribution 5
(Fig. 2c, d, g, h) and set forth the complex hydrography in these regions (Bianchi et al., 2009).
Like the rest of Patagonian provinces, the SAS measurements classify this region as an intense CO2 sink, especially in the shelf areas during the austral spring (average
CO2 sequestration of−3.2±2.7 mol m− 2
yr−1; Table 2). These uptake rates exceeded
10
the air-sea CO2exchanges estimated in the SAC province in both spring and autumn. Similarly to Bianchi et al. (2009),∆fCO2values lower than−190µatm were measured
over the shelf-break waters during the austral spring (Fig. 2g). Notwithstanding the potential of shelf waters, oceanic waters of the SAS province are rated as the strongest CO2 sink recorded in the FICARAM history (Table 2), with an average uptake rate of 15
−5.4±3.6 mol m−2yr−1in average wind speed (WS) fields of 9.9±3.1 m s−1.
The distal shelf of the FC province also behaved as a particularly intense CO2sink (−1.4±3.2 mol m−2yr−1) during the austral spring. However, oceanic waters of this
province showed seasonal shifts in the direction of FCO2: it went from strong
un-dersaturation states (−50±40µatm) in autumn to equilibrium conditions (1±26µatm)
20
during spring (Table 2). In spite of the latter modest∆fCO2 values, the WS fields in this region, one of the world’s mightiest (Trenberth et al., 1990) that reached values of
∼17.6 m s−1during spring 2002, contributed considerably to make this area a notable
outgasing zone of 1.2±2.5 mol m−2yr−1.
The autumn ∆fCO2 measurements in Antarctic waters gathered during two of the 25
in-BGD
6, 5589–5622, 2009Air-sea CO2 fluxes in the Atlantic
X. A. Padin et al.
Title Page
Abstract Introduction
Conclusions References
Tables Figures
◭ ◮
◭ ◮
Back Close
Full Screen / Esc
Printer-friendly Version
Interactive Discussion terannual variability observed also in the thermohaline field (Fig. 2). The Antarctic
average ∆fCO2 fields during 2007 were homogeneous and slightly undersaturated (−10±4µatm) and increased up to−21±21µatm during the following year. In spite of
these differences,∆fCO2values were locally clustered around −20µatm in the
vicin-ity of the Polar Front during both years. South from this latitude, there was a marked
5
southward∆fCO2 decrease towards the Continental Water Boundary, where a
max-imum air-sea CO2 disequilibrium (−80µatm) was reached at 61.9◦S. This latitudinal
band between the Polar Front and the Continental Water Boundary is characterized by the divergence of east and west wind belts (Klinck and Nowlin, 1986) that cause the upwelling of the North Atlantic Deep Water. This surface input of iron-rich deep
10
waters combined with strong stratification phases stimulated high rates of primary pro-duction (Legendre et al., 1992; Arrigo et al., 1997; Metzl et al., 1991; Poisson et al., 1994) that ultimately translated into the lowest fCOsw2 values recorded in 2008. This conjecture is supported by the fact that the photosynthetic activity in the Antarctic Di-vergence region significantly increased from 2007 to 2008, i.e., from 0.12±0.02 mg m−3
15
to 0.17±0.01 mg m−3. Thus, the ocean sequestration of CO2in 2008 exceeded that in
2007 (−1.8±1.2 mol m−2yr−1 and −0.4±0.3 mol m−2yr−1, respectively), as expected.
Nevertheless, the highest uptake rates of CO2 (−6.5 mol m− 2
yr−1) were reached due to the compensation of high WS of 15.4 m s−1at 56.25◦S, far from the area of largest ∆fCO2 undersaturation. On the other hand, the shelf waters of the Southern Ocean 20
showed an onshore increase of∆fCO2provoked by an intense growth of phytoplank-tonic communities (>0.30 mg m−3) located over the continental slope of the Livingston Island (Perissinotto et al., 1992, 2000; Pakhomov and Froneman, 1999; Blain et al., 2001). In summary, the distal shelf of the DP province acted as a slight source of CO2 to the atmosphere (0.1±0.3 mol m−
2
yr−1) while ocean waters displayed average
25
BGD
6, 5589–5622, 2009Air-sea CO2 fluxes in the Atlantic
X. A. Padin et al.
Title Page
Abstract Introduction
Conclusions References
Tables Figures
◭ ◮
◭ ◮
Back Close
Full Screen / Esc
Printer-friendly Version
Interactive Discussion
3.3 Long-trends of biochemical variables
In order to gain consistency and reduce the long term variability registered during the successive FICARAM cruises, all highly heterogenic measurements gathered on the distal shelf were excluded in further analysis. Values of the Northwest Atlantic basin, which corresponded to measurements made during spring 2007 mainly in the CC
5
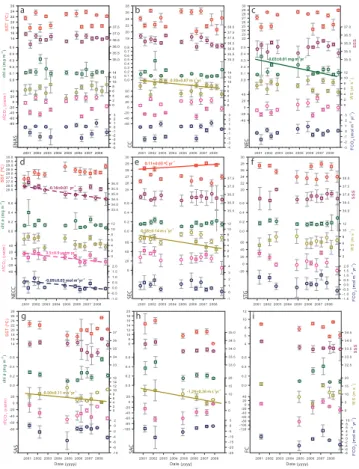
province, were neither considered in this study due to the known existing differences with the Eastern basin (L ¨uger et al., 2004). Figure 3 graphically depicts the average values for each province of every variable measured during each FICARAM cruise (er-ror bars stand for the respective standard deviation). The seasonal mean values were used to obtain a linear fit and thereby estimate significant (p<0.05) long-term trends
10
so as to include them as well and complete the database. These interannual trends should only be taken into account as year-to-year trends of the respective seasons due to the seasonal interannual variability (Lefevre et al., 2004; Padin et al., 2008).
The northern provinces showed substantial changes at an annual scale for some of the variables. The interannual variability of SST and ∆fCO2 indicate a warming and 15
increasing CO2saturation of surface waters in the Eastern North Atlantic (Fig. 3a, b). These general trends were observed under conditions of decreasing North Atlantic Os-cillation index (NAO) (Osborn, 2007; Gonz ´alez-Davila et al., 2007) that describes the influence of large-scale atmospheric pressure structures on warming and air-sea CO2 disequilibrium of surface waters (L ¨uger et al., 2004; Omar and Olsen, 2006; Schuster
20
and Watson, 2007). The freshening of surface waters was also evident, except in the case of the CC province, where this was not significant (Fig. 3b) due to the weaken-ing of local mixweaken-ing processes and shifts in northward advection of less saline waters (Santana-Casiano et al., 2007). A significant WS decrease of−0.30±0.07 m s−1yr−1
was appreciated during the spring cruises (Fig. 3b). Also during spring a long-term
25
trend of chl-a(−0.3±0.1 mg m−3yr−1) revealed a reduction in the photosynthetic
activ-ity of oligotrophic waters in the NEC province (Fig. 4c).
BGD
6, 5589–5622, 2009Air-sea CO2 fluxes in the Atlantic
X. A. Padin et al.
Title Page
Abstract Introduction
Conclusions References
Tables Figures
◭ ◮
◭ ◮
Back Close
Full Screen / Esc
Printer-friendly Version
Interactive Discussion of SSS (−0.16±0.01 yr−1) in its North Atlantic end during the autumn season
pro-voked by an increase of rainfall rates and riverine inputs from the Amazon River (Fig. 3d). The freshening of these waters coincided with an outstanding ∆fCO2 reduction (−3.5±0.9µatm yr−1) and a consequent rise in the oceanic CO2 uptake
(−0.09±0.03 mol m−2yr−1). The fertilization of tropical surface waters from
continen-5
tal discharges seems to have stimulated the biological CO2drawdown (Lefevre et al.,
1998), even though no significant response was detected in terms of chl-a. In any case, these observed interannual variability in the western basin of the NECC province backs up the influential role of the Amazon River plume in the uptake of CO2 (Subramanian
et al., 2008).
10
In the equatorial upwelling sector of the SEC province an interannual surface warming of 0.11±0.03◦C yr−1 during the spring season was observed parallel to a
WS decrease of −0.58±0.14 m s−1yr−1 that suggest weaker inputs of colder
sub-surface waters (Fig. 3e). In addition, coarsely trended drops in SSS, ∆fCO2 and FCO2 were observed along the equator. Similarly, a decrease in the WS field of 15
−0.50±0.11 m s−1yr−1 was also found of the SAS province (Fig. 3g), with maximum
troughs of−1.24±0.26 m s−1yr−1 in the SAC region (Fig. 3h). Furthermore, several
year-to-year changes envisaged in the Patagonian Sea (Fig. 3g, h, i) are expected to be of especial relevance in the convergence region of the Brazil and Falkland Currents, where the formation of Central Waters takes place (Fig. 3h).
20
3.4 Analysis of the biogeochemical forcing on thefCOsw2 variability
ThefCOsw2 measurements gathered during the FICARAM cruises were modelled with an empirical algorithm according to their biogeochemical variability and geographical position, distinguishing ocean areas from shelf areas. Prior to making this multiple re-gression, all measurements were referenced to their respective months of year 2005,
25
mea-BGD
6, 5589–5622, 2009Air-sea CO2 fluxes in the Atlantic
X. A. Padin et al.
Title Page
Abstract Introduction
Conclusions References
Tables Figures
◭ ◮
◭ ◮
Back Close
Full Screen / Esc
Printer-friendly Version
Interactive Discussion surement date and the one in 2005. The effect of temperature on thefCOsw2
measure-ments was removed by normalising the observations to the mean in situ SST of the above-listed regions, after Takahashi et al. (1993). This new normalised and corrected variable (′fCOsw2 ) was finally used to obtain the aforementioned empirical algorithm, given in Eq. (4). Since the ′fCOsw2 variability in each region was fitted from a single
5
algorithm for both southward and northward cruises, a seasonal bias towards autumn conditions could be affecting our results, given the small amount of spring cruises available. The multiple linear regression coefficients were obtained using a forward stepwise method where only parameters that accounted for at least 1% of the′fCOsw 2
variability were included in the algorithm.
10
′fCOsw
2 =A+B lon+C lat+D chl−a+ 3
X
i=1
ϕi(SST−µSST)i +βi(SSS−µSSS)i
(4)
The µSST and µSSS stand for averages value of SST and SSS, respectively
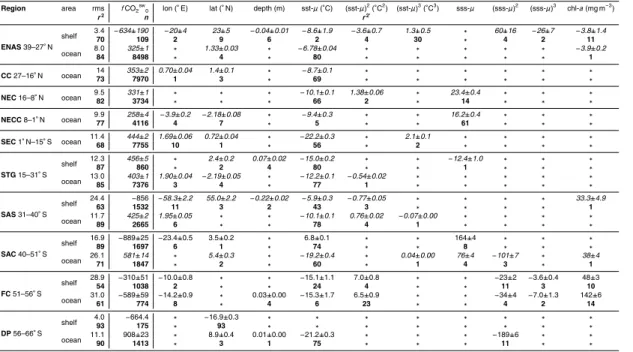
(Ta-ble 2). The regression coefficients for Eq. (4) and the percentage offCOsw2 variability explained by each parameter in the different provinces are given in Table 3. Generally, SST is the parameter that determines most of thefCOsw2 variability, particularly in
sub-15
tropical waters (>80% in the ENAS and STG provinces, with root mean square errors of 8µatm and 13µatm, respectively), as shown previously (Lefevre and Taylor, 2002). On the contrary, in subtropical shelf regions the importance of the SST coefficient re-mained only true in the STG province, while in the distal shelf of the ENAS region the
fCOsw2 variability explained by this factor drops down to 36%. This set forth the relevant
20
role of the biological CO2drawdown factor, which showed an outstanding influence of
11% in the coastal fCOsw2 variability in this part of the North-West African upwelling system. Although the forcing of phytoplankton activity accounted only for 1% of the
fCOsw2 variability, this was rather significant in ocean waters of the ENAS province, indicating the relevance of offshore influence from upwelling events (Hill et al., 1998).
25
BGD
6, 5589–5622, 2009Air-sea CO2 fluxes in the Atlantic
X. A. Padin et al.
Title Page
Abstract Introduction
Conclusions References
Tables Figures
◭ ◮
◭ ◮
Back Close
Full Screen / Esc
Printer-friendly Version
Interactive Discussion weight in Eq. (4), explaining 14% of the fCOsw2 variability. This rising dominance of
SSS over the rest of the considered explanatory variables reaches its maximum in the southernmost waters of the NECC region. Here, SSS is able to account for 61% of the observed fCOsw2 variability, showing a clear direct relationship of 16.2±0.4µatm
per SSS unit. This finding confirms the biological CO2 uptake, largely dependant on 5
the Amazon outflow (Muller-Karger et al., 1988) as the interannual analysis suggested. In the equatorial upwelling system the weight of SSS vanishes and SST variability comes to be again the main factor affecting fCOsw2 (58% of its variability explained) and shows the strongest SST-∆fCO2 dependence (−22.2±0.3µatm◦C−
1
) registered during the FICARAM project. This exceptional correlation points towards the existence
10
of a meridional distribution of different waters in the equatorial region, probably associ-ated with the ventilation of upwelled subsurface waters.
Regarding the Southern Hemisphere, the observedfCOsw2 variability was poorly re-solved by Eq. (4) compared to the northern provinces, likely due to a larger coastal in-fluence. The observed heterogeneousfCOsw2 fields also handicapped an adequate
de-15
scription of these regions from the sole information gathered in surface layer sampling along the tracks of the ships, which often run closely from several frontal regions. Some remarkable differences between the in situ and modelledfCOsw2 values in the SAS and SAC provinces exceeded 20µatm. The maximum discrepancies correspond to the shelf and ocean regions of the FC province (28.9 and 31.0µatm, respectively). The
ex-20
tremely complex and turbulent hydrographical conditions of the Southern Ocean make that non-linear interactions of the explanatory variables in Eq. (4), like SST2 or SSS2, gain importance over the rest in the Patagonian Sea. Similarly, the chla distribution, which has an outstanding influence on thefCOsw2 in these regions, showed opposite regression coefficients to the expected ones. The positive correlations found between
25
fCOsw2 -chl-a can be explained by some oceanographic processes of the Patagonian Sea (Bianchi et al., 2009), such as the intensefCOsw2 input from upwelling events and remineralization processes make the biological drawdown of CO2 hardly noticeable
BGD
6, 5589–5622, 2009Air-sea CO2 fluxes in the Atlantic
X. A. Padin et al.
Title Page
Abstract Introduction
Conclusions References
Tables Figures
◭ ◮
◭ ◮
Back Close
Full Screen / Esc
Printer-friendly Version
Interactive Discussion on thefCOsw2 signals could easily be held responsible for the positive regression coeffi
-cients throughout the entire non-synoptic sampling strategies followed in the FICARAM project.
On the southernmost waters of the DP province, the empirical algorithm obtained for computing autumnfCOsw2 measurements yielded an error of 11.1µatm, in spite of
5
the difficulties in reconstructing fCOsw2 in these waters from different methods (Metzl et al., 1995; Louanchi et al., 1996; Takahashi et al., 1997). The SST again played a key role in explaining 75% of the fCOsw2 variability, showing a high regression coef-ficient (−21.2±0.3µatm◦C−1) similarly to the SEC region that is another well-known
upwelling system, like the Southern Ocean. Regarding shelf waters, the fCOsw2
dis-10
tribution only showed significant correlation with latitude, which acts as a proxy of the clearly observed biochemical changes under the coastal influence. With the exception of the latter result, geographical information had generally little importance in the diff er-ent algorithms, suggesting that the selected provinces used to analyse the FICARAM dataset were rather well defined.
15
4 Summary
The FICARAM programme has proved to be an initiative of importance in collecting underwayfCOsw2 measurements that covered an ample assort of hydrographic regions along the Atlantic Ocean over almost a decade. The obtained surface fields offCOsw2 registered some general annual trends of the air-sea CO2 exchanges in the Atlantic
20
Ocean and, importantly, have allowed detecting some changes in the long-term trends of the fluxes and analysing the biogeochemical forcing of thefCOsw2 variability. The most remarkable results obtained are:
– The Northern Subtropical Gyre has acted as a sink of atmospheric CO2 during
the successive spring seasons (−1.8±1.2 mol m−2yr−1) and as a source during
25
South-BGD
6, 5589–5622, 2009Air-sea CO2 fluxes in the Atlantic
X. A. Padin et al.
Title Page
Abstract Introduction
Conclusions References
Tables Figures
◭ ◮
◭ ◮
Back Close
Full Screen / Esc
Printer-friendly Version
Interactive Discussion ern Hemisphere absorbed CO2under spring conditions (−0.2±0.7 mol m−
2
yr−1), while CO2 outgasing occurred during autumn (0.6±0.6 mol m−
2
yr−1). The sea-sonal distribution offCOsw2 in these latitudes was mainly determined by changes in SST that explained more than 80% of the fCOsw2 variability, according to the proposed algorithm.
5
– Tropical waters were virtually in equilibrium with the atmosphere during spring and autumn, which yielded trifling air-sea CO2 fluxes, especially in the NECC
region. The analysed property distributions in the latter province revealed a sig-nificant long-term decrease of SSS (−0.16±0.01 yr−1) during the boreal autumn,
parallel to an outstanding∆fCO2reduction (−3.5±0.9µatm yr− 1
) and its
associ-10
ated rise of oceanic CO2 uptake (−0.09±0.03 mol m− 2
yr−1). These strong SSS changes produced by the Amazon River outflows accounted for 61% of the ob-servedfCOsw2 variability, providing uplift to the role of freshwater discharges in the uptake of CO2.
– The equatorial upwelling system was highly supersaturated with CO2 during the 15
whole FICARAM project. This state eventually reached southern latitudes during the autumn season. An interannual surface warming of 0.11±0.03◦C yr−1 and
a WS decrease of −0.58±0.14 m s−1yr−1 characterized these waters during the
successive spring cruises, which suggests weaker inputs of colder subsurface waters.
20
– The majority of provinces in the Patagonian Sea behaved as an intense sink of CO2 during autumn and spring, in particular the oceanic waters of the SAC province that were the strongest CO2sink (−5.4±3.6 mol m−2yr−1) registered by
the FICARAM cruises. The surface waters of the Patagonian shelf showed abrupt changes in the∆fCO2andFCO2 distributions that could not be satisfactorily ex-25
BGD
6, 5589–5622, 2009Air-sea CO2 fluxes in the Atlantic
X. A. Padin et al.
Title Page
Abstract Introduction
Conclusions References
Tables Figures
◭ ◮
◭ ◮
Back Close
Full Screen / Esc
Printer-friendly Version
Interactive Discussion
– The Antarctic waters in the Drake Passage were found to be CO2 undersatu-rated during the boreal autumn. They showed a clear southward decrease of ∆fCO2, towards the Continental Water Boundary. The oceanic waters of this
re-gion displayed an average uptake rate of −1.1±0.9 mol m−2yr−1, as opposed to
those in the distal shelf, which acted as a slight source of CO2to the atmosphere
5
(0.1±0.3 mol m−2yr−1).
Acknowledgements. We would like to extend our gratitude to the Captains and crew of B/O
Hesp ´erides and B/O Las Palmas for their hospitality and essential help, and to the UTM team for their technical and logistic support throughout the nine years of FICARAM cruises. This study was developed and funded by the European Commission within the 6th Framework
10
Programme (EU FP6 CARBOOCEAN Integrated Project, Contract no. 511176), the Spanish research project FICARAM (CICYT. REN 2000-2467-E and 2001-4839-E), Ministerio de Edu-caci ´on y Ciencia (CTM2006-27116-E/MAR) and Xunta de Galicia (PGIDIT05PXIC40203PM).
References
Arrigo, K. R., Worthen, D., Lizotte, D. L., Dixon, P., and Dieckman, G.: Primary production in
15
Antarctic sea ice, Science, 276, 394–397, 1997.
Bakun, A. and Parrish, R. H.: Comparative studies of coastal pelagic fish reproductive habitats: the anchovy (Engraulis anchoita) of the southwestern Atlantic, ICES J. Mar. Sci.: J. Conseil, 48, 343–361, 1991.
Barton, E. D.: Ocean Currents: Atlantic Eastern Boundary-Canary Current/Portugal Current,
20
Encyclopedia of Ocean Sciences, edited by: Steele, J., Thorpe, S., and Turekian, K., Aca-demic Press, London, 1, 380–389, 2001.
Battle, M., Bender, M. L., Tans, P. P., White, J. W. C., Ellis, J. T., Conway, T., and Francey, R. J.: Global carbon sinks and their variability inferred from atmospheric O2and delta C13, Science, 287, 2467–2470, 2000.
25
Bianchi, A. A., Giulivi, C. F., and Piola, A. R.: Mixing in the Brazil-Malvinas confluence, Deep-Sea Res. Pt. II, 40, 1345–1358, 1993.
BGD
6, 5589–5622, 2009Air-sea CO2 fluxes in the Atlantic
X. A. Padin et al.
Title Page
Abstract Introduction
Conclusions References
Tables Figures
◭ ◮
◭ ◮
Back Close
Full Screen / Esc
Printer-friendly Version
Interactive Discussion F.: Vertical stratification and air-sea CO2 fluxes in the Patagonian shelf, J. Geophys.
Res.-Oceans, 110, C07003, doi:10.1029/2004JC002488, 2005.
Bianchi, A. A., Pino, D. R., Perlender, H. G. I., Osiroff, A. P., Segura, V., Lutz, V., Clara, M. L., Balestrini, C. F., and Piola, A. R.: Annual balance and seasonal variability of sea-air CO2 fluxes in the Patagonia Sea: Their relationship with fronts and chlorophyll distribution, J.
5
Geophys. Res.-Oceans, 114, C03018, doi:10.1029/2008JC004854, 2009.
Blain, S., Tr ´eguer, P., Belviso, S., Bucciarelli, E., Denis, M., Desabre, S., Fiala, M., Martin J ´ez ´equel, V., Le F `evre, J., and Mayzaud, P.: A biogeochemical study of the island mass effect in the context of the iron hypothesis: Kerguelen Islands, Southern Ocean, Deep-Sea Res. Pt. I, 48, 163–187, 2001.
10
Canadell, J. G., Le Qu ´er ´e, C., Raupach, M. R., Field, C. B., Buitenhuis, E. T., Ciais, P., Conway, T. J., Gillett, N. P., Houghton, R. A., and Marland, G.: Contributions to accelerating atmo-spheric CO2growth from economic activity, carbon intensity, and efficiency of natural sinks, P. Natl. Acad. Sci. USA, 104, 10288–10293, 2007.
Chen, C. T. A. and Borges, A. V.: Reconciling opposing views on carbon cycling in the coastal
15
ocean: Continental shelves as sinks and near-shore ecosystems as sources of atmospheric CO2, Deep-Sea Res. Pt. II, doi:10.1016/j.dsr2.2009.01.001, 2009.
DOE: Handbook of methods for the analysis of various parameters of carbon dioxide in seawa-ter (version 2), 1994.
Emery, W. J. and Dewar, J. S.: Mean temperature-salinity, salinity-depth and temperature-depth
20
curves for the North Atlantic and the North Pacific, Prog. Oceanogr., 11, 219–305, 1982. Francey, R. J., Tans, P. P., Allison, C. E., Enting, I. G., White, J. W. C., and Trolier, M.: Changes
in oceanic and terrestrial carbon uptake since 1982, Nature, 373, 326–330, 1995.
Froneman, P. W., McQuaid, C. D., and Laubscher, R. K.: Size-fractionated primary production sudies in the vicinity of the Subtropical Front and an adjacent warm-core south of Africa in
25
austral winter, J. Plankton Res., 21, 2019–2035, 1999.
Gonz ´alez-D ´avila, M., Santana-Casiano, J. M., and Gonz ´alez-D ´avila, E. F.: Interannual variabil-ity of the upper ocean carbon cycle in the northeast Atlantic Ocean, Geophys. Res. Lett., 34, L07608, doi:10.1029/2006GL028145, 2007.
Gordon, A. L.: Brazil-Malvinas confluence-1984, Deep-Sea Res. Pt. II, 36, 359–384, 1989.
30
Guerrero, R., Acha, E., Framinan, M., and Lasta, C.: Physical oceanography of the River Plate Estuary, Argentina, Cont. Shelf Res., 17, 727–742, 1997.
BGD
6, 5589–5622, 2009Air-sea CO2 fluxes in the Atlantic
X. A. Padin et al.
Title Page
Abstract Introduction
Conclusions References
Tables Figures
◭ ◮
◭ ◮
Back Close
Full Screen / Esc
Printer-friendly Version
Interactive Discussion C.: Eastern ocean boundaries, Coastal segment (E), The Sea, 11, 29–65, 1998.
Hooker, S. B., Rees, N. W., and Aiken, J.: An objective methodology for identifying oceanic provinces, Prog. Oceanogr., 45, 313–338, 2000.
Hooker, S. B., Esaias, W. E., Feldman, G. C., Gregg, W. W., and McClain, C. R.: An overview of SeaWiFS and ocean colour, in: NASA Technical Memo 104566, edited by: Hooker, S.
5
B. and Firestone, E. R., vol. 1, NASA Goddard Space, Flight Centre, Greenbelt, MA, 1, 24 1992.
Houghton, R. A.: Revised estimates of the annual net flux of carbon to the atmosphere from changes in land use and land management 1850–2000, Tellus B, 55, 378–390, doi:10.1034/j.1600-0889.2003.01450.x, 2003.
10
Kalnay, E., Kanamitsu, M., Kistler, R., Collins, W., Deaven, D., Gandin, L., Iredell, M., Saha, S., White, G., and Woollen, J.: The NCEP/NCAR reanalysis project, B. Am. Meteorol. Soc., 77, 437–471, 1996.
Keeling, C. D.: Carbon dioxide in surface ocean waters, 4. Global distribution, J. Geophys. Res., 73, 4543–4553, 1968.
15
Keeling, C. D., Whorf, T. P., Wahlen, M., and Plicht, J.: Interannual extremes in the rate of rise of atmospheric carbon dioxide since 1980, Nature, 375, 666–670, 1995.
Keeling, C. D. and Whorf, T. P.: The 1800-year oceanic tidal cycle: A possible cause of rapid climate change, P. Natl. Acad. Sci. USA, 97(10), 3814–3819, 2000.
K ¨ortzinger, A., Thomas, H., Schneider, B., Gronau, N., Mintrop, L., and Duinker, J. C.: At-sea
20
intercomparison of two newly designed underway pCO2systems – encouraging results, Mar. Chem., 52, 133–145, 1996.
Lefevre, N., Moore, G., Aiken, J., Watson, A., Cooper, D., and Ling, R.: Variability of pCO2 in the tropical Atlantic in 1995, J. Geophys. Res., 103, 5623–5634, 1998.
Lefevre, N. and Taylor, A.: Estimating pCO2from sea surface temperatures in the Atlantic gyres,
25
Deep Sea Res. Pt. I, 49, 539–554, 2002.
Lef `evre, N., Watson, A. J., Olsen, A., R´ıos, A. F., P ´erez, F. F., and Johannessen, T.: A de-crease in the sink for atmospheric CO2in the North Atlantic, Geophys. Res. Lett, 31, L07306, doi:10.1029/2003GL018957, 2004.
Legendre, L., Ackley, S. F., Dieckmann, G. S., Gulliksen, B., Horner, R., Hoshiai, T., Melnikov, I.
30
A., Reeburgh, W. S., Spindler, M., and Sullivan, C. W.: Ecology of sea ice biota, Polar Biol., 12, 429–444, 1992.
BGD
6, 5589–5622, 2009Air-sea CO2 fluxes in the Atlantic
X. A. Padin et al.
Title Page
Abstract Introduction
Conclusions References
Tables Figures
◭ ◮
◭ ◮
Back Close
Full Screen / Esc
Printer-friendly Version
Interactive Discussion production in the ocean from satellite radiometer data, J. Plankton Res., 17, 1245–1271,
1995.
Louanchi, F., Mtzl, N., and Poisson, A.: Modelling the surface fCO2fields in the Indian ocean, Mar. Chem., 55, 265–279, 1996.
Luger, H., Wallace, D. W. R., Kortzinger, A., and Nojiri, Y.: The pCO2variability in the midlatitude
5
North Atlantic Ocean during a full annual cycle, Global Biogeochem. Cy., 18(3), GB3023, doi:10.1029/2003GB002200, 2004.
Metzl, N., Beauverger, C., Brunet, C., Goyet, C., and Poisson, A.: Surface water carbon dioxide in the southwest Indian sector of the Southern Ocean: a highly variable CO2 source/sink region in summer, Mar. Chem., 35, 85–95, 1991.
10
Metzl, N., Tilbrook, B., and Poisson, A.: The annual fCO2cycle and the air-sea CO2flux in the sub-Antarctic Ocean, Tellus B, 51, 849–861, 1999.
Metzl, N.: Air-sea CO2fluxes in the Southern Ocean: natural and methodological variabilities, SOLAS Open Conference, Halifax, 13–16 October, 2004.
Metzl, N., Poisson, A., Louanchi, F., Brunet, C., Schauer, B., and Bres, B.: Spatio-temporal
15
distributions of air-sea fluxes of CO2in the Indian and Antarctic oceans, Tellus, 47B, 56–99, 1995.
Mittelstaedt, E.: The ocean boundary along the northwest African coast: circulation and oceanographic properties at the sea surface, Prog. Oceanogr., 26, 307–355, 1991.
Muller-Karger, F. E., McClain, C. R., and Richardson, P. L.: The dispersal of the Amazon’s
20
water, Nature, 333, 56–59, 1988.
Nowlin Jr., W. D. and Klinck, J. M.: The physics of the Antarctic Circumpolar Current, Geophys. Res. Lett, 24, 469–491, 1986.
Olsen, A., Trinanes, J. A., and Wanninkhof, R.: Sea-air flux of CO2 in the Caribbean Sea estimated using in situ and remote sensing data, Remote Sens. Environ., 89, 309–325,
25
2004.
Omar, A. M. and Olsen, A.: Reconstructing the time history of the air-sea CO2 disequilibrium and its rate of change in the eastern subpolar North Atlantic, 1972–1989, Geophys. Res. Lett, 33, L04602, doi:10.1029/2005GL025425, 2006.
Osborn, T.: North Atlantic Oscillation index data, http://www.cru.uea.ac.uk/∼timo/projpages/
30
nao update.htm, 2007.
BGD
6, 5589–5622, 2009Air-sea CO2 fluxes in the Atlantic
X. A. Padin et al.
Title Page
Abstract Introduction
Conclusions References
Tables Figures
◭ ◮
◭ ◮
Back Close
Full Screen / Esc
Printer-friendly Version
Interactive Discussion Syst., 66, 285–296, doi:10.1016/j.jmarsys.2006.05.010, 2007.
Padin, X. A., Castro, C. G., R´ıos, A. F., and P ´erez, F. F.: fCO2sw variability in the Bay of Biscay during ECO cruises, Cont. Shelf Res., 28, 904–914, 2008.
P ´erez, F. F., R´ıos, A. F., and Ros ´on, G.: Sea surface carbon dioxide offthe Iberian peninsula (North Eastern Atlantic Ocean), J. Marine Syst., 19, 27–46, 1999.
5
Perissinotto, R., Laubscher, R. K., and McQuaid, C. D.: Marine productivity enhancement around Bouvet and the South Sandwich Islands (Southern Ocean), Mar. Ecol.-Prog. Ser., 88, 41–53, 1992.
Perissinotto, R., Lutjeharms, J. R. E., and van Ballegooyen, R. C.: Biological-physical interac-tions and pelagic productivity at the Prince Edward Island, Southern Ocean, J. Marine Syst.,
10
24, 327–341, 2000.
Piola, A. R. and Rivas, A. L.: Antecedentes hist ´oricos de las exploraciones en el mar y las caracter´ısticas ambientales, Corrientes en la Plataforma Continental, in: El Mar Argentino y sus Recursos Pesqueros, edited by: Boschi, E. E., Instituto Nacional de Investigaci ´on y Desarrollo Pesquero, Mar del Plata, 1, 119–132, 1997.
15
Poisson, A., Metzl, N., Brunet, C., Schauer, B., Bres, B., Ru´ız-Pino, D., and Louanchi, F.: Variability of sources and sinks of CO2 in the Western Indian and Southern Oceans during the year 1991, J. Geophys. Res., 98, 22759–22778, 1993.
R´ıos, A. F., P ´erez, F. F., and Fraga, F.: Water masses in the upper and middle North Atlantic Ocean east of the Azores, Deep-Sea Res. Pt. II, 39, 645–658, 1992.
20
Sabine, C. L., Feely, R. A., Gruber, N., Key, R. M., Lee, K., Bullister, J. L., Wanninkhof, R., Wong, C. S., Wallace, D. W. R., Tilbrook, B., Millero, F. J., Peng, T. H., Kozyr, A., Ono, T., and R´ıos, A. F.: The oceanic sink for anthropogenic CO2, Science, 305, 5682, 367–371, 2004. Santana-Casiano, J. M., Gonz ´alez-D ´avila, M., Rueda, M. J., Llin ´as, O., and Gonz ´alez-D ´avila, E.
F.: The interannual variability of oceanic CO2parameters in the northeast Atlantic subtropical
25
gyre at the ESTOC site, Global Biogeochem. Cy., 21, GB1015, doi:10.1029/2006GB002788, 2007.
Sarmiento, J. L. and Gruber, N.: Sinks for anthropogenic carbon, Phys. Today, 55, 30–36, 2002.
Schuster, U. and Watson, A. J.: A variable and decreasing sink for atmospheric CO2 in the
30
North Atlantic, J. Geophys. Res, 112, C11006, doi:10.1029/2006JC003941, 2007.
BGD
6, 5589–5622, 2009Air-sea CO2 fluxes in the Atlantic
X. A. Padin et al.
Title Page
Abstract Introduction
Conclusions References
Tables Figures
◭ ◮
◭ ◮
Back Close
Full Screen / Esc
Printer-friendly Version
Interactive Discussion Subramaniam, A., Yager, P. L., Carpenter, E. J., Mahaffey, C., Bj ¨orkman, K., Cooley, S., Kustka,
A. B., Montoya, J. P., Sa ˜nudo-Wilhelmy, S. A., and Shipe, R.: From the Cover: Amazon River enhances diazotrophy and carbon sequestration in the tropical North Atlantic Ocean, P. Natl. Acad. Sci. USA, 105, 10460–10465, 2008.
Takahashi, T.: Carbon dioxide in the atmosphere and in Atlantic ocean water, J. Geophys. Res.,
5
66, 477–494, 1961.
Takahashi, T., Olafsson, J., Goddard, J. G., Chipman, D. W., and Sutherland, S. C.: Seasonal variation of CO2 and nutrients in the high-latitude surface oceans: a comparative study, Global Biogeochem. Cy., 7, 843–878, 1993.
Takahashi, T., Feely, R. A., Weiss, R. F., Wanninkhof, R. H., Chipman, D. W., Surherland, S.
10
C., and Takahashi, T. T.: Global air-sea flux of CO2: An estimate based on measurements of sea-air pCO2difference, P. Natl. Acad. Sci. USA, 94, 8292–8299, 1997.
Takahashi, T., Sutherland, S. C., Wanninkhof, R., Sweeney, C., Feely, R. A., Chipman, D. W., Hales, B., Friederich, G., Chavez, F., Sabine, C., Watson, A. J., Bakker, D. C., Schuster, U., Metzl, N., Yoshikawa-Inoue, H., Ishii, M., Midorikawa, T., Nojiri, Y., K ¨ortzinger, A., Steinhoff,
15
T., Hoppema, M., Olafsson, J., Arnarson, T. S., Tilbrook, B., Johannessen, T., Olsen, A., Bellerby, R., Wong, C. S., Delille, B., Bates, N. R., and de Baar, H. J. W.: Climatological mean and decadal change in surface ocean pCO2, and net sea-air CO2flux over the global oceans, Deep-Sea Res. Pt. II, doi:10.1016/j.dsr2.2008.12.009, 2008.
Thomas, H., Bozec, Y., Elkalay, K., and De Baar, H. J. W.: Enhanced open ocean storage of
20
CO2 from shelf sea pumping, in: American Association for the Advancement of Science, 304, no. 5673, 1005–1008, 2004.
Trenberth, K. E., Large, W. G., and Olson, J. G.: The mean annual cycle in global ocean wind stress, J. Phys. Oceanogr., 20, 1742–1760, 1990.
Wanninkhof, R.: Relationship between wind speed and gas exchange over the ocean, J.
Geo-25
phys. Res., 97, 7373–7382, 1992.