The Cryosphere, 7, 201–204, 2013 www.the-cryosphere.net/7/201/2013/ doi:10.5194/tc-7-201-2013
© Author(s) 2013. CC Attribution 3.0 License.
Geoscientiic
Geoscientiic
Geoscientiic
Geoscientiic
The Cryosphere
Open Access
Brief Communication
“Expansion of meltwater lakes on the Greenland Ice Sheet”
I. M. Howat1, S. de la Pe ˜na1, J. H. van Angelen2, J. T. M. Lenaerts2, and M. R. van den Broeke2 1School of Earth Sciences and Byrd Polar Research Center, Ohio State University, Columbus, Ohio, USA 2Institute for Marine and Atmospheric Research, Utrecht University, Utrecht, the Netherlands
Correspondence to:I. M. Howat (ihowat@gmail.com)
Received: 4 October 2012 – Published in The Cryosphere Discuss.: 16 October 2012 Revised: 7 January 2013 – Accepted: 10 January 2013 – Published: 1 February 2013
Abstract.Forty years of satellite imagery reveal that meltwa-ter lakes on the margin of the Greenland Ice Sheet have ex-panded substantially inland to higher elevations with warm-ing. These lakes are important because they provide a mech-anism for bringing water to the ice bed, causing sliding. In-land expansion of lakes could accelerate ice flow by bringing water to previously frozen bed, potentially increasing future rates of mass loss. Increasing lake elevations closely follow the rise of the mass balance equilibrium line over much of the ice sheet, suggesting no physical limit on lake expansion. Data are not yet available to detect a corresponding change in ice flow, and the potential effects of lake expansion on ice sheet dynamics are not included in ice sheet models.
Expansion of meltwater lakes on the Greenland Ice Sheet
Seasonal melting of the surface of the Greenland Ice Sheet creates large volumes of meltwater. At low elevations, where melting is fastest and the surface is bare ice or a thin layer of firn, meltwater runoff collects in surface depressions to form supraglacial lakes. Tens to hundreds of thousands of these lakes dot the periphery of the ice sheet, covering the zone of bare ice and extending through elevations where the firn layer is seasonally saturated (i.e., the wet snow zone). Above this elevation, meltwater production is low enough, and the firn layer thick enough, that all meltwater permeates into the firn rather than collecting on the surface. Lakes influence the dy-namics of the ice sheet, because they provide a mechanism by which water can penetrate to the bed through hydraulic frac-turing (Das et al., 2008), raising basal water pressures and causing the ice to “slide” along the ice/bed interface.
Slid-ing causes the ice to flow faster, speedSlid-ing the transport of ice toward lower elevations and, potentially, increasing the rate at which the ice sheet will lose mass under climate warming (Zwally et al., 2002).
In areas that already undergo lake formation and pene-tration of water to the bed, additional meltwater should not substantially impact ice flow on annual timescales. This is because the relationship between meltwater production and ice motion is not proportional, but instead forms a hysteresis caused by the evolving efficiency of the subglacial drainage system as water is added (Schoof, 2010) . However, if warm-ing causes lakes to form at higher elevations, water may reach areas of previously frozen bed, increasing the speed and an-nual flux of ice to the margin. Increased penetration of melt-water would also heat the ice, reducing its effective viscos-ity and potentially increasing its flow speed (Phillips et al., 2010). Such processes are not yet included in prognostic ice sheet models.
The Greenland Ice Sheet has warmed substantially over the past two decades (Box et al., 2009; van den Broeke et al., 2009), lowering the surface mass balance and raising the el-evation at which ablation equals the snow accumulation (i.e., the equilibrium line altitude, or ELA). Therefore, if lake for-mation is dependent only on meltwater volume and firn layer thickness, we would expect lakes to form at correspondingly higher elevations. Previous work has shown that the distri-bution of lake surface area does shift to higher elevations in warmer years (Liang et al., 2012). However, a lack of surface undulations on thicker ice may prevent lakes from forming further inland. Thus it is unclear whether the zone of lake formation itself can expand higher under warming.
202 I. M. Howat et al.: Expansion of meltwater lakes on the Greenland Ice Sheet
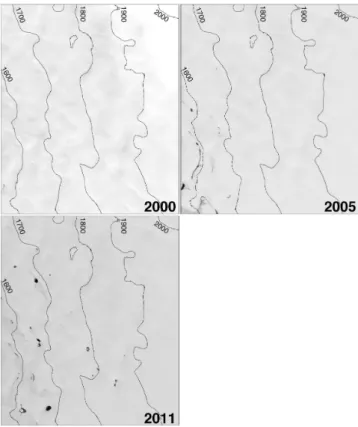
Fig. 1.Examples of stretched Landsat 7 ETM+images used to de-tect lakes from the region above Jakobshavn Isbrœ (region E in Fig. 2). Open water appears as dark patches. Elevation contours are overlain at 100 m intervals. The region extends 54 km in the east–west direction and 63 km in the north–south direction. The im-ages were obtained on 5 August 2000, 5 August 2005 and 13 Au-gust 2011.
To determine whether lakes are forming at higher eleva-tions, we examined high-resolution satellite imagery span-ning nearly four decades. The contrast in albedo between ice and water makes supraglacial lakes easily detectable in panchromatic band imagery with automated, statistical clas-sification procedures (Liang et al., 2012). We mapped the annual distribution of lakes in 12 study regions around the ice sheet between 1972 and 2012 using all available imagery from several different sensors for the months of July and Au-gust. We primarily utilized visible band data from the Land-sat series of Land-satellites, including the Multi-Spectral Scanner (60-m resolution, 1972–1984), Thematic Mapper (30-m res-olution, 1984 to present) and Enhanced Thematic Mapper-Plus (1999 to present, 15-m resolution). Landsat data were acquired from the US Geological Survey (http://glovis.usgs. gov/). Additionally, we used 15-m band-1 data from the Ad-vanced Spaceborne Thermal Emission and Reflection Ra-diometer (ASTER) on the Terra satellite, launched in 1999, acquired from the Land Process Distributed Active Archive (LPDAAC, https://lpdaac.usgs.gov/), and 5-m SPOT-5 im-agery acquired in 2007 and 2008 and provided by the Stereo-scopic survey of Polar Ice: reference Images and
Topogra-Fig. 2.Elevation of upper 0.1 km2of lake area within each study
area labeled A–L. Error bars result from the±0.05 uncertainty in
normalized radiance threshold for lake classification. Black curves are the average equilibrium line altitudes (ELA) for those regions smoothed with a 5-yr retrospective mean. ELA values are ex-tracted from the Regional Atmospheric Climate Model version 2 (RACMO2) (van Angelen et al., 2012).
phies (SPIRIT) program (Korona et al., 2009). All imagery was orthorectified by the data providers prior to distribution. Useable images were interpolated to a common reference grid in a polar stereographic projection and cropped to the regions of interest. Our analysis utilized a total of 402 indi-vidual scenes from 244 satellite passes over our regions of interest. Pixel elevations were extracted from a 30-m digital elevation model (http://bprc.osu.edu/GDG/gimpdem.php).
To classify pixels as surface water within each image, we employ the methodology of Liang et al. (2012), where a ra-diance value threshold is determined from the slope of the negative tail in the normalized image histogram. Since our regions of interest are small (tens of km across) and are only over the interior ice sheet, we use the normalized radiance rather than the reflectance difference within a moving win-dow employed by Liang et al. (2012). As in that study, we use a histogram slope threshold of 0.01, so that all pixels with radiance values below that point on the histogram are classified as lakes. A major benefit of this method is that the threshold of each image is calculated independently, so that
I. M. Howat et al.: Expansion of meltwater lakes on the Greenland Ice Sheet 203
no normalization between images is needed. Following au-tomated classification, each lake map is quality checked by a visual comparison to the source image, which is exponen-tially stretched to enhance the contrast between water and ice (Fig. 1). In a few cases, the automated procedure resulted in misclassification and the threshold was slightly adjusted to provide a more consistent classification with other images.
The dominant source of error in the lake area classification is uncertainty of the radiance threshold, as determined by his-togram slope. Through inspection of many images, we found that adjusting the normalized radiance threshold by±0.05 resulted in visually detectable classification errors. We there-fore use this range to estimate the uncertainty in our lake area measurements.
Individual lakes may form and drain rapidly over the course of a melt season. We therefore must assess the poten-tial effect of temporal sampling on our results. Johansson et al. (2013) found that lakes at high elevations typically appear for 20–30 days, peaking in early August, with a large degree of variability between years. When available, we chose mul-tiple scenes in both July and August of each year, combining the resulting maps to obtain a single map of maximum lake extent. We further tested any dependency of our results on sampling date by calculating the correlation between the day of acquisition and (i) acquisition year and (ii) maximum lake extent. In no case was the correlation significant at the 95 % level, with averagepvalues of 0.58 and 0.63 for (i) and (ii), respectively. Thus, while we cannot rule out that sampling in-terval influenced our results to some degree, the overall pat-tern from many time series is likely robust.
Figure 2 shows the elevation of the uppermost 0.1 km2of lake area for each study area grouped by region, which fol-lows the edge of lake extent while providing some spatial and temporal smoothing. We also calculated the elevations for the uppermost 0.05 and 0.2 km2 lake areas, but varying this parameter only shifts the curves, respectively, up and down, without substantially changing temporal variability. For areas with data in the 1970s and 1980s, we observe little change in lake elevation before the year 2000. Since 2000, however, all study areas have undergone an increase in lake elevation on the order of hundreds of meters and tens of km inland. Among the largest observed change is above the out-let glacier Jakobshavn Isbrœ (area E in Fig. 2), where lakes now extend to near 1900 m, approximately 30 km further in-land than before 2000 (Figs. 1 and 2). Areas to the south now have lakes extending well above 2000 m elevation.
In the absence of a physical limit on lake extent, we would expect increases in lake elevation to match increases in the ELA throughout the record. This appears to be the case in the southwest and most of the northwest (Fig. 2) where, dur-ing the past few years, both lakes and the ELA have climbed to their highest observed elevations. This pattern is less clear in East Greenland and above Humboldt Glacier (area I) in the far northwest where, after rising steeply early in the decade, lake elevations have not kept pace with the continued rise in
the ELA over the past several years. The eastern Greenland margin is several times steeper than its western counterpart and has a larger gradient in surface mass balance, potentially causing a longer lag time between rising of the ELA and thinning of the firn layer to allow lake formation. If this is the case, and the ELA remains elevated or rises further, we would expect lakes to continue to expand in those regions in the future as the firn layer thins and becomes saturated.
While these results confirm the substantial inland expan-sion of meltwater lakes on the ice sheet over the past decade, data are not yet available to investigate a corresponding change in ice dynamics. High accumulation rates in the in-terior hamper space-based measurements of ice flow speed, and those data are generally restricted to the winter months (e.g., Joughin et al., 2010). Ground-based GPS measure-ments are the only current means of detecting such a change, but these data are lacking. These results point to how lit-tle is known about the response of the interior ice sheet to widespread forcing at its margin.
Acknowledgements. This work was funded by grants NNX11AR47G and NNX10AN61G to I. M. Howat from the US National Aeronautics and Space Administration.
Edited by: J. L. Bamber
References
Box, J. E., Yang, L., Bromwich, D. H., and Bai, L. S.: Greenland Ice Sheet Surface Air Temperature Variability: 1840–2007, J. Clim., 22, 4029–4049, 2009.
Das, S. B., Joughin, I., Behn, M. D., Howat, I. M., King, M. A., Lizarralde, D., and Bhatia, M. P.: Fracture propagation to the base of the Greenland Ice Sheet during supraglacial lake drainage, Science, 320, 778–781, 2008.
Johansson, A. M., Jansson, P., and Brown, I. A.: Spatial and tem-poral variations in lakes on the Greenland Ice Sheet, J. Hydrol., 476, 314–320, 2013.
Joughin, I., Smith, B. E., Howat, I. M., Scambos, T., and Moon, T.: Greenland flow variability from ice-sheet-wide velocity map-ping, J. Glaciol., 56, 415–430, 2010.
Korona, J., Berthier, E., Bernard, M., R´emy, F., and Thouvenot, E.: SPIRIT. SPOT 5 stereoscopic survey of Polar Ice: Reference Im-ages and Topographies during the fourth International Polar Year (2007–2009), Photogramm. Eng. Rem. S., 64, 204–212, 2009. Liang, Y. L., Colgan, W., Lv, Q., Steffen, K., Abdalati, W., Stroeve,
J., Gallaher, D., and Bayou, N.: A decadal investigation of supraglacial lakes in West Greenland using a fully automatic detection and tracking algorithm, Remote Sens. Environ., 123, 127–138, 2012.
Phillips, T., Rajaram, H., and Steffen, K.: Cryo-hydrologic warming: A potential mechanism for rapid thermal re-sponse of ice sheets, Geophys. Res. Lett., 37, L20503, doi:10.1029/2010GL044397, 2010.
Schoof, C.: Ice-sheet acceleration driven by melt supply variability, Nature, 468, 803–806, 2010.
204 I. M. Howat et al.: Expansion of meltwater lakes on the Greenland Ice Sheet
Van Angelen, J. H., Lenaerts, J. T. M., Lhermitte, S., Fettweis, X., Kuipers Munneke, P., van den Broeke, M. R., van Meijgaard, E., and Smeets, C. J. P. P.: Sensitivity of Greenland Ice Sheet surface mass balance to surface albedo parameterization: a study with a regional climate model, The Cryosphere, 6, 1175–1186, doi:10.5194/tc-6-1175-2012, 2012.
Van den Broeke, M., Bamber, J., Ettema, J., Rignot, E., Schrama, E., van de Berg, W. J., van Meijgaard, E., Velicogna, I., and Wouters, B.: Partitioning Recent Greenland Mass Loss, Science, 326, 984– 986, 2009.
Zwally, H. J., Abdalati, W., Herring, T., Larson, K., Saba, J., and Steffen, K.: Surface melt-induced acceleration of Greenland ice-sheet flow, Science, 297, 218–222, 2002.