A. De Iorio et alii, Frattura ed Integrità Strutturale, 30 (2014) 578-592; DOI: 10.3221/IGF-ESIS.30.69
578
Transverse strength of railway tracks: part 2.
Test system for ballast resistance in line measurement
Antonio De Iorio
Polytechnic School of Basic Sciences, Federico II University, Naples, Italy
Marzio Grasso, Francesco Penta, Giovanni Pio Pucillo, Vincenzo Rosiello
DII - Department of Industrial Engineering, Federico II University, Naples, ItalyABSTRACT. In the present paper, testing methods currently adopted to measure the in service ballast resistance are synthetically reviewed to identify the main sources of uncertainty influencing the test loads and to define an experimental methodology allowing the optimal control of the testing parameters without the introduction of spurious or parasitic actions on the track sample. An alternative testing system, which allows applying on a full-scale sample of a railway track testing loads very close the real ones, is presented. Of the new system, both the ways of use for measuring the transversal and axial ballast strength, the general procedure to carry out the experimentation and its application to a real scenario are described, highlighting its main advantages in terms both of modalities for applying the loads and of testing parameter control.
KEYWORDS. Ballast resistance; Track stability; Full scale test; CWR track; Railway track; Test system.
INTRODUCTION
o the remarkable advantages that the Continuous Welded Rail (CWR) offers in terms of maintenance, comfort and performances when compared to the traditional solutions, some disadvantages are unavoidably associated, the most important of which is the buckling tendency. This phenomenon often occurs on the horizontal plane (buckling cases on the vertical plane are much less frequent [1]), in presence of very small alignment defects of the rails or near to the curved sections, bridges and switches, when the rails temperature, due to the sun irradiation or the massive use of the induction brakes [2], increases beyond a given limit or when the neutral temperature decreases under the actions exerted by the rolling stocks [2-6].
It is known that the loads exerted by the trains (caused for instance by lateral uncompensated accelerations, bumpy ride of the bogies, skew ride of the bogies, longitudinal actions) can determine that the lateral strength limits are trespassed [7]. The combined effect of the longitudinal compression loads due to the breaking (which add to the ones of thermal nature already present in the track) and the up-lift phenomenon of the short track segment included between two consecutive bogies, which is responsible of track lateral strength decrease, can also very often create, the most favourable conditions for the buckling initiation.
Therefore, it is evident that, given all the other causes and conditions determining the buckling initiation, the ballast transversal strength plays an essential role on the track safety margin against the thermal buckling phenomenon and that
A. De Iorio et alii, Frattura ed Integrità Strutturale, 30 (2014) 578-592; DOI: 10.3221/IGF-ESIS.30.69
579
this parameter is strongly depending on all those constructive factors that define the instantaneous and local scenarios of a railway network.
That circumstance probably justifies the limited availability in literature, despite the great deal of research activities carried out during the last two decades (See [8], i. e.) of tools and procedures useful for the railway engineers in performing the most suitable technical choices to realize a better economy and a higher safety.
The difficulties and the costs of a systematic experimental activity to be carried out on full-scale track segments, together with the incompleteness of the data obtained so far, have also conditioned the activities of those researchers who have faced the problem of the track mechanical modelling. For a track model to give reliable or accurate previsions, a great deal of experimental data is needed and an extensive validation study has to be done.
In the present paper, in order to contribute to fill the existent gaps in the knowledge of the ballast mechanical behaviour, the Authors present a new in field-verified experimental methodology able to give useful data both for assessing the safety margins against the thermal buckling of a given number of scenario’s and for validating new numerical purpose-made track model.
BALLAST RESISTANCE
he main constraint actions exerted by the ballast against the track panel tendency to bend, when subjected to a critical axial load, are applied on the interface surfaces with the sleepers. These actions are essentially directed parallel to the top of rail plane. Ballast actions in the plane normal to this latter, tending to stabilize the track in the vertical plane, are very negligible when compared to the track weight. Furthermore, the component of the constraint action along the direction transversal to the track, termed ballast lateral strength, undoubtedly is the most significant [7, 9, 10, 11]. Mostly it is the lateral strength due to the friction between the sleepers base and the ballast, but significant contributions to the lateral strength are also given by the ballast volumes near the sleepers heads (ballast shoulders) and those in between the sleepers.
A generally accepted approximate classification of the relative magnitudes of the various ballast contributions to the track lateral strength and of the ones due to the bending strength of the rails and the torsional strength of the fastening system is reported in Tab. 1.
Track Lateral Resistence
{
Bottom 25 %
Ballast 60 % Crib 25 %
Shoulder 10 %
Fastening 30 %
Rail 10 %
Table 1: Roughly estimation of the different contributions to the track lateral strength.
The relative magnitudes of the ballast contributions change according to a non-linear function of the track weight [7, 12, 13]. However, when the available data refer to tests conducted with only two values of the vertical load, in absence of other information, for sake of simplicity, a linear relationship is assumed in order to estimate the sleepers base contribution.
In addition, the sleeper geometry and the fastening systems typology affect the ballast lateral resistance value: when the track moves laterally, the sleepers can stay parallel to each other or suffer a relative rotation [14].
Finally, also the maintenance services can affect the track lateral strength. It has been evaluated that each track realignment practically halves (-40%) the lateral strength, which is totally recovered only after that the transits of, at least, hundreds of train has newly compacted the ballast [2].
The ballast lateral strength plays an important role also in contrasting the track tendency to displace in the curves because of the thermal compression and expansion of the rails [6]. For this reason, the continuous welded rail is not employed for curves having radius lower than a threshold value. As an example, the minimum values of the curve radii and the corresponding sizes of the ballast shoulder are given in ref. 6 as function of the sleeper type adopted for the track. In order to improve the track lateral strength, often in the curves having reduced radius, lateral shovels (also referred to as sleeper anchors) [15] are adopted. This solution is mainly used in Europe and, however, it involves an additional cost.
A. De Iorio et alii, Frattura ed Integrità Strutturale, 30 (2014) 578-592; DOI: 10.3221/IGF-ESIS.30.69
580
Several experimental studies have been carried out by different Research Agencies to evaluate the ballast lateral strength as a function of the geometrical parameters of the track cross section [3, 6, 7]. Unfortunately, most of these studies are incomplete and allow only for a qualitative grasp of the ballast behaviour. Very often, the experimental programme has not been finished [7] or has been virtually completed through the estimate of some variables and not by means of a direct measurement [7].
EXPERIMENTAL TECHNIQUE TO MEASURE THE BALLAST RESISTANCE.
t present, two experimental techniques are adopted for determining the ballast lateral and axial strength: the Single Tie Push Test (STPT) and the Discrete Cut Panel Pull Test (DCPPT).
In the STPT [16], a displacement is gradually imposed to a single sleeper, along its own longitudinal axis, and the corresponding values of strength offered by the ballast are recorded. In particular, the tested sleeper is first disconnected from the track, then it is moved in the lateral direction by an actuator whose cylinder body is fastened to the sleeper and its piston rod pushes against the rail working as a fixed constraint of contrast (see Fig. 1, as example).
Figure 1: STPT configuration.
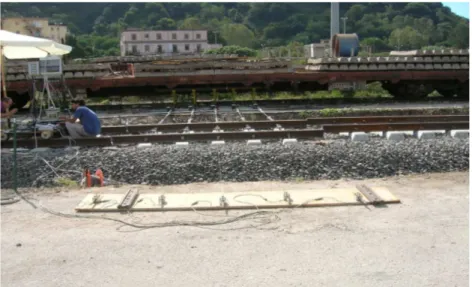
In this case, therefore, the test load is applied nominally along a direction that is tangent to the sleeper free surface, on a sleeper region that cannot be unambiguously defined in relation to the parameter to be measured, and with an arm that is equal to the distance of the actuator axis from this surface when the parallelism between these geometrical beings is granted. Before the test, in addition to the fastening systems, the under rails pads are also removed. However, these latter, during the tests carried out on continuous welded rail with a vertical load applied on it, are replaced by lubricated steel plates of the same thickness. Since the vertical load is realised by the weight of an wagon axles positioned in correspondence of the sleeper under test, the steel plates allows to transfer to the sleeper the maximum part of the vertical load applied to rails (see Fig. 2 and 3).
A. De Iorio et alii, Frattura ed Integrità Strutturale, 30 (2014) 578-592; DOI: 10.3221/IGF-ESIS.30.69
581 Figure 3: STPT for the loaded cutted track.
This testing method has several positive aspects; the most important of which is the operative simplicity. However, it leads to results affected by large uncertainty, mainly due to the following reasons:
• it is implicitly assumed that the edge effects, caused by the fixed sleepers contiguous to the one connected to the actuator, are absent. Actually during the buckling phenomenon interferences are present among the sleeper pressure cones, both in the vertical direction and in the lateral one,;
• the load applied to the sleeper can have a parasitic component orthogonal to the sliding plane of the sleeper whose amplitude and application point are difficult to evaluate.
• finally, when the tests is carried out with a vertical load, it is impossible to accurately evaluate the part transferred to the sleeper, both when the vertical load is applied to a continuous rail and when short rails are used. Moreover, both the friction forces among rails, plates and sleepers, that are present when the test is on a sectioned track, and the forces contrasting the bogie rotation in the top of rail, due to the sleeper displacement during a test on short rails, are totally neglected.
The other experimentation technique, denominated DCPPT [7], requires the sectioning of a short track segment to which a displacement is imposed in the plane where the slippers are laid, along the direction in which the ballast resistance has to be measured. For this reason, this technique is highly destructive and more expensive than the first one. For these reasons, it is rarely adopted.
The short track segment under test usually includes four or five sleepers and has a geometry reproducing a given scenario. Once it has been sectioned, the desired displacement is imposed by loads applied by actuators acting in several points of a single rail, if the ballast lateral strength has to be determined, or at the ends of the rails in the case of axial strength measurements.
The typical setup used for the lateral strength measurement includes an actuator pushing on one of the rails of the track segment by means of a cluster fixture. This latter allows to distribute the testing load on several points. An example of this type of fixture is sketched in Fig. 4 [7].
For the axial strength measurement, the experimental setup is simpler. When the cluster equipment is not adopted to transfer the load (Fig. 4), two actuators, one per each rail, are used. During the testing, they must be controlled to work in synchrony to apply simultaneously the same loading ramp to both rails (Fig. 5a and 5b).
The DCPPT presents the evident disadvantage, in comparison with the STPT, of a more complex testing setup. Moreover, the track has to be sectioned to carry the test on it.
A. De Iorio et alii, Frattura ed Integrità Strutturale, 30 (2014) 578-592; DOI: 10.3221/IGF-ESIS.30.69
582
Figure 4: DCPPT scheme [Ref. ERRI].
Figure 5a: Typical DCPPT layout for longitudinal resistance evaluation.
Figure 5b: Physical testing set-up adopting DCPPT layout.
A. De Iorio et alii, Frattura ed Integrità Strutturale, 30 (2014) 578-592; DOI: 10.3221/IGF-ESIS.30.69
583
Only by this technique it is possible to measure the ballast strength along the axial direction. Finally, since the test is carried out on a set of several sleepers in parallel, the lateral strength value measured is the average value of the strengths that the ballast exercises on each sleeper of the set. Of course, also when this experimentation technique is adopted, particular care must be taken to ensure that the optimal load conditions are realized or attained in term of load direction and point of application on the track segment, to avoid that the strength to be measured is altered by the testing setup. Ideally, the testing load should span equally on all the sleepers of the track segment. However, the load distribution among the sleepers is always influenced by the edge effects, although the errors that they cause are less severe than those of STPT.
Finally, other experimentation methodologies, like the Continuous Track Panel Pull Test (TLPT) [16] and the Continuous Dynamic Measurement (Plasser-DGS) [17], are frequently applied to measure the overall global response of the continuous welded rail track to the lateral displacements. In these kinds of test, a non-secondary role in determining the behaviour of the track is played by the bending stiffness of the rails and by the torsional stiffness of the fastening systems. Consequently, it is practically impossible to accurately determine the ballast lateral strength by them [16].
ALTERNATIVE TEST SYSTEM FOR FIELD OPERATION
he test system we propose to carry out on field measurements of the ballast strength, as an alternative to those before described, has been designed and built within the framework of a research programme developed on behalf of RFI [8] and regarding the track stability.
Since the main sources of measurement uncertainty of the STPT technique cannot be removed and, furthermore, to study the track stability it is necessary to know the ballast axial strength, which cannot be measured by this technique, we choose to carry out the on field experimental activity adopting the DCPPT method.
Based on this working hypothesis, all the tests scheduled in the research activity and the corresponding systems for actuating and transferring the testing loads have been designed.
Both the test for measuring the lateral and the axial ballast strengths have been planned in order to operate on shorts track sections, with four sleepers at least, implicitly neglecting the side effects. For what it concerns the modality of transferring the load, its application points on the test articles and its direction, it has been established to conduct all the tests operating in displacement control and to transfer to the test article as many loads as the sleepers are. For each sleeper, furthermore, the load is applied simultaneously to both the rails, along a direction parallel to the sleeper axes and in the plane that contains the centre of gravity of the track section. To measure the sleepers displacements, whose values have to be correlated with the applied load, a set of transducers having the measure axis aligned with the sleeper load direction has been used. Each of them, during the test, was positioned on the side of the track opposite to the one where the actuators are located.
In order to achieve these test conditions, a special system dedicated to the measurement of the ballast lateral strength has been devised. It is shown in the photo of Fig. 6.
A. De Iorio et alii, Frattura ed Integrità Strutturale, 30 (2014) 578-592; DOI: 10.3221/IGF-ESIS.30.69
584
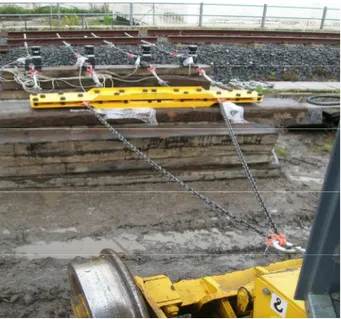
The fixture, according to the number of sleepers of the track section, is composed of n. 4 or n. 5 linear lead screw actuators, driven by a stepper motor (Fig. 7). Loads are transferred from the actuators to the rails of the track section by a system of chains, wire ropes, ringbolts and pulleys.
Figure 7: Electromechanical actuators in pulling position.
Each actuator of the system is linked by a ball joint bearing to a very stiff horizontal beam of a contrast wagon, working as fixed constraint of the whole test system (Fig. 8).
Figure 8: Actuators connection to the beam of the contrast wagon.
Each actuator of the system can exert a maximum load equal to 40 kN and can impose displacements not greater than 250 mm; each of them is equipped with a load cell bolted at the end of the stem, whose measuring range is ±50 kN, and is digitally controlled by an electronic card with a programmable processor. All the actuators operate in position control with a constant load rate to be set before starting the test.
For all the test the displacements were applied by a linear ramp with a slope set equal to 0.2 mm/sec. The sleepers displacements have been measured by hybrid linear potentiometers connected to them by cables aligned with the load application direction (Fig. 6).
A. De Iorio et alii, Frattura ed Integrità Strutturale, 30 (2014) 578-592; DOI: 10.3221/IGF-ESIS.30.69
585
The digital system for controlling the actuators allows enabling, each time, a number of actuators equal to the number of sleepers present in the scenario to be tested. During the setup phase of each test, all the actuators are positioned with their axis aligned with the axis of the corresponding sleeper. After that, all fixtures are mounted and, before performing the test, a small pre-load is applied by each actuator to the test article in order to tense the load chain and to recover all the clearances of its mechanical fasteners. The actuators are connected to threaded rods passing through the rails in correspondence of their centre of gravity and fixed to them by removable fasteners. In addition, each threaded rod is realized in two parts, between which a load cell is inserted to control and measure how the load applied on a single sleeper is distributed between the two rails (Fig. 9).
Figure 9: Actuators connection to the rails.
The other ends of the actuators are connected by a wire rope to a fixed constraint. When this constraint is realized by a wagon positioned on a track parallel to the one to be tested, the fastening system to the wagon allows to adjust the wire rope vertical position in order to achieve the perfect alignment of the actuators with the axes of the corresponding threaded rods (Fig. 9). As an alternative, it is possible to connect the actuators to one or more fixed points placed along the track by means of the fixture shown in Fig. 10, which transfers the actuators pulls to one or more wires anchored to these fixed points.
A. De Iorio et alii, Frattura ed Integrità Strutturale, 30 (2014) 578-592; DOI: 10.3221/IGF-ESIS.30.69
586
Figure 10b: Detail of the connection between the actuators and the fixed constraint.
The testing system described right now can be also used to perform a transversal pull test on a continuous track when the load to apply exceeds the maximum load of a single actuator (Fig. 11).
Figure 11: Test setup adopted for the transverse test of the continuous track.
Furthermore, it is also possible to perform the tests for measuring the ballast axial strength. In this case, the system has to be positioned with respect to the track section to be tested as shown in Fig. 5.
For the tests to be carried out with a vertical load on the track, a loading system easily transportable and able to span uniformly the load to the sleepers has been studied and realized. It allows applying the vertical load by means of barely invasive operations of easy repeatability. (Fig. 12).
A. De Iorio et alii, Frattura ed Integrità Strutturale, 30 (2014) 578-592; DOI: 10.3221/IGF-ESIS.30.69
587 Figure 12: DCPPT in the loaded-track configuration.
Figure 13: Finite element model for under-tie pressure evaluation.
SAMPLE TEST AND DATA PROCESSING
o describe the use modalities of the new test system and to highlight the innovative aspects of the experimentation feasible by this system, it is reported in the following the procedure adopted to perform a test to measure the ballast transverse strength and to obtain the final diagram of the ballast strength as function of the sleeper displacement along the transversal direction.
The tested scenario (LRS27) has been sectioned from a track characterized by the following parameters: • pozzolana subgrade;
• ballast of siliceous nature;
• upper surface of the ballast leveled with the sleeper upper surface; • 300 mm under sleeper ballast height;
• 600 mm shoulder width;
A. De Iorio et alii, Frattura ed Integrità Strutturale, 30 (2014) 578-592; DOI: 10.3221/IGF-ESIS.30.69
588
• UIC 60E1 rails;
• n. 5 prestressed reinforced concrete sleepers RFI 230 type, with 600 mm axle spacing; • Vossloh W14 type fastening system;
• n. 3 sleeper anchors; • DTS consolidated ballast; • absence of vertical loads.
After having constrained the threaded bar to the rails, the actuators have been connected to them (Fig. 14).
Figure 14: LRS27 scenario.
These latter then have been anchored to the contrast wagon, taking care of positioning both the actuators anchoring points and the pull directions on the same plane. The displacement transducers have been placed on the side of the track section opposite to the one occupied by the actuators, in the same plane as the sleepers top faces and with the measuring axes aligned with the pull direction of each actuator. Afterwards, all the electrical connections have been established and all the sensors and the test equipment have been activated. The test has been carried out according the following procedure:
• warm up for a period of 15 min. both of the signal conditioners of the load cells and of the digital controllers of the actuators;
• warm-up of 15 min. of the data acquisition system; • resetting of the load cells from console;
• resetting of the displacement transducers from pc; • check of the actuators control channels from console;
• start-up, in position control, of the actuators “Zero cycle” from console, to have all the actuators with the same initial load value, equal to a given preload;
• tightening of the nuts to fasten the threaded bars to the rail closer to actuators; • tightening of the nuts to fasten the threaded bars to the second rail;
• final check of all the signals from the load cells and the displacement transducers; start-up of the signals acquisition with a sampling frequency equal to 2 Hz; test start up, in position control and with a 0.2 mm/s pulling rate;
• Test stop from console when the sleepers displacements have exceeded the 100 mm limit value;
• Zeroing in position control, by console, of the pull loads of all the actuators by imposing the same displacement ramp to all the actuators.
• Electrical disconnection of the actuators controllers and dismantling of all the test fixtures; • Data analysis.
A. De Iorio et alii, Frattura ed Integrità Strutturale, 30 (2014) 578-592; DOI: 10.3221/IGF-ESIS.30.69 589 0 20 40 60 80 100 120 140 160 180 200
0 200 400 600 800 1000 1200 1400 1600
Time [s] D ispl acem ent [ m m ] U1 U2 U3 U4 U5 (a) 0 2000 4000 6000 8000 10000 12000
0 200 400 600 800 1000 1200 1400 1600
Time [s] Lo a d [ N ] LC1 LC2 LC3 LC4 LC5 (b) 0 1000 2000 3000 4000 5000 6000 7000
0 200 400 600 800 1000 1200 1400 1600
Time [s] Lo a d [ N ] LC AUX-5 LC-Aux-1 LC-Aux-2 LC-Aux-3 LC-Aux-4 (c)
Figure 15: Raw data acquired during the test.
A. De Iorio et alii, Frattura ed Integrità Strutturale, 30 (2014) 578-592; DOI: 10.3221/IGF-ESIS.30.69 590 0 2000 4000 6000 8000 10000 12000
0 50 100 150 200
Displacement [mm] Loa d [ N ] LC1 LC-Aux-1 0 2000 4000 6000 8000 10000 12000
0 50 100 150 200
Displacement [mm] Loa d [N ] LC2 LC-Aux-2 0 2000 4000 6000 8000 10000 12000
0 50 100 150 200
Displace ment [mm]
Lo a d [ N ] LC3 LC-Aux-3 0 2000 4000 6000 8000 10000 12000
0 50 100 150 200
Displacement [mm] Loa d [ N ] LC4 LC-Aux-4 0 2000 4000 6000 8000 10000 12000
0 50 100 150 200
Displace ment [mm]
Loa d [ N ] LC5 LC AUX-5
Figure 16: Applied load vs displacement of each sleeper.
The curves of Fig. 15 and 16 are surprisingly more regular than those obtained previously by other researchers and show an evident isomorphism. Furthermore, by comparing the curves of the loads applied on the track by the actuators with those of the load values obtained by the auxiliary cells, it is possible to get clear evidence of the load distribution between the two rails. All these features emerging from the data acquired can be ascribable to the special testing system adopted, able to impose, independently of the strength differences that the ballast offers, the same displacement to all the sleepers of the tested track segment.
Furthermore, the possibility of easily adjusting the pull directions of all the actuators and of spanning the loads applied to the track segment between the two rails allow to reproduce more accurately on the test article the real load conditions that occur in service during the pre-buckling and post-buckling phases of the track. All that makes the proposed test system an efficient alternative to be preferred to the ones adopted up to now.
A. De Iorio et alii, Frattura ed Integrità Strutturale, 30 (2014) 578-592; DOI: 10.3221/IGF-ESIS.30.69
591
curve of this system (caused by the ballast softening) is achievable, thanks to which more reliable previsions of the track critical conditions are possible.
0 2000 4000 6000 8000 10000 12000
0 50 100 150 200
Displacement [mm]
Lo
a
d [
N
]
LRS27 LRS27-Aux
Figure 17: Mean curves representative of the behaviour of all the sleepers.
FINAL CONSIDERATIONS
he pressing demand (need) of facing the organisational problems of a tests campaign (appointed by RFI) to be carried out on real track to study the thermal buckling phenomenon has required the preliminary analysis of the testing methods currently adopted to measure the ballast lateral and axial strengths. The analysis of both the modalities by which loads are applied, the various tests are set up and of the related results has suggested introducing significant modifications, regarding mainly the load application points and the fixtures to transfer the loads to the test article. Therefore, a new testing system has been designed to carry out the in-field experimentation, which is extensively described in the paper. It allows carrying out a more accurate analysis of the mechanical behavior of the sleeper-ballast system and of the related non-linear softening phenomena that, as it is well known, markedly influence the track stability and the equilibrium paths by which the track attains the critical conditions.
ACKNOWLEDGMENT
FI, Regional Direction, Naples and Italcertifer, Rome, Italy.
BIBLIOGRAPHY
[1] Sung, W., Shih, M., Lin, C., Go, C. G., The critical loading for lateral buckling of Continuous Welded Rail, Journal of Zehjiang University Science, 6A (8) (2005) 878-885.
[2] UIC Code 720 R, Laying and maintenance of CWR track, (2005). [3] Coenraad Esveld, Improved knowledge of CWR track, (1998).
[4] Read, D.M., Kish, A., Clark, D. W., Optimized readjustment length requirements for improved CWR neutral temperature management, In: AREMA Conference (2007).
[5] Sluz, A., Kish, A., Read, D., Factors affecting neutral temperature changes in continuous welded rail, In: AREMA Techn Conf, (1999)
[6] Harrison, H. D., Cheng, L., Wang, D., Li, J., Monitoring the stress free temperature of a complex segment of track, In: Joint Rail Conference. (2012).
T
A. De Iorio et alii, Frattura ed Integrità Strutturale, 30 (2014) 578-592; DOI: 10.3221/IGF-ESIS.30.69
592
[7] ERRI DT202/DT363: Improved knowledge of forces in tangential tracks including switches, Determination of lateral and longitudinal ballast resistance of a railway track by experimental tests, 2 (1997).
[8] De Iorio, A., Grasso, M., Penta, F., Pinto, P., Pucillo, G. P., Rossi, S., Testa, M., Farneti, G., Transverse strength of railway tracks: part 1. Planning and experimental setup, Frattura ed Integrità Strutturale, 30 (2014) 478-485; doi: 10.3221/IGF-ESIS.30.58.
[9] Kish, A., Samavedam, G., Wormley, D., Fundamentals of track lateral shift for high speed rail applications, In: UIC Cost Effectiveness and Safety Aspects of Railway Track Conference, Paris, France, (1998).
[10]Kish, A., Samavedam, G., Wormley, D., New track shift safety limits for high speed rail applications, In: Proceedings of World Congress on Railway Research, Cologne, Germany, (2001).
[11]Analysis of track shift under high speed vehicle-track interaction, US Department of Transportation,
DOT/FRA/ORD-97/02, DOT VNTSC-FRA-97-3 (1997).
[12]Butterfield, R., Gottardi, G., A complete three-dimensional failure envelope for shallow footings on sand, Géotechnique, 44(1) (1994) 181-184.
[13]Taiebat, H. A., Carter, J. P., Numerical studies of the bearing capacity of shallow foundations on cohesive soil subjected to combined loading. Géotechnique, 50 (4) (2000) 409-418.
[14]Kerr, A.D., Zarembski, A.M., The response equation for a cross-tie track, Acta Mechanica, 40 (1981) 252-276. [15]Birmann, S., Versuche der DB uber den Querverschiebewiderstand des Gleises, DB Internal Report, May, (1973). [16]Samavedam, G., Kanaan, A., Pietrak, J., Kish, A., Sluz, A., Wood tie track resistance characterization and correlations