136
Health Belief Model and Reasoned Action Theory in Predicting
Water Saving Behaviors in Yazd, Iran
*Mohammad Ali Morowatisharifabad 1, MahdiehMomayyezi 1, Mohammad Taghi Ghaneian 2
1
Dept. of Health Education and promotion, Faculty of Health, Shahid Sadoughi University of Medical Sciences, Yazd, Iran
2 Dept. of Environment Health, Faculty of Health, Shahid Sadoughi University of Medical Sciences, Yazd, Iran
(Received: 30 Oct 2012/ Accepted: 25 Dec 2012)
ABSTRACT
Background: People's behaviors and intentions about healthy behaviors depend on their beliefs, values, and knowledge about the issue. Various models of health education are used in deter-mining predictors of different healthy behaviors but their efficacy in cultural behaviors, such as water saving behaviors, are not studied. The study was conducted to explain water saving beha-viors in Yazd, Iran on the basis of Health Belief Model and Reasoned Action Theory.
Methods: The cross-sectional study used random cluster sampling to recruit 200 heads of households to collect the data. The survey questionnaire was tested for its content validity and reliability. Analysis of data included descriptive statistics, simple correlation, hierarchical multiple regression.
Results: Simple correlations between water saving behaviors and Reasoned Action Theory and Health Belief Model constructs were statistically significant. Health Belief Model and Reasoned Action Theory constructs explained 20.80% and 8.40% of the variances in water saving beha-viors, respectively. Perceived barriers were the strongest Predictor. Additionally, there was a sta-tistically positive correlation between water saving behaviors and intention.
Conclusion: In designing interventions aimed at water waste prevention, barriers of water saving behaviors should be addressed first, followed by people's attitude towards water saving. Health Belief Model constructs, with the exception of perceived severity and benefits, is more powerful than is Reasoned Action Theory in predicting water saving behavior and may be used as a framework for educational interventions aimed at improving water saving behaviors.
Keywords: Predictor, water saving behaviors, Health Belief Model, Reasoned Action Theory
Introduction
In global view, water is a socio-eco-nomic product, which is considered a basic need of the human being. Although water is a renewable resource, its amount is limited [1]. Water and competition for domination of its limited resources will be one of the
most challenging areas of the third millen-nium. Population growth, socio-industrial development, and climate changes have re-duced the limited resources of safe water, especially in the arid Middle East. Addition-ally, mismanagement of population growth, ORIGINAL ARTICLE Open Access
Citation: Morowatisharifabad MA, Momayyezi M, Ghaneian MT. Health Belief Model and Reasoned Action Theory in Predicting Water Saving Behaviors in Yazd, Iran. Health Promot Perspect 2012; 2 (2): 136-144.
137 climate changes, and a drastic reduction in
capitation of available water resources will likely cause serious international challenges which may adversely affect the sustainable development of the region [2].
In the studies conducted by the United Nations in Singapore, the lowest water consumption per person was deter-mined to be 99 liters per day in order to maintain healthy community [3]. According to estimates of the Islamic Republic of Iran's budget and planning organization in 1992, water consumption pattern for Iranian households must be 75-150 liters per person daily in 2016 [4]. Unfortunately, Due to un-controlled growth of urbanization in Iran, recent statistics show that, on average, capi-tation of water consumption has been 250 to 300 liters daily. In 1994, the daily average capitation of urban water consumption had been 242 liters per person [5].
The management of water consump-tion includes a range of techniques and tools that can be divided into four groups, namely, socio-cultural, technical-engineering, eco-nomic, and legal–procedural. Of the four, the socio-cultural approach is the only one that may be implemented with the participa-tion of people and without a high cost. This approach includes techniques and tools that are needed to promote public awareness and influence consumer behavior change in an attempt to make the optimal use of the wa-ter likely [2].
Health educators should be aware of the factors that may influence the learning capacity of the people in order to succeed in changing or maintaining a healthy behavior and to do so, the implementation of appro-priate theories and models is instrumental. Theories are useful in suggesting what, how, when, and why health education programs may be instructive [6]. Health Belief Model (HBM) is the most popular theoretical model that focuses on the beliefs of people about their decisions and includes five con-structs, namely, (1) perceived susceptibility to a disease or illness, (2) perceived severity of a particular condition, (3) perceived bar-riers, which may prevent action, (4)
per-ceived benefits of the recommended beha-vior, and (5) cues to action [7]. According to the Reasoned Action Theory (RAT), the immediate predictors of behavior are inten-tions, which are determined by attitudes and subjective norms [8].
Several studies have been conducted to compare HBM and RAT constructs in the prediction of behavior and intention in a wide range of topics. For example, the HBM and RAT were employed in predicting beha-viors such as dieting [9] and use of seat belts [10]. Results of the first study showed the two models were useful in predicting a sig-nificant proportion of the variance in dieting and fasting, however, the variance explained in fasting increased when intention was added to the HBM model. Attitudinal meas-ures were the strongest predictors of beha-vioral intention and intention was the strongest predictor of dieting and fasting in the TPB and modified HBM [9]. The second study revealed that the basic Theory of Planned Behavior (TPB) model (i.e., atti-tudes and subjective norms) predicted seat-belt use intention better than did extended TPB and the HBM [10]. Some studies have also been conducted to examine separate application of each of these two models, such as consumption of milk [11], oil [12] and salt [13]; however, only two studies were conducted on water saving by means of educational models. First the TPB-based study by LAM in 1995 [14] and second the RAT based study by Marandu et al. in 2010 [15].
138
Methods
Subject Selection
The participants consisted of heads of households living in the city of Yazd. In or-der to estimate the required sample size, a pilot study was carried out on 10 families and the data were used to calculate the pa-rameters. The sample size was determined to be 182, which was increased to 200 to ac-count for potential missing cases. A cluster sampling was conducted. Yazd’s health centers were divided into 10 clusters and 20 families from each cluster were randomly selected and invited to participate in the study. A survey questionnaire was used to collect the data.
Instrumentation
Water Saving Behavior (WSB) was measured, using two scales: 1) individual behaviors and 2) familial behaviors and ac-tivities. There were 16 items (e.g., closing tap when shampooing or washing the body) which measured individual water saving be-haviors. A 3-point Likert-type scaling was used: 1 = never, 2 = sometimes, and 3 = always. Familial behaviors and activities were measured by 11 binary items design to assess the status of using devices that reduce water consumption at the household level (e.g., use of standard valves; periodic mainten-ance). The responses were coded as either 1 = no or 2 = yes. The theoretical range for WSB was from 27 to70.
Health Belief Model (HBM) com-ponents were assessed separately. There were six items which measured perceived susceptibility (e.g., what is the chance for sever water deficiency in the country due to overconsumption of water in the near fu-ture?) and perceived severity of water defi-ciency (e.g., how dangerous and sever would it be if the country encounters sever water deficiency in the near future?). A 4-point Likert-type scaling was used: 1 = none, 2 = low, 3 = high, 4 = very high.
A 12-item scale was developed to measure the perceived barriers to water saving behaviors (e.g., water pressure is low
and I have to open the valve completely). A 3-point Likert-type scaling was used: 1 = agree, 2 = neither agree nor disagree, and 3 = disagree.
Perceived benefits of water saving be-haviors were measured with a 4-item scale (e.g., when I do water saving behaviors, wa-ter will be accessible to other people). A 3-point Likert-type scaling was used: 1 = agree, 2 = neither agree nor disagree, and 3 = disagree. Cues to action measure included 5 yes/no questions (e.g., have you ever watched on TV any programs about water saving practices?). The responses were coded as either 1 = no or 2 = yes.
Reasoned Action Theory (RAT) components were assessed separately. In-tention of water saving behaviors construct included 6 questions in the context of water saving behaviors in relation to five hypo-thetical situations. The possible responses were "0 to 5 times" which were coded from 1 to 6.
Attitude toward water saving beha-viors scale consisted of 6 items (e.g., water saving behaviors is a useful action). Subjec-tive norms for water saving scale was also consisted of 6 items (e.g., the majority of people who are important to me think I should do water saving behaviors). A 3-point Likert-type scaling was used to measure both scales: 1 = disagree, 2 = no comment, 3 = agree).
Additionally, the participants were asked to provide demographic information on the type of home residence, education level, gender, family size, occupation and income.
139
Results
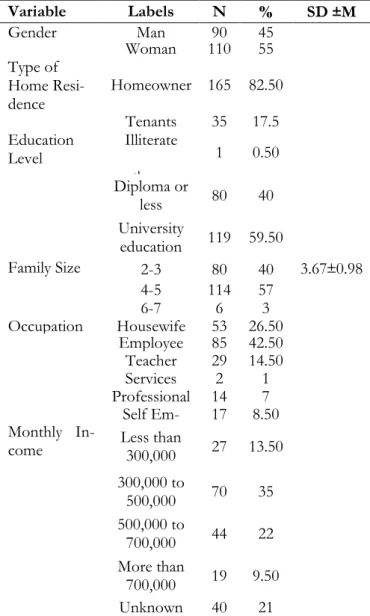
The majority of the study participants (55.0%) were female (mothers). The major-ity of the participants (82.50%) were home-owners and 17.50% were tenants. Most of the participants (59.50%) had university education. Nearly 42.50% were employed and 35.00% had an income between 3,000,000 and 5,000,000 Rials (Official rate: 1$=12260 Rls).(Table 1).
Data pertaining to familial behaviors and activities showed that 71.00% of the participants used standard valves during construction or periodic maintenance or overhaul. Nearly 82.00% reported that they refused to buy toys that require a constant flow of the water, which was the highest reported behavior. Only 12.50% stated that they used modern water flow devices, such as electronic sensors, which was the lowest reported behavior.
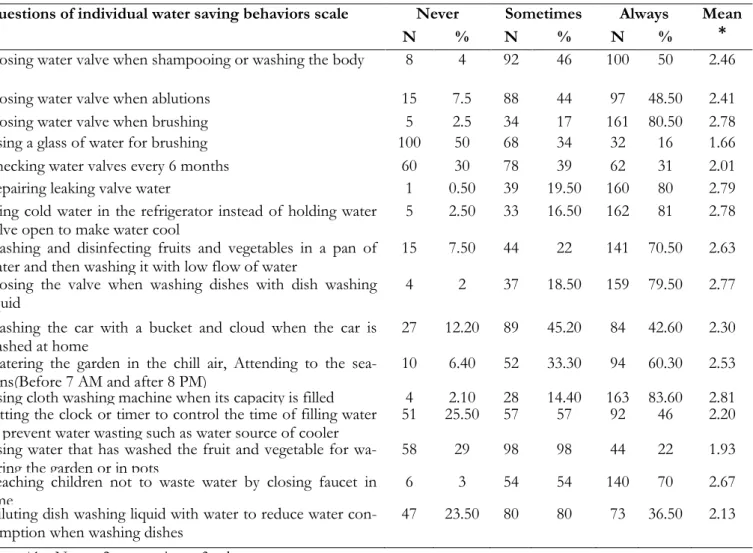
Regarding individual water saving be-haviors, 83.60% stated that they only used the cloth washing machine when it was in its full capacity, which was the highest reported behavior, and 81.00% stated that they used cold water in the refrigerator instead of holding water valve open to make water cool. The result showed that 50.00% never used a full glass of water for teeth brushing, which was the lowest reported individual behavior (Table 2 and 3).
Correlational analyses showed that the simple correlation between water saving be-haviors and all HBM and RAT constructs were statistically significant; the direction of the association with perceived barriers was negative and it was positive for all other cor-relations. The intention of water saving be-haviors had a statistically significant correla-tion with all constructs with the excepcorrela-tion of the subjective norms. Additionally, there was a statistically significant positive correlation between water saving behaviors and inten-tion (P < 0.01) (Table 4).
Two stepwise hierarchical multiple li-near regression analyses were performed to examine the importance of the HBM and
RAT constructs in explaining the variation in water saving behaviors.
Table 1: Demographic Characteristics of participants
Variable Labels N % SD ±M
Gender Man 90 45
Woman 110 55
Type of Home Resi-dence
Homeowner 165 82.50
Tenants 35 17.5
Education Level
Illiterate
ﺩﺍ
1 0.50
Diploma or
less 80 40
University
education 119 59.50
Family Size 2-3 80 40 3.67±0.98
4-5 114 57
6-7 6 3
Occupation Housewife 53 26.50
Employee 85 42.50
Teacher 29 14.50
Services 2 1
Professional 14 7
Self Em- 17 8.50
Monthly
In-come Less than 300,000 27 13.50
300,000 to
500,000 70 35
500,000 to
700,000 44 22
More than
700,000 19 9.50
Unknown 40 21
140
Table2: Frequency distribution of responses to questions of individual water saving behaviors scale
Questions of individual water saving behaviors scale Never Sometimes Always Mean *
N % N % N %
Closing water valve when shampooing or washing the body 8 4 92 46 100 50 2.46
Closing water valve when ablutions 15 7.5 88 44 97 48.50 2.41
Closing water valve when brushing 5 2.5 34 17 161 80.50 2.78
Using a glass of water for brushing 100 50 68 34 32 16 1.66
Checking water valves every 6 months 60 30 78 39 62 31 2.01
Repairing leaking valve water 1 0.50 39 19.50 160 80 2.79
using cold water in the refrigerator instead of holding water valve open to make water cool
5 2.50 33 16.50 162 81 2.78
Washing and disinfecting fruits and vegetables in a pan of water and then washing it with low flow of water
15 7.50 44 22 141 70.50 2.63
Closing the valve when washing dishes with dish washing liquid
4 2 37 18.50 159 79.50 2.77
Washing the car with a bucket and cloud when the car is washed at home
27 12.20 89 45.20 84 42.60 2.30
Watering the garden in the chill air, Attending to the sea-sons(Before 7 AM and after 8 PM)
10 6.40 52 33.30 94 60.30 2.53
Using cloth washing machine when its capacity is filled 4 2.10 28 14.40 163 83.60 2.81
Setting the clock or timer to control the time of filling water to prevent water wasting such as water source of cooler
51 25.50 57 57 92 46 2.20
Using water that has washed the fruit and vegetable for wa-tering the garden or in pots
58 29 98 98 44 22 1.93
Teaching children not to waste water by closing faucet in time
6 3 54 54 140 70 2.67
Diluting dish washing liquid with water to reduce water con-sumption when washing dishes
47 23.50 80 80 73 36.50 2.13
*1= Never, 2= sometimes, 3=always
Table 3: Frequency distribution of responses to questions of familial behaviors and activities of water saving scale
Questions of Family Behaviors and Activities of water saving scale Yes No Mean
N % N %
Using of low-flow water epaulet 120 60 80 40 1.60
Using showers that could cut water flow without changing temperature 60 30 140 70 1.30
Using flash tanks with low volume or stroke 57 28.50 143 71.50 1.28
using new devices to connect and disconnect flow of water in valves such as
electronic sensors 25 12.50 175 87.50 1.12
Using standard valves in during construction or periodic maintenance or
overhaul 142 71 58 29 1.71
Using drip irrigation system for watering the garden 30 20.10 119 79.90 1.20
Using wall heater 72 36 128 64 1.64
Avoid buying toys that require a constant water flow 36 18 164 82 1.82
Changing taps washers every 6 months 113 56.50 87 43.50 1.56
Installing the cooler in the shade and using appropriate coverage such as
putting mat for shade to prevent water evaporation 133 66.50 67 33.50 1.66
If you use the flash tank, putting a bottle of sand or gravel in it 17 14 104 86 1.14
141 Table4: The correlation matrix of HBM and RAT constructs about water saving behaviors
Constructs 1 2 3 4 5 6 7 8 9 Mea
n SD
1.Attitude − 17.69 0.80
2.Subjective Norms 0.16* − 13.80 2.30
3.Cues To Action 0.20** 0.17* − 8.85 1.10
4.Perceived Benefits 0.46** 0.26** 0.245** − 11.57 0.90
5.Perceived Barriers 0.24** 0.0- 0.053- 0.21**- − 18.99 4.70
6.Perceived Susceptibility 0.34** 0.25** 0.064 0.26** 0.24**- − 19.37 3.40
7.Perceived Severity 0.34** 0.19** 0.094 0.26** 0.24**- 0.87** − 19.55 3.60
8.Intention 0.32** 0.13 0.144* 0.32** 0.46**- 0.26** 0.24** − 27.49 5.70
9.Behavior 0.20** 0.24** 0.177* 0.23** 0.39**- 0.25** 0.24** 0.38** − 54.95 5.2
P < 0.05, **P < 0.01
The unique contribution of cues to action was 2.20% (P < 0.05). There was 20.80% of the variation in water saving be-haviors which was explained by perceived barriers, perceived susceptibility, cues to ac-tion, and perceived benefits. The unique contribution of perceived benefits was 0.80%, which was not statistically significant. Perceived severity did not explain any varia-tion in water saving behaviors. Results are summarized in Table 5. Regarding RAT
constructs, 8.40% of the variations in water saving behaviors were explained by attitude and subjective norms. The unique contribu-tion of attitude and subjective norms was 5.60% and 2.80% respectively. These two variables explained 10.80% of variations in water saving intention; the unique contribu-tion of attitude was 10.1% (P < o.01) and the unique contribution of subjective norms was 0.7% which was not statistically signifi-cant (Table 6).
Table 5: Regression analysis of the health belief model constructs as predictors of water saving behaviors
Predictor R R2 R2
Change
F
Change P
Perceived Barriers 0.39 0.15 0.15 35.45 < 0.01
Perceived Susceptibility 0.42 0.18 0.037 6.43 < .05
Cues to Action 0.45 0.20 0.02 5.34 < .05
Perceived Benefits 0.46 0.21 0.01 1.94 0.16 5
Perceived Severity 0.46 0.21 0.00 0.005 0.94 2
Table 6: Regression analysis of the theory of reasoned action constructs as predictors of water saving behaviors and intention
Dependent
Va-riables Predictors R
R2
R2 Change F Change P
Water Saving
Beha-viors Attitude 0.24
0.05
0.05 11.73 < .01
Subjective Norms 0.29 0.08 0.03 6.05 < .05
Water Saving
Inten-tion Attitude 0.32
0.10
0.10 22.26 < .01
142
Discussion
Factors associated with water saving beha-viors among households in Yazd, Iran were investigated. Specifically, the study focused on 1) individual behaviors and 2) familial behaviors and activities.
The results showed that "Turning on cloth washing machine when its capacity is filled" (83.60%); "using cold water in the refrige-rator instead of holding water valve open to make water cool"(81.00%); and "closing the water valve when brushing” (80.50%) were the most frequently employed individual water saving practices. "Avoid buying toys that require a constant water flow" (82.00%) and "using standard valves during construc-tion or periodic maintenance or overhaul" (71.00%) were reported to be family beha-viors and activities used the most in an at-tempt to reduce water consumption.
Glig reported that the most behaviors that led to wasting water are routine behaviors such as washing dishes and brushing [17]. Washing dishes, washing clothes, and bath-ing are the most water-consumbath-ing activities; and that water-saving behaviors seem to be more effective than are various devices in reducing water consumption [18]. However, there are studies which promote the use of devices that may reduce water consumption. The study conducted in Kashan, Iran by Water and Environment Research Center of Sharif University in 2004 showed that with the installation of valves and showers that reduce water consumption, there was a 22.00% reduction in water consumption as well as a cost-benefit ratio of 5.8 to 1 [19]. Installation of timer valves in schools, edu-cational centers, and mosques in Yazd, Iran resulted in 20- 80% reduction of water con-sumption in these places [20]. Consumers’ awareness of devices that reduce water con-sumption is an effective strategy in reducing water consumption [14].
ur study found a statistically significant posi-tive correlation between water saving beha-viors and attitude and subjective norms, which is consistent with the study by Lan and Marandu et al. [14-15]. Additionally, we
found a statistically significant positive cor-relation between perceived benefits and cues to action and water saving behaviors; and that increase in water saving behavior is as-sociated with a decrease in perceived bar-riers. Furthermore, our results showed that people who had higher perceived suscepti-bility and severity were more likely to prac-tice water saving behaviors, which is consis-tent with the HBM [21]. Floyd et al., in a meta-analysis of 65 studies in 20 health fields, found that increase in perceived sus-ceptibility and severity was associated with increase in healthy behaviors [22]. Consis-tent with Azjen and Fishbein propositions in RAT and theory of planned behavior, which is a modified model of RAT [23], the results showed that the higher intention of water saving would result in more water saving behaviors.
143 behavior are suitable for studying behaviors
that are under less control of individuals [24]. Whereas, water saving behavior is a be-havior that is greatly under the control of individuals; thus, people’s attitude towards water saving behaviors should be addressed in interventional programs.
Limitations
There were two limitations in the study. First, the consumed water rate of families as an important variable was not measured. Second, the study took place in a region where water shortage is very well known among the people. Due to non-experimental nature of the study, no causal inferences may be drawn.
Acknowledgements
This study was done by financial support of Faculty of Health, Shahid Sadoughi Univer-sity of Medical Sciences, (Yazd, Iran) and Yazd Province Water and Wastewater Or-ganization. The authors declare that there is no conflict of interest.
References
[1] Oliaie E. Investigate the possibility of saving water in Iran's domestic, agri-cultural and industrial parts. Special bulletin of Iran's economy2009:5:42-49. [Persian].Available:
http://www.majlis.ir/pdf/bult/bultan5.pdf
[2] Motahari AH. Strategic management in water consumption. Water challenges conference in Qom (past, present, fu-ture) 2010. Qom University. [Persian]. Available:
http://www.modiryar.com/index-man-agement/business/consumption /3459-1389-04-07-02-35-16.html.
for water: Procedures and methodolo-gies for projecting water demands in the context of regional national planning. United Nations publication. New York. 1976.
[4] Islamic Republic of Iran's budget and planning organization. Principles and standards of designing urban water supply programs, Publication No. 117-3. Islamic republic of Iran's budget and planning organization Press. 1992. [Per-sian].Available:
http://www.wrm.ir/standard/standards %20pdf/117-3-S.pdf
[5] Maleki A. Construction of water pipe network in Tehran and its related prob-lems. The seminar of water and waste-water issues in large cities. 1992. Shiraz. [Persian].
[6] Glanz K, Rimer BK, Lewis FM. Health behavior and health education: Theory, research and practice, 3rd ed. Jossey-Bass. San Francisco. 2002.
[7] Nidoo J, Wills J. Health promotion. Bailliere Tindall .London, UK. 2000. [8] Fishbein M, Ajzen I. Belief, attitude,
in-tention and behavior: An introduction to theory and research. Reading, Mass: Addison-Wesley. 1975.
[9] Nejad L, Wertheim E, Greenwood k. Comparison of the health belief model and the theory of planned behavior in the prediction of dieting and fasting be-havior. E-Journal of Applied Psychol-ogy : Social Section 2005; 1(1):63-74. Available:
http://ojs.lib.swin.edu.au/index.php/ej ap/article/view/7
[10] Simsekoglu
chology of seat belt use: A comparison of theory of planned behavior and health belief model. J Traffic Inj Prev
2008; 11(3):181-191.
[11] Brewer JL, Black AJ, Rankin SA, Doug-lass LW. Theory of reasoned action predicts milk consumption in women.
[12] Thompson K.E, Alekos PJ, Haziris N. Reasoned action theory applied to the prediction of olive oil usage. School of management working papers. United
Kingdom. 1994. Available from:
[13] Shepherd R, Farleigh C.A. Preferences,
attitudes and personality as
determi-nants of salt intake.
1986; 40(3):195-208.
144
and perceived water right. J Appl Soc Psy-chol 1999; 29(5):1058-71.
[15] Marandu EE, Nkisang M, Haika J. Pre-dicting residential water conservation using the Theory of Reasoned Action. J Commun 2010; 1(2): 87-100.
[16] Haji-Soltani S. Basic studies in Ardakan (abstract existing documents about the city Ardakan). 1 vol. Iranian NGO Col-laborators Institute GHADA Press. Yazd. 2009. [Persian].
[17] Gilg A, Barr S. Behavioral attitudes to-wards water saving? Evidence from a study of environmental actions.
[18] Yazdandad H. Study of affective factors on Effective Water consumption patterns and improvements in house-hold consumption (case study: Mashhad city). Third National conference on op-eration and maintenance of water and waste water systems. 2009. [Persian]. [19] Maleki Nasab A, Abrishamchi A,
Ta-jrishy M. Assessment of residential wa-ter conservation due to using low-flow
fixtures. J Water Wastewater
2007;18(62):2-11. [Persian].
[20] Pakdel S. Water consumption manage-ment in Yazd city. Yazd ABF
[21] Butler JT. Principles of health education and health promotion. 3rd ed. Wads worth. USA. 2001.
[22] Floyd DL, Prentice-dunn S, Rogers RW. A Meta analysis of research on protection motivation theory. J App Psy-chol 2000 ; 30(2) : 407-29.
[23] Ajzen I, Fishbein M. Understanding attitudes and predicting social behavior. 1st ed. Prentice Hall press. University of Michigan. USA. 1980.