1
LUCIANO BARRETO MENDES
EVALUATION OF MEANS TO MEASURE EMISSIONS AND AIR FLOWS THROUGH NATURALLY VENTILATED LIVESTOCK BUILDINGS
Thesis presented to the Federal University of Viçosa, as partial fulfillment of the requirements from the Graduate Program in
Agricultural Engineering for attaining the degree of Doctor Scientiae.
VIÇOSA
Ficha catalográfica preparada pela Seção de Catalogação e Classificação da Biblioteca Central da UFV
T
Mendes, Luciano Barreto, 1983-M538e
2014
Evaluation of means to measure emissions and air flows through naturally ventilated livestock buildings / Luciano Barreto Mendes. – Viçosa, MG, 2014.
xii, 121 f. : il. (algumas color.) ; 29 cm.
Inclui anexos.
Orientador: Ilda de Fátima Ferreira Tinôco.
Tese (doutorado) - Universidade Federal de Viçosa. Inclui bibliografia.
1. Bovino de leite Instalações. 2. Frango de corte -Instalações. 3. Ventilação. 4. Gases - Análise. I. Universidade Federal de Viçosa. Departamento de Engenharia Agrícola. Programa de Pós-Graduação Engenharia Agrícola. II. Título.
2
LUCIANO BARRETO MENDES
EVALUATION OF MEANS TO MEASURE EMISSIONS AND AIR FLOWS THROUGH NATURALLY VENTILATED LIVESTOCK BUILDINGS
Thesis presented to the Federal University of Viçosa, as partial fulfillment of the requirements from the Graduate Program of the Department of Agricultural Engineering for attaining the degree of Doctor Scientiae.
“I do not know what I may appear to the world, but to myself I seem to have been only like a boy playing on the sea-shore, and diverting myself in now and then finding a smoother pebble or a prettier shell than ordinary, whilst the great
ocean of truth lay all undiscovered before me.”
4
DEDICATION
This thesis is dedicated to all researchers that put out the best of their knowledge as an attempt to address the issue of monitoring air and gaseous patterns in naturally ventilated livestock barns. The studies presented here may one day become obsolete, but I hope that the included findings help towards the progress of the scientific knowledge in this specific field in the years to come.
BIOGRAPHY
Luciano Barreto Mendes, son of José Mendes Irmão and Ana Maria Barreto
Mendes, was born in Queimadas, Paraíba state – Brazil, on December 26th of 1983.
In March of 2002 he started to pursue a Bachelor degree in Agricultural Engineering at the Department of Agricultural Engineering of the Federal University of Campina Grande (Campina Grande, Paraíba state, Brazil), graduating in April of 2008. From January to June of 2008, he studied and worked as an exchange student in the Department of Agricultural and Biosystems Engineering (ABE) at Iowa State University (ISU, Ames, Iowa, U.S.A.), under the CAPES/FIPSE Umbrella Agreement.
At the start of the Fall 2007, Mr. Mendes joined the ABE Department at ISU,
and in August of 2010 he attained the degree of Master Scientiae (M.Sc.) with major
in Agricultural Engineering, in the area of Animal Production Engineering.
6
ACKNOWLEDGMENTS
My primal acknowledgment is given to the One Who allows us all to exist and live, The Creator of nature with its mysterious beauty, which we, scientists and researchers, out of naïve curiosity, scarcely try to scrutinize, and barely understand.
I am eternally thankful to my parents, Ana Maria and José, for always giving me unconditional love, and for teaching since my early years of personality formation until today as a fully grown man, what cannot be taught even in the most prestigious university in the world: to be kind, respectful, honest, work hard, give the best from the heart and always pursue improvement. You have shaped the best of who I am today and are the main reason of what I have accomplished thus far in life. Thank you!
Thank you Professor Ilda for adopting me with open arms to the lovely AMBIAGRO family; for always motivating my hunger of exploring the unknown; seeking professional improvement; and for teaching me that the best way of making a path to success in life is by respecting, helping, and working with people around me.
To Dr. Nico Ogink, for the countless earnest talks on the essentials of pure scientific research values. For guiding me through the scientific method, data processing and presentation, statistical analysis, argument construction and discussion of the results during the preparation of the articles here presented. Thank you for truly and honestly criticizing my scientific work when I needed it.
I dedicate special thanks to all the co-authors of the articles presented in this thesis: Elohanna, Hendrik Jan, Ilda, Jairo, Julio, Keller, Marilú, Nadège, Nico and Robinson. For working together during the experiments, for helping with data processing and statistical analysis and for always being there when I needed careful critical review of the manuscripts. This thesis wouldn´t have been possible without you.
Thank you to the thesis committee members: Dr. Tadayiki Yanagi Jr., Dr. Jadir Nogueira da Silva, Dr. Marcos Oliveira de Paula, Prof.(a) Cecília de Fátima Souza and Prof. Paulo Roberto Cecon, for having accepted my invitation to review, evaluate and judge this thesis. Please receive my sincere gratitude for dedicating your knowledge and expertise and taking the time to carefully go through my thesis, and helping me to improve it.
Thank you all the professors and staff at the Department of Agricultural Engineering (DEA) and the Federal University of Viçosa (UFV) for giving me the honor of becoming part of this big warm family, during these three and a half years. Thank you all from the Livestock Research Institute at the Wageningen University and Research Centre, for adopting me during the 12 months of my stay in the Netherlands, where I went to perform some of the studies that are present in this thesis.
To the Brazilian funding agencies: CAPES, CNPq and FAPEMIG, for funding my pursuit of a Doctor degree, by providing scholarships, funding for research projects and supporting the visit of my co-advisor Dr. Nico Ogink to Viçosa for joint work. Please accept my priceless gratitude.
Thank you to all the valuable people I met during this three and a half years journey, making my academic and personal lives much easier. Friends from AMBIAGRO: Adriana, Conceição, Débora, Diogo, Elohanna, Fernanda, Flávio, Humberto, Jadson, Jairo, Jofran, Juan, Keles, Keller, Kelle, Lina, Luis Henrique, Luiz Gustavo, Márcia, Maria de Fátima, Marilú, Maurílio, Maximiliano, Múcio, Olga, Patrícia, Robinson, Ricardo, Roque, Rui (in memorian), Seu Pedro and
Wemerton. To my housemates in Viçosa: Anderson, Carlos, Fábio, Kleber, Luciana and Wagner. To my friends from the Netherlands: Annemieke, Maria Cecília, Dennis, Djai, Eef, Eliana, Emma, Gus, Hendrik Jan, Jacqueline, Jan, Johan, Jorge, Jos, Julio, Kimo, Liansun, Marzi, Nadège, Phuong and Rolland. And to all of you whose names my distracted mind didn´t remember: my big thanks, because you´re the best!
8
TABLE OF CONTENTS
RESUMO ...ix
ABSTRACT ...xi
CHAPTER 1. GENERAL INTRODUCTION ... 1
INTRODUCTION ... 1
THESIS OBJECTIVES ... 5
THESIS ORGANIZATION ... 6
REFERENCES ... 7
CHAPTER 2. NDIR GAS SENSOR FOR TEMPORAL AND SPATIAL MONITORING OF CARBON DIOXIDE CONCENTRATIONS IN NATURALLY VENTILATED LIVESTOCK BUILDINGS ... 11
ABSTRACT ... 11
INTRODUCTION ... 13
MATERIAL AND METHODS ... 15
Description of the carbon dioxide measuring devices ... 15
Laboratory tests and calibration of NDIR sensors ... 16
Description of the livestock barn ... 18
Field experimental setup and data collection procedure ... 18
Regression analysis for field calibrated NDIR sensors ... 20
Analysis of agreement between laboratory and field calibration methods ... 20
Field validation and uncertainty analysis... 21
RESULTS AND DISCUSSION ... 22
Laboratory tests with the NDIR sensors ... 22
Field calibration of individual NDIR sensors with PAS analyzers and OP -laser ... 24
Analysis of agreement between laboratory and field developed calibration equations ... 26
Field application of the different calibration methods and analysis of uncertainty ... 31
CONCLUSIONS ... 33
ACKNOWLEDGEMENTS ... 34
REFERENCES ... 34
CHAPTER 3. SPATIAL VARIABILITY OF MIXING RATIOS OF AMMONIA AND TRACER GASES IN A NATURALLY VENTILATED DAIRY COW BARN ... 41
ABSTRACT ... 41
INTRODUCTION ... 42
METHODOLOGY ... 44
Description of the dairy cow barn and animals management ... 44
Description of the SF6 injection system ... 45
Vertical and horizontal cross barn variability of concentrations and mixing ratios ... 46
Data processing and statistical analyses ... 48
RESULTS AND DISCUSSION ... 50
Spatial distribution analysis of gaseous concentrations ... 50
Analysis of spatial distribution of pollutant and tracer mixing ratios ... 53
CONCLUSIONS ... 56
ACKNOWLEDGEMENTS ... 56
REFERENCES ... 57
CHAPTER 4. AIR MOTION PATTERNS AND AIR EXCHANGE RATES OF A
NATURALLY VENTILATED DAIRY BARN BY MEANS OF A CFD MODEL TESTED
AGAINST THE CARBON DIOXIDE MASS BALANCE METHOD ... 62
ABSTRACT ... 63
INTRODUCTION ... 64
MATERIAL AND METHODS ... 65
Description of the experimental barn ... 66
Development of barn geometry, mesh and mesh test ... 66
Theoretical considerations of CFD modeling and boundary conditions ... 69
Validation procedure ... 73
RESULTS AND DISCUSSION ... 75
Convergence of model solution ... 75
Analysis of air flow patterns with the NV barn ... 76
Validation of the CFD model ... 78
Further discussions ... 80
CONCLUSIONS ... 81
ACKNOWLEDGMENTS ... 81
REFERENCES ... 82
CHAPTER 5. A REFINED PROTOCOL FOR CALCULATING AIR FLOW RATE OF NATURALLY-VENTILATED BROILER BARNS BASED ON CO2 MASS BALANCE ... 85
ABSTRACT ... 85
INTRODUCTION ... 86
MATERIAL AND METHODS ... 88
Characteristics of the broiler barns and flock management ... 88
Sampling scheme and data collection ... 89
Reference method for the determination of building VR and statistical analysis ... 91
RESULTS AND DISCUSSION ... 93
Assessment of agreement between reference and test methods in the MVB ... 93
Calculations of VR for the NVB with the best selected test methods ... 96
CONCLUSIONS ... 97
REFERENCES ... 97
CHAPTER 6. AMMONIA EMISSIONS FROM A NATURALLY AND A MECHANICALLY VENTILATED BROILER HOUSE IN BRAZIL ... 100
ABSTRACT ... 100
INTRODUCTION ... 101
MATERIAL AND METHODS ... 103
Description of the barns, environmental control systems and birds’ management ... 103
Data collection procedures ... 103
Calculations of ventilation rates and ammonia emission rates ... 104
Data handling and statistical analysis ... 105
RESULTS AND DISCUSSION ... 106
Determination of daily NH3 emission factors ... 106
Simulations of yearly NH3 emission factors ... 108
CONCLUSIONS ... 113
ACKNOWLEDGEMENTS ... 113
REFERENCES ... 113
CHAPTER 7. FINAL SUMMARY ... 116
ATTACHMENTS ... 119
ATTACHMENT I:REGRESSION LINES AND BLAND-ALTMAN PLOTS FOR THE COMBINATION OF DIFFERENT NUMBERS OF NDIR SENSORS AND DIFFERENT MIT ... 119
ATTACHMENT II:DEVELOPMENT OF THE DIFFERENTIAL EQUATION FOR THE CONSTANT RATE OF RELEASE OF THE TRACER GAS... 121
10
RESUMO
MENDES, Luciano Barreto, D.Sc. Universidade Federal de Viçosa, Março 2014.
Evaluation of means to measure emissions and air flows through naturally
ventilated livestock buildings. Orientadora: Ilda de Fátima Ferreira Tinôco.
Coorientadores: Nico W. M. Ogink, Sérgio Zolnier e Márcio Arêdes Martins.
Esta tese foi preparada como uma tentativa de abordar uma série de questões importantes sobre os atuais meios disponíveis para medir emissões gasosas e os fluxos de ar em alojamentos animais com ventilação natural (VN). Cinco foram os principais objetivos que levaram à elaboração desta tese: (1) avaliar o desempenho operacional de um dispositivo de baixo custo para monitoramento de concentrações de dióxido de carbono (CO2) e compará-lo com dois outros métodos padrões; (2)
avaliar o perfil de distribuição das razões de mistura entre o poluente amônia (NH3) e
os gases marcadores hexafluoreto de enxofre (SF6) e CO2 em um galpão para vacas
leiteiras com VN; (3) desenvolver um modelo CFD de um galpão de vaca leiteira com VN implementado com o modelo de produção de CO2 do CIGR; (4)
desenvolver e testar um protocolo para medição das emissões de NH3 de um galpão
brasileiro de frangos de corte com VN, e (5) calcular fatores de emissão de NH3 de
dois galpões brasileiros com VN e ventilação mecânica (VM) para frangos de corte. Cinco artigos foram preparados para responder aos cinco objetivos desta tese, os quais incluem uma variedade de fatores e implicações relacionados a um galpão de vaca leiteiras com VN na Holanda e um galpão de frangos de corte com VN no Brasil. O primeiro trabalho versou sobre a comparação de dois métodos de monitoramento de concentrações de CO2 que são comumente usados para estudos de
emissões em alojamentos animais com ventilação mecânica (VM) com um sensor de CO2 de baixo custo, e que é novo para fins de pesquisa, podendo ser mais adequado
para uso galpões com VN. No segundo artigo, razões de mistura foram calculadas entre o gás NH3 e um dos dois gases marcadores distintos, o CO2 naturalmente
liberado pelos animais e esterco, e o SF6 que foi artificialmente injetado no galpão. O
objetivo maior deste artigo foi identificar a região dentro do galpão onde as razões de mistura possuem valores estimados aproximadamente constantes, de modo que taxas de emissão representativas para o galpão possam ser estimadas por meio do método do gás marcador. No artigo número três, um modelo em “Computational Fluid Dynamics” (CFD) de um galpão para vacas leiteiras com VN foi desenvolvido e
implementado com as equações de produção CO2 publicadas pelo CIGR, a fim de
revelar os padrões de fluxo de ar e CO2 no espaço interno ventilado. O modelo foi
validado com dados de concentração de CO2 medidos experimentalmente em vários
pontos dentro do galpão. O quarto artigo versou sobre a determinação do algoritmo mais adequado para estimar as taxas de fluxo de ar e gases através de um galpão de frangos de corte com VN, localizado no Brasil. As estratégias de amostragem testadas consistiram de combinações de dois esquemas diferentes de monitoramento das concentrações gasosas e de duas estratégias de predição da produção de CO2 das
aves. O quinto e último trabalho foi uma continuação do quarto artigo, e tratou do cálculo dos fatores de emissões de NH3 (fNH3) de galpões com VN e VM para frangos de corte no Brasil. O método utilizado para calcular os fatores de emissão em ambos os galpões foi o do gás marcador, utilizando-se CO2 naturalmente produzido
pelas aves. Os fNH3 calculados foram comparáveis com aqueles encontrados na
literatura para as condições do Brasil e em outras partes do mundo. No geral, esta tese demonstra que, apesar das complicações relacionadas ao monitoramento dos fluxos de ar poluentes gasosos através de galpões animais com VN, os fatores de emissão obtidos podem ser comparáveis àqueles relativos a galpões animais com VM. Em síntese, o número de pontos no galpão em que as concentrações de gases serão monitoradas é mais relevante do que a utilização de métodos de medição de alta precisão e dispendiosos. Quando o método de gás marcador é utilizado, atenção deverá ser dada a determinação precisa da taxa de injeção do gás marcador ou a taxa de produção de CO2. É importante também que a razão de mistura entre os gases
12
ABSTRACT
MENDES, Luciano Barreto, D.Sc. Universidade Federal de Viçosa, March 2014.
Evaluation of means to measure emissions and air flows through naturally
ventilated livestock buildings. Adviser: Ilda de Fátima Ferreira Tinôco.
Co-advisers: Nico W. M. Ogink, Sérgio Zolnier and Márcio Arêdes Martins.
This thesis was prepared as an attempt to cover a number of questions and concerns regarding the current available means to measure emissions and air flows from naturally ventilated (NV) livestock buildings. Five were the main objectives that led to the preparation of this thesis: (1) to assess the operation performance of a low cost carbon dioxide (CO2) measuring device and to compare it to two other standard
methods; (2) to evaluate the distribution of mixing ratios of the pollutant ammonia (NH3) and the tracer gases sulfur-hexafluoride (SF6) and CO2 in a NV dairy cow
barn; (3) to develop a CFD model of a NV dairy cow barn implemented with the CIGR CO2 production model; (4) to develop and test a protocol for measuring NH3
emissions from a Brazilian NV broiler house; and (5) to calculate NH3 emission
factors from a Brazilian NV and a mechanically ventilated (MV) broiler barns. Five papers were prepared to answer the five objectives of this thesis, which include a variety of factors and implications related to a NV dairy cow barn in the Netherlands and a NV broiler barn in Brazil. The first paper dealt with the comparison between two CO2 concentration measuring devices that are commonly used for emission
studies in MV barns with one low cost sensor that is new to research purposes and might be more suitable for NV livestock buildings. In the second paper, we compared mixing ratios calculated with NH3 and two different tracers, the CO2
which is naturally produced in livestock houses and the artificially injected SF6 with
the aim of identifying the region within the barn ventilated airspace where mixing ratios are approximately constant, from which representative estimates of emission rates through the tracer gas method can be made. In paper number three, a Computational Fluid Dynamics (CFD) model of a NV dairy cow barn was developed and implemented with the CIGR CO2 production equations in order to reveal the
flow patterns of air and CO2 within the ventilated airspace. The model was validated
with CO2 concentration data actually measured at multiple points within the barn.
The fourth paper was about finding a more adequate algorithm for determining flow rates across a NV broiler barn in Brazil. The tested sampling strategies combined two different sampling schemes for gaseous concentrations and two different strategies to
predict CO2 production from the birds. The fifth and last paper was a follow up of
paper number four, and dealt with calculation of actual NH3 emission factors (fNH3)
of a NV and a MV broiler barns in Brazil. The method used to estimate the emission factors in both barns was based on a tracer gas, using the CO2 naturally produced by
the birds as the tracer. The calculated fNH3 were then compared to those found in the
literature for Brazilian conditions and those found in other parts of the world. Overall, this thesis proves that despite the complications related to monitoring air and gaseous pollutant flows through NV buildings, emission factors can be obtained which are comparable to those of MV buildings. In general, the number of points in which gaseous concentrations are being monitored within the barn ventilated airspace with properly calibrated devices is more important than using highly accurate and expensive measurement methods. When the tracer gas method is to be used, focus should be given to accurate determination of the tracer injection rate or rate of production of CO2. It is important that the mixing ratio between pollutant and
1
CHAPTER 1. GENERAL INTRODUCTION
Introduction
In 2011, the world human population reached the unprecedented mark of 7 billion people, and estimates are that in 2024 it will reach the next milestone of 8 billion people (FAO, 2013). At the same time, the world supply for food is facing dramatic drifts as an attempt to meet the world demand. Industrial agriculture is the primary sector that converts nutrients from their inorganic forms into proteins, carbohydrates, lipids that are essential to sustain the healthy development and maintenance of the human body.
The accelerated increase of human population on Earth that started in the 50s, as suggested by Erisman et al. (2008) can be related to the increase in use of fertilizers. Erisman et al. (2008) also correlated increase in human population to increase of meat and other sources of food grown/produced with artificial Haber-Bosh fertilizers. The production of artificial fertilizer was enabled by the Haber-Bosh method, in which ammonia (NH3) was produced from nitrogen gas. The world´s demand for food, feed
and energy is combined with the current exceptional ability of grains of annual and semi-annual cycle in producing enough food and energy for humanity and animal ration.
Consequently, with the relatively low cost of the fertilizers and therefore of animal feed, environmental issues related to the excess of nutrients in some of its many forms exists, causing stagnation or acceleration of certain natural processes (Follet & Hatfield, 2009). There are several means of environmental threats associated with the excess or lack of nutrients, such as: (1) greenhouse gas balance, including emissions of nitrous oxide (N2O) plus interactions with other nitrogen (N) forms, particulate matter
and atmospheric N deposition, plus tropospheric ozone (O3). N2O is now also the main
cause of stratospheric O3 depletion, increasing the risk of skin cancer from UV-B
over-fertilization and too much atmospheric N deposition acidify natural and agricultural soils, while a shortage of N and other nutrients leads to soil degradation, which can be exacerbated by shortage of micronutrients, leading to loss of fertility and erosion (Sutton et al., 2013).
A considerable amount of the losses from excess of nutrients occur in intense animal production systems and are related to gaseous emissions. As a reaction to that, over the past three decades, a great deal of research effort has been spent all over the world on the search of appropriate methods for measuring emissions and its limiting factors from livestock confinement buildings. An important aspect to consider when monitoring gaseous emissions from a livestock barn is the kind of ventilation system that it presents. One kind of ventilation system that is popularly applied to livestock barns in temperate climate countries, for most livestock categories, is mechanical ventilation (MV); while another kind of ventilation system, more common in tropical climate regions, is the naturally ventilated (NV) livestock barn. There exists nowadays a general consensus on the methodology for measurement methods of emissions from MV barns; however, measuring air ventilation rates and emissions in NV buildings is still a challenge, due to the large uncertainty and variability associated with these measurements (Calvet et al., 2013; Ogink et al., 2013; Takai et al., 2013).
Currently, no reference method exists for measuring air ventilation rates in NV animal houses. But, a number of different candidate approaches have been suggested (Calvet et al., 2013), such as the tracer gas technique using either natural (Feddes et al., 1984; van Ouwerkerk & Pedersen, 1994; Heber et al., 2001; Blanes & Pedersen, 2005; Xin et al., 2009; Samer et al., 2012; Mendes et al., 2013) or artificial tracers (Demmers et al., 2001; Snell et al., 2003; Wu et al., 2012; Kiwan et al., 2013). The use of carbon dioxide (CO2) as a tracer gas (CO2 mass balance approach) for measuring ventilation
and emission rates in livestock building was first described by Feddes et al. (1984). While other artificial tracers have been applied in quite a few research studies, such as krypton-85 (85Kr) (Samer et al., 2011a; Samer et al., 2011b; Kiwan et al., 2013),
trifluoromethyl sulfur pentafluoride (SF5CF3) (Schrade et al., 2012), and sulfur
hexafluoride (SF6) (Kaharabata et al., 2000; Grainger et al., 2007; Schrade et al., 2012;
3
the housed animals, and harmless to the environment. However, some studies have shown that not all chosen tracers, behave the same when used for simultaneous determination of pollutant emissions from a ventilated airspaces (Samer et al., 2012; Kiwan et al., 2013). Nonetheless, the comparison of distribution behavior of tracer and pollutant concentrations, as well as their mixing ratios in NV livestock barns is still meager in current literature.
When it comes to sampling gaseous concentrations in NV livestock barns, it becomes a challenging task, given the high variability of distribution patterns normally associated to these environments. For instance, Lefcourt (2002) demonstrated that inadequate selection of sampling positions for ammonia (NH3) in NV animal barns may
lead to errors in calculated NH3 emission rates from 50% to over 200% of the actual
values. Two different approaches arise from the use of the tracer gas method, depending on the purpose of its use. If the focus is monitoring gaseous emissions from NV buildings, attention should be given to obtaining representative mixing ratio between pollutant and tracer gases that are representative for the entire barn ventilated airspace. On the other hand, if the goal is to determine ventilation rates from these barns, obtaining representative barn concentrations of pollutant and tracer gases is more important. In either case, in order to determine representative mixing ratios or gaseous concentrations, it is important that measurements be taken in as many points as possible. Amongst these gases, CO2 is an important but challenging one to sample. Important
because it is released by both the animals and the manure, thus mimicking the dispersion pathways of many of the pollutant gases of interest that are present in livestock buildings. On the other hand, CO2 is challenging to monitor because the
currently used measurement instruments are either expensive, or show problems when applied to measure at multiple points, resulting in complex, costly and labor intensive monitoring systems (Heber et al., 2006). Hence, there is an urgent need to find a feasible option for measuring device for semi-continuous spatial and temporal concentrations of CO2 in NV livestock barns.
which one can describe air movement models as realistic as possible. While the former approach can be carried out, it is not feasible in most practical situations, due to limitations such as installation costs, maintenance and complexity of the required monitoring system (Bjerg et al., 2013). On the other hand, the use of CFD models could provide promising solutions to understand pollutant pathways and ultimately emissions from NV livestock buildings (Arcidiacono & D´Emilio, 2006). The main requirement of the applicability of CFD models is, nonetheless, that they are properly validated with experimental data, and more than that, not only to average values for the entire barn, but to a grid of points spread within the ventilated airspace. Yet, such validated models have not been presented, this far, to the current literature body.
5
Thesis objectives
This is the context in which this thesis was brought up. Knowing that there is an urgent need to assess the methods currently available to monitor emissions and air flows from naturally ventilated livestock buildings, especially those that can be applied to the Brazilian reality. The quest for answers to meet this need constitutes the main objective of this doctoral thesis. In order to meet this general goal, the following specific questions were raised:
1. What kinds of technology are currently available in terms of instrumentation for monitoring CO2 concentrations from naturally
ventilated buildings? Are there techniques that are more suitable than others? How do they compare with the “golden standard” methods available and trusted by scientists around the world?
2. When it comes to the use of tracer gas ratio method for monitoring emissions from NV livestock barns, is there a region in the ventilated airspace where gaseous sampling is most appropriate? What happens to the mixing properties of the gases with the air in different regions of the barn? Do different tracers behave differently as compared to the pollutants of interest? If so, which one(s) is (are) more appropriate?
3. How do the air and target pollutants move inside a NV livestock barn under typical outside weather conditions? How can CFD models help unraveling the understanding of release and dispersion of these pollutants from the emission sources?
4. Can the current knowledge available in the literature body on monitoring emissions (e.g. of NH3) from NV buildings be actually applied to the
Thesis organization
This thesis has been prepared in journal manuscript format, and includes five manuscripts that together help answering the questions raised above, and that meet the main objective of this thesis. Three of the presented research studies were conducted in a naturally ventilated dairy cow barn in the Netherlands and two in a naturally ventilated broiler barn in Brazil. At the end, a final summary chapter was prepared to align the conclusions that were obtained throughout the chapters.
Chapter 2 is entitled “NDIR Gas Sensor for Temporal and Spatial Monitoring of Carbon Dioxide Concentrations in Naturally Ventilated Livestock Buildings”, which was submitted for publication to the journal Computer and Electronics in Agriculture.
Chapter 3 refers to a manuscript entitled “Spatial Variability of Mixing Ratios of Ammonia and Tracer Gases in a Naturally Ventilated Dairy Cow Barn”, and is currently being considered for publication by the journal Biosystems Engineering.
Following, chapter 4 is about a conference paper entitled “Air Motion Patterns of a Naturally Ventilated Dairy Barn by Means of a CFD Model Tested against the Carbon Dioxide Mass Balance Method”. This paper was submitted for poster
presentation at the 2014 International Conference of Agricultural Engineering
(AGENG 2014), that will be held in Zurich, Switzerland, from 6 to 10 July, 2014. This manuscript contains the first results of the model development, which will be improved after the defense date of this thesis, and will ultimately lead to the preparation of a manuscript for submission to a scientific journal.
Lastly, chapters 5 and 6 deal with the practical use of some of the results discussed in the previous chapters applied to the Brazilian context. Chapter 5 is entitled “A Refined Protocol for Calculating Air Flow Rate of Naturally-Ventilated Broiler Barns Based on CO2 Mass Balance”, and was submitted for publication to the
Colombian journal Dyna – Medellin. Chapter 6 is a paper called “Ammonia Emissions
7
References
Arcidiacono, C.; D´Emilio, A. CFD analysis as a tool to improve air motion
knowledge in dairy houses. Rivista di Ingegneria Agraria 1: 35-42 (2006).
Bjerg, B.; Cascone, G.; Lee, I.; Bartzanas, T.; Norton, T.; Hong, S.; Seo, I.; Banhazi, T.; Liberati, P.; Marucci, A.; Zhang, G.. Modelling of ammonia emissions from
naturally ventilated livestock buildings. Part 3: CFD modelling. Biosystems
Engineering 116(3): 259-275 (2013).
Blanes, V.; Pedersen, S. Ventilation flow in pig houses measured and calculated by
carbon dioxide, moisture and heat balance equations. Biosystems Engineering
92(4): 483-493 (2005).
Calvet, S.; Gates, R. S.; Zhang, G.; Estellés, F.; Ogink, N. W. M.; Pedersen, S.; Berckmans, D. Measuring gas emissions from livestock buildings: A review on
uncertainty analysis and error sources. Biosystems Engineering 116(3):
221-231 (2013).
Demmers, T. G. M.; Phillips, V. R.; Short, L. S.; Burgess, L. R.; Hoxey, R. P.; Wathes, C. M. SE — Structure and Environment: Validation of ventilation rate measurement methods and the ammonia emission from naturally ventilated
dairy and beef buildings in the United Kingdom. Journal of Agricultural
Engineering Research 79(1): 107-116 (2001).
Erisman, J.W.; Galloway, J. N.; Klimont, Z.; Winiwarter, W. How a century of
ammonia synthesis changed the world. Nature Geosciences 1(10): 4 (2008).
FAO. The state of food and agriculture: Food systems for better nutrition. Rome,
Food and Agriculture Organization of the United Nations (2013).
Feddes, J. J. R.; Leonard, J. J.; Mcquitty, J. B. Carbon dioxide concentration as a
measure of air exchange in animal housing. Canadian Agricultural
Engineering 26(1): 53-56 (1984).
Follet, R. F. ; Hatfield, J. L. Nitrogen in the environment: Sources, problems and
management. San Diego, Elsevier (2009).
Grainger, C.; Clarke, T.; Mcginn, S. M.; Auldist, M. J.; Beauchemin, K. A.; Hannah, M. C.; Waghorn, G. C.; Clark, H.; Eckard, R. J. Methane emissions from dairy
cows measured using the sulfur hexafluoride (SF6) tracer and chamber
Heber, A. J.; Ni, J. Q.; Haymore, B. L.; Duggirala, R. K.; Keener, K. M. Air quality and
emission measurement methodology at swine finishing buildings. Transactions
of the American Society of Agricultural Engineers 44(6): 1765-1778 (2001). Heber, A. J.; Ni, J. Q.; Lim, T. T.; Tao, P. C.; Schmidt, A. M.; Koziel, J. A.; Beasley, D.
B.; Hoff, S. J.; Nicolai, R. E.; Jacobson, L. D.; Zhang, Y. Quality assured
measurements of animal building emissions: Gas concentrations. Journal of
the Air and Waste Management Association 56(10): 1472-1483 (2006).
Kaharabata, S. K.; Schuepp, P. H.; Desjardins, R. L. Estimating methane emissions from dairy cattle housed in a barn and feedlot using an atmospheric tracer.
Environmental Science & Technology 34(15): 3296-3302 (2000).
Kiwan, A.; Berg, W.; Fiedler, M.; Ammon, C.; Gläser, M.; Müller, H. J.; Brunsch, R.
Air exchange rate measurements in naturally ventilated dairy buildings using
the tracer gas decay method with 85Kr, compared to CO2 mass balance and
discharge coefficient methods. Biosystems Engineering 116(3): 286-296
(2013).
Lassey, K. R. On the importance of background sampling in applications of the SF6
tracer technique to determine ruminant methane emissions. Animal Feed
Science and Technology 180(1–4): 115-120 (2013).
Lefcourt, A. M. Some potential problems for measuring ammonia emissions from
farm structures. Transactions of the American Society of Agricultural
Engineers 45(5): 1585-1591 (2002).
Lima, K. A. O.; Moura, D. J.; Carvalho, T. M. R.; Bueno, L. G. F.; Vercellino, R. A.
Ammonia emissions in tunnel-ventilated broiler houses. Brazilian Journal of
Poultry Science 13(4): 265-270 (2011).
MAPA. Ministério da Agricultura, Pecuária e Abastecimento: Agronegócio no Brasil.
2013, from http://www.agricultura.gov.br/ (2013).
Medeiros, R.; Santos, B. J. M.; Freitas, M.; Silva, O. A.; Alves, F. F.; Ferreira, E. A adição de produtos químicos e o efeito da umidade na volatilização de amônia
em cama de frango. Ciência Rural 38(8): 2021-2326 (2008).
Mendes, L. B.; Tinôco, I. F. F.; Ogink, N. W. M.; Santos, M. S. Ammonia emissions
from a naturally and a mechanically ventilated broiler house in Brazil. 64th
9
Menegali, I.; Tinôco, I. F. F.; Carvalho, C. C. S.; Souza, C. F.; Martins, J. H.
Comportamento de variáveis climáticas em sistemas de ventilação mínima
para produção de pintos de corte. Revista Brasileira de Engenharia Agrícola e
Ambiental 17(1): 106-113 (2013).
Miragliotta, M. Y.; Nääs, I. A.; Murayama, M. C.; Moura, D. J. Software para
estimativa de emissão de amônia em alojamento de frangos de corte. Revista
Brasileira de Agroinformática 6(2): 79-89 (2004).
Nazareno, A. C.; Pandorfi, H.; Almeida, G. L. P.; Giongo, P. R.; Pedrosa, E. M. R.; Guiselini, C. Avaliação do conforto térmico e desempenho de frangos de corte
sob regime de criação diferenciado. Revista Brasileira de Engenharia Agrícola
e Ambiental 13: 802-808 (2009).
Ogink, N. W. M.; Mosquera, J.; Calvet, S.; Zhang, G. Methods for measuring gas emissions from naturally ventilated livestock buildings: Developments over the
last decade and perspectives for improvement. Biosystems Engineering 116(3):
297-308 (2013).
Osorio, J. A. Measurement and CFD modeling of ammonia concentration, flux and
thermal environment variables in open side broiler housing. Department of
Agricultural Engineering. Viçosa:, UFV. Ph.D. Thesis: 132p. (2010).
Samer, M.; Berg, W.; Fiedler, M.; Von Bobrutzki, K.; Ammon, C.; Sanftleben, P.; Brunsch, R. A comparative study among H2O-balance, heat balance, CO2
-balance and radioactive tracer gas technique for airflow rates measurement in
naturally ventilated dairy barns, Valencia (2012).
Samer, M.; Berg, W.; Muller, H.-J.; Fiedler, M.; Glaser, M.; Ammon, C.; Sanftleben, P.; Brunsch, R. Radioactive 85Kr and CO2 balance for ventilation rate
measurements and gaseous emissions quantification through naturally
ventilated barns. Transactions of the ASABE (2011a).
Samer, M.; Müller, H. J.; Fiedler, M.; Ammon, C.; Gläser, M.; Berg, W.; Sanftleben, P.; Brunsch, R. Developing the 85Kr tracer gas technique for air exchange rate
measurements in naturally ventilated animal buildings. Biosystems
Engineering 109(4): 276-287 (2011b).
floors and an outdoor exercise area in Switzerland. Atmospheric Environment
47(0): 183-194 (2012).
Snell, H. G. J.; Seipelt, F.; Weghe, H. F. A. Van Den. Ventilation rates and gaseous
emissions from naturally ventilated dairy houses. Biosystems Engineering
86(1): 67-73 (2003).
Souza, P. A.; Mello, W. Z. Estimativa das emissões de amônia por excreta de animais
domésticos para o estado do Rio de Janeiro. II Simpósio Internacional sobre
Gerenciamento de Resíduos Agropecuários e Agroindustriais - II SIGERA, Iguaçu Falls, Santa Catarina, Brazil (2011).
Sutton, M.A.; Bleeker, A.; Howard, C.M.; Bekunda, M.; Grizzetti, B.; Vries, W. De; Grinsven, H.J.M. Van; Abrol, Y.P.; Adhya, T.K.; Billen, G.; Davidson, E.A.; Datta, A.; Diaz, R.; Erisman, J.W.; Liu, X.J.; Oenema, O.; Palm, C.; Raghuram, N.; Reis, S.; Scholz, R.W.; Sims, T.; Westhoek, H.; Zhang, F.S. Our nutrient
world: The challenge to produce more food and energy with less pollution.
Edinburgh, Earthprint (2013).
Takai, H.; Nimmermark, S.; Banhazi, T.; Norton, T.; Jacobson, L. D.; Calvet, S.; Hassouna, M.; Bjerg, B.; Zhang, G. Q.; Pedersen, S.; Kai, P.; Wang, K.; Berckmans, D. Airborne pollutant emissions from naturally ventilated
buildings: Proposed research directions. Biosystems Engineering 116(3):
214-220 (2013).
Tinôco, I. F. F. Avicultura industrial: Novos conceitos de materiais, concepções e
técnicas construtivas disponíveis para galpões avícolas brasileiros. Brazilian
Journal of Poultry Science 3(1): 1-26 (2001).
Van Ouwerkerk, E. N. J.; Pedersen, S. Application of the carbon dioxide mass balance
method to evaluate ventilation rate in livestock buildings. XII World Congress
on Agricultural Engineering, Milan, Italy, Merelbeke (1994).
Wu, W.; Zhang, G.; Takai, P. Ammonia and methane emissions from two naturally ventilated dairy cattle buildings and the influence of climatic factors on
ammonia emissions. Atmospheric Environment 61(0): 232-243 (2012).
Xin, H.; Burns, R. T.; Gates, R. S.; Overhults, D.; Earnest, J. W. Use of CO2
concentration difference or CO2 balance to assess ventilation rate of broiler
11
CHAPTER 2. NDIR GAS SENSOR FOR TEMPORAL AND SPATIAL
MONITORING OF CARBON DIOXIDE CONCENTRATIONS IN
NATURALLY VENTILATED LIVESTOCK BUILDINGS
Luciano B. Mendes1,2, Nico W. M. Ogink3, Nadège Edouard4, Hendrik J. van Dooren5,
Ilda F. F. Tinôco6 and Julio Mosquera7
A manuscript submitted to the Journal Computers and Electronics in Agriculture
1Department of Agricultural Engineering, Federal University of Viçosa, Av. P. H. Rolfs,
S/N, Viçosa, 36570-000, Minas Gerais, Brazil; E-mail: luciano.mendes@ufv.br;
2Wageningen UR Livestock Research, P.O. Box 135, 6700 AC Wageningen, The
Netherlands;
3Wageningen UR Livestock Research, P.O. Box 135, 6700 AC Wageningen, The
Netherlands; E-mail: nico.ogink@wur.nl;
4INRA, UMR1348 PEGASE, Domaine de la Prise, 35590 Saint Gilles, France; E-mail:
nadege.edouard@rennes.inra.fr;
5Wageningen UR Livestock Research, P.O. Box 135, 6700 AC Wageningen, The
Netherlands; E-mail: hendrikjan.vandooren@wur.nl;
6Department of Agricultural Engineering, Federal University of Viçosa, Av. P. H. Rolfs,
S/N, Viçosa, 36570-000, Minas Gerais, Brazil; E-mail:iftinoco@ufv.br;
7Wageningen UR Livestock Research, P.O. Box 135, 6700 AC Wageningen, The
Netherlands; E-mail: julio.mosquera@wur.nl;
Corresponding author: Luciano Barreto Mendes, Av. P.H. Rolfs S/N, Viçosa, Minas
Gerais, 36570-000, Brazil; phone: +55 31 3899 3465; e-mail: luciano.mendes@ufv.br.
Abstract
Monitoring emissions in naturally ventilated (NV) livestock barns is still a challenge, where direct estimation of the ventilation rate is a problem. The tracer gas ratio method, using CO2 as natural tracer, has been suggested as a pragmatic option to measure
outside (background) the barn. Due to the expected spatial variability of air and gaseous flow patterns within the barn airspace, simultaneous monitoring of gaseous CO2
concentrations at multiple points within the NV barn might help to reduce the uncertainty associated to emission measurements. Most of the currently used measurement instruments to monitor CO2 concentrations are expensive, or show
problems when switching between multiple points. The aim of this research was to assess the performance of a low-cost Non-Dispersive Infra-Red (NDIR) sensor for intensive spatial and temporal field monitoring of CO2 concentrations in a NV dairy
cow house. This was performed by comparing NDIR sensors with two commonly applied methods, a Photo-Acoustic Spectroscopy (PAS) Gas Monitor and an Open-Path laser (OP-laser). The specific objectives of this research were: (a) to test the NDIR sensor in the laboratory for linearity, variability between sensors and sensitivity to ambient static pressure; (b) to compare and validate laboratory and field calibration procedures for use of the NDIR sensors in naturally ventilated (NV) livestock barns; (c) to evaluate the impact of Mean Integration Times (MITs) on the performance of NDIR sensors compared to PAS and OP-laser methods. First, calibrations for the NDIR sensors were obtained in the laboratory and in the field. Then, laboratory and field calibrated sensors were again applied in the field for comparison with the PAS and OP-laser methods in a validation trial. The main conclusions were: (a) The tested NDIR sensor is a feasible alternative to monitor single-point or averaged spatial CO2
concentrations in livestock barns by presenting a small variability between sensors of 5%, a sensitivity to static pressure of 0.08% of the reading per each 1hPa, and yields field measurements with an average uncertainty of 9 %; (b) Field or laboratory calibrated NDIR CO2 sensors for multi-point monitoring of CO2 concentrations in NV
livestock barns are recommended, and can be as reliable as the PAS and the OP-laser methods; (c) The effect of using different MITs on the performance of NDIR sensors compared to the PAS and OP-laser methods was negligible.
Keywords: ventilation rate, CO2 mass balance, dairy barn, Open path laser, photo
13
Introduction
Over the past three decades, considerable research effort has been spent on the search of appropriate methods for measuring emissions from mechanically and naturally ventilated (NV) livestock buildings. Measuring air ventilation rates and emissions in NV buildings is still a challenge, due to the large uncertainty and variability associated with these measurements (Calvet et al., 2013; Ogink et al., 2013;Takai et al., 2013).
Nowadays, no reference method exists for measuring air ventilation rates in NV animal houses. However, a number of different candidate approaches have been suggested (Calvet et al., 2013), such as the tracer gas technique using either natural (Feddes et al., 1984; van Ouwerkerk & Pedersen, 1994; Heber et al., 2001; Blanes & Pedersen, 2005; Xin et al., 2009; Samer et al., 2012; Mendes et al., 2013) or artificial tracers (Demmers et al., 2001; Snell et al., 2003; Wu et al., 2012; Kiwan et al., 2013). The use of carbon dioxide (CO2) as a tracer gas (CO2 mass balance approach) for
measuring ventilation and emission rates in livestock building was first described by Feddes et al. (1984). This method uses naturally produced CO2 (from the animal and
manure) as a tracer. The tracer is therefore homogeneously distributed throughout the building and presents good mixing with most of the target gases found in livestock houses (Pedersen et al., 2008). The CO2 mass balance relies on (a) accurate
measurements of CO2 concentration in- and outside the animal barn, and (b) on accurate
prediction of the metabolic heat production and accurate registration of the parameters used in the heat production model (CIGR, 2002; Pedersen et al., 2008). Measuring gaseous concentration distribution in NV livestock structures represents a real challenge in research (Calvet et al., 2013). For instance, Lefcourt (2002) showed that incorrect selection of sampling positions for ammonia (NH3) in NV animal barns may lead to
errors in calculated NH3 emission rates from 50% to over 200% of the actual values. It
are often expensive, or show problems when switching between multiple points, resulting in complex, costly and labor intensive systems (Heber et al., 2006).
Currently applied systems to monitor CO2 concentrations from agricultural
facilities include Photo Acoustic Spectroscopy (PAS) Gas Analyzer (Hinz & Linke, 1998a; Hinz & Linke, 1998b; Heber et al., 2001; Wheeler et al., 2006; Topper et al., 2008; Xin et al., 2009; Chepete et al., 2012; Mendes et al., 2012; Zhao et al., 2012; Hassouna et al., 2013; Nicoloso et al., 2013); and the Open-Path laser (OP-laser) (Griffith et al. (2002), Grutter (2003), Hashmonay et al. (1999), Eklund (1999) and Piccot et al. (1994), (Amon et al., 2001; Childers et al., 2001; Briz et al., 2009; Barrancos et al., 2013). An important disadvantage of applying either PAS or OP-laser is the high purchase cost, in particular when multiple sampling is required. Due to the large spatial variability in livestock buildings, the use of more inexpensive CO2
monitoring systems, allowing for multiple point sampling may result in similar, or even better, levels of accuracy than using more accurate and more expensive methods. It is crucial that the accuracy of the alternative methods is within acceptable values, and that it is properly compared and calibrated against reliable (currently used) techniques.
Non-Dispersive Infra-Red (NDIR) sensors, a low-cost technology based on the principle of light absorption in the infrared region, have been suggested as an alternative mean to measure CO2 concentrations in NV livestock buildings. The selection of
appropriate calibration procedures, sampling scheme and time-resolution is also essential. For instance, Wood et al. (2013) stated that the resolution of integration in discrete measurements may result in biased estimates of fluxes over time. Xin et al. (2009) showed, when comparing ventilation rates (VR) in a broiler house measured with the CO2 mass balance method and the standard summation of all individual fans,
that a time resolution below 30 min may result in significant differences between both methods when monitoring CO2 concentrations. On the other hand, Estelles et al. (2010)
showed deviations up to 1.5% when calculating VR and ammonia (NH3) emissions
from mechanically ventilated livestock buildings, when using different mean integration time (MIT) values, varying from 1 hour to daily basis.
The goal of this study was to assess the performance of a low-cost NDIR sensor for intensive spatial and temporal field monitoring of CO2 concentrations in a livestock
15
between sensors and sensitivity to ambient static pressure; (b) to compare and validate laboratory and field calibration procedures for use of the NDIR sensors in NV livestock barns; (c) to evaluate the impact of MIT on the performance of NDIR sensors compared to PAS and OP-laser methods.
Material and methods
In order to assess their feasibility for use in NV livestock barns, the NDIR sensors were first tested in the laboratory for linearity, variability between sensors and sensitivity to static pressure. Then, lab calibrations were developed for the sensors and their application in the field was evaluated. The sensors were brought to the field for exposure to actual CO2 concentrations in a NV dairy cow barn, and compared with two
other measuring devices, the PAS analyzer and the OP-laser. As a result, field calibrations of the sensors were obtained. Bland-Altman charts were plotted to assess the agreement between laboratory and field calibrations. Finally, laboratory and field calibrated sensors were applied in the dairy barn for comparison with the PAS and OP-laser methods in a validation trial. The uncertainty of estimating CO2 concentrations
with the developed calibration equations was assessed by calculating the Normalized Root Mean Square Error (NRMSE). A detailed description of the methods, experimental procedures and data analysis conducted to meet the objectives of this study is provided below.
Description of the carbon dioxide measuring devices
NDIR CO2 gas sensor: Consists of a portable sensor (model SD-GAS-025,
Sensor Data1 B. V., Rijswijk, The Netherlands) housed in a 0.20L × 0.05W × 0.05H m
polyethylene enclosure, with vents though which ambient air enters either by local convection or passive diffusion. Its measuring principle is based on gas absorption of radiation at a known wavelength. The absorption intensity is proportional to the concentration of the gas (Jäger et al., 2005; Frodl & Tille, 2006; Park et al., 2010). Sensor measuring range is 0.2 - 5000 ppmv of CO2 concentration, sensitivity of 20
ppmv ± 1% of the reading and accuracy of 30 ppmv ± 2%. The NDIR sensors were excited with a voltage of 1200 mV, and connected to a datalogger system (CR1000, Campbell Scientific, Inc., Logan, Utah) located in a shelter placed outside the barn
1 Mention of product or company names is for presentation clarity and does not imply endorsement by the
(figure 1). CO2 concentrations were measured every 2s, and 5 min averages were stored
by the datalogger.
OP-laser: This device (model GasFinderFC, Boreal Laser, Alberta, Canada) measures the average gaseous CO2 concentration in the air between the laser source and
the reflector. It has a sensitivity of 2500 ppmm (2.5 ppmv), scan rate of 1 sample per
second, and a path measuring range of 1 ~ 1000 m. The sensitivity depends on the path length and the strength of the absorption line. The OP-laser was set up to measure CO2
concentrations in the central axis or the barn (path length of 64m), at approximately the same level as the NDIR sensors (3 m above slats). A remote retro-reflector (prism like mirror) was installed on the wall at the opposite side of the barn for reflection of the laser beam back to the beam source. Data was stored at every 2 s, downloaded at the end of the measurement period and later filtered for reflection quality and correlation coefficient of the current spectrum for CO2 concentration against the stored reference
gases (R2 ≥ 0.80), then 5 min averages were calculated.
PAS analyser: Its measuring principle (photo-acoustic spectroscopy) is based on the conversion of light energy into an acoustic signal, which is detected by very sensitive microphones (I.A.I., 2005) placed on the wall of the measurement chamber. The device (model 1312, INNOVA AirTech Instruments A/S, Ballerup, Denmark) was set to measure only CO2 concentrations at a sampling interval of 40 s, 10 s for flushing
and an time integration interval of 5 min. The PAS was programmed to monitor dew point temperature (Tdp) in order to account for cross-interference with moisture in the
air. Prior to the beginning of the experiments, the PAS analysers were sent to the manufacturer for calibration for CO2, other gases and crossed interference with water
vapour, in order to certify that deviation on concentration measurements was under the tolerance level of 5%.
Laboratory tests and calibration of NDIR sensors
Prior to their installation in the animal house, the NDIR sensors were tested in the laboratory for output linearity and sensitivity to static pressure. For the test of linearity, span gas at 1952 ppmv concentration of CO2 was diluted with zero gas (N2) at
the percentages of 0, 10, 20, 30, 40, 50, 60, 70, 80, 90 and 100 % of the span gas, resulting in concentrations of 1952, 1756, 1558, 1363, 1168, 977, 778, 586, 390, 197 and 0 ppmv of CO2, respectively. One NDIR sensor was exposed to gas at each
17
the average static pressure to which the sensors are exposed during field measurements. After stabilization of the sensor output (mV), a few readings were recorded. Gaseous mixture static pressure and temperature at the entrance to the sensor were kept approximately constant.
For the static pressure sensitivity test, CO2 span gas at 1952 ppmv was passed
through a NDIR sensor at the following relative pressures: 1.5, 4.5, 9.0, 15.0, 23.0 and 33.0 hPa. The relative pressure values were achieved in the laboratory by applying a surplus pressure inside a sealed protecting case where the sensor was housed. After full reading stabilization, sensor raw data was recorded for each static pressure level. Air temperature was kept approximately constant during the test and recorded. The sensitivity of the NDIR sensors to static pressure was calculated according to equation 1.
sp raw
S 100
raw sp
(1)
where:
Ssp - sensitivity of the NDIR to change in static pressure (% of change in raw
data per unit in pressure);
Δraw - measured range of raw data (mV); raw - mean raw data value (mV); Δsp measured range of pressure (hPa);
To account for sensor individual variability and to allow independent direct comparison with the standard methods, a two-point calibration was developed in the laboratory for every NDIR sensor. Sensors were excited with a voltage of 1200 mV and exposed to calibration gases at 0 ppmv of CO2 (N2) and 1952 ppmv (spam) at a flow rate
Description of the livestock barn
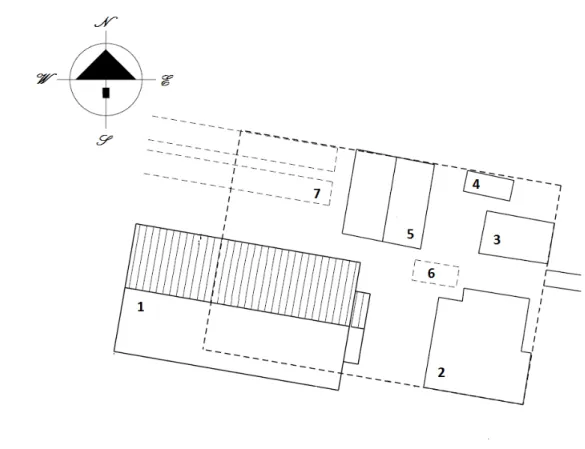
This study took place in a dairy cow barn (figure 1). The barn is located in Bunschoten, in the middle of the Netherlands, is east-west oriented, a roof with 37% slope, and has dimensions of 64 Lenght × 38 Width × 4 Height m (L × W × H). The building envelope is composed of insulated roof and side walls, the lateral openings on both sides are 2.75 m high, protected with stainless steel screens with openings of 5 × 5 cm and has manually operated curtains. In the eastern part of the building there is a deep litter area of 10L × 21W m with maximum housing capacity of 25 dry and pregnant cows. In the central part of the building, 3 double-rows of cubicles (paper chips bedding; 42L × 21W m) are located, with feeding alleys on both sides (north and south), and maximum housing capacity for 150 lactating cows. The last section of the barn is at the most western side, has an area of 13L × 21W m with similar cubicles and bedding system as for the lactating cows, where the heifers are kept (maximum capacity of 40 heifers). Barn cubicles area had slatted walking alleys and an automatic scraping robot. Manure is stored in a deep pit space of 65L × 21W × 2D m located under the slats and cubicles. Manure was removed from the barn twice a year, usually during early spring and fall seasons. The lactating cows had free access to 3 milking robot systems. All cows were kept inside all year long and were fed with roughage (grass and corn silage) concentrate. The data collection and validation trials in the barn were conducted during the summer season, in the months of June, July and August of 2012.
Field experimental setup and data collection procedure
Prior to each measurement campaign, the OP-laser was installed in the barn to sample the average CO2 concentration in an open-path of 64 m along the central axis of
19
order to assess the effect of averaging out data from the NDIR sensor when compared with the OP-laser, the average raw data from the five evenly distributed sensors were averaged out into four distinct mean integration times (MITs: 5 min, 15 min, 30 min and 60 min).
Figure 1. Plan view of the investigated barn with the allocation of the different carbon dioxide (CO2) measuring devices and temperature (T) and relative humidity (RH)
sensors (not to scale).
For the comparison of the NDIR sensors with the PAS analyzer, three air sampling ports were installed to collect samples from three fixed different points inside the barn (figure1). The PAS analyzers were placed inside the shelter located at the west part outside the building. The sampling lines consisted of Teflon tubes (0.63 cm internal diameter) with Teflon filters (4.7 cm diameter, 5 μm pore diameter) installed at the end. The air was drawn by the internal pump of the PAS analyzers, with a flow rate of approximately 0.108 m3 h-1 during measurements, and 0.018 m3 h-1 when flushing the measurement chamber. Each PAS analyzer was programmed to sample CO2
concentrations at every 40s, with 10 s for flushing, and to store average values at every 5 min. Data was downloaded from the analyzers at the end of each measurement. During every trial, three NDIR sensors were installed at the same height and next to each of the PAS analyzers’ sampling ports (within a distance of 0.3 m radius) for simultaneous measurement of CO2 concentration. A total of three trials were performed,
individual variability. Data sets for all performed trials were pooled together prior to the statistical analyses. The impact of averaging out sensor output in estimating CO2
concentration from PAS analyzer was also performed at four different MIT levels (5 min, 15 min, 30 min and 60 min).
For the determination of local static pressure correction factor (fSP), a pressure
sensor was installed inside the shelter along with the other instruments, pressure data was stored at every 15 min.
Regression analysis for field calibrated NDIR sensors
Regression analysis of the raw data (mV) from the NDIR sensors was performed as a function of the CO2 concentration ([CO2]) measured by either OP-laser or PAS
analyzer, with the procedure procreg in SAS®, and fit to a linear model (Equation 2).
Additionally, Pearson correlation was carried out on the pooled set of measurements paired in 5, 15, 30 and 60 min intervals.
CO2
A B raw (1)where:
[CO2] - carbon dioxide concentration measured with a standard method, either
PAS analyzer or OP-laser (ppmv);
raw - NDIR sensor output data (mV);
A and B - empirical coefficients obtained from regression (ppmv and ppmv mV-1,
respectively).
Analysis of agreement between laboratory and field calibration methods
The agreement between the calibration method and each of the standard measurement methods (OP-laser and PAS analyzer) was assessed by regressing the difference between CO2 (Diff[CO2]) concentrations determined with laboratory and
field calibration methods and the average CO2 concentration (Avg[CO2]) obtained by
both methods by using the analysis of agreement proposed by Altman & Bland (1983):
2
0 1
2
Diff CO Avg CO (3)
21
Diff[CO2] - ([CO2]laboratory calibration – [CO2]field calibration), difference between CO2
concentrations obtained from the NDIR sensors by using laboratory and field calibrations, ppmv;
βo - Y-intercept, a measure of systematic positive or negative bias, ppmv;
β1 - Slope, a measure of systematic heterogeneous bias,
non-dimensional;
Avg[CO2] - ([CO2]laboratory calibration + [CO2]field calibration)/2; average between
concentration measurements obtained with laboratory and field calibration methods, ppmv.
In equation 3, the intercept (βo) and the slope (β1) represent homogeneous and
heterogeneous systematic bias, respectively. A test of significance for each coefficient was carried on with procreg in SAS® to assess if βo and β1 were statistically different
from zero.
Field validation and uncertainty analysis
After the development of laboratory and field calibrations (obtained from equation 2), the NDIR sensors were once again exposed to CO2 concentrations in the
dairy cow barn, next to the standard methods (PAS analyzer and OP-laser) for a period of 48 hrs, with the same setup as done during the comparison trials. Then, CO2
measurements from the NDIR sensors were compared to the standard methods and the NRMSE was determined as a measure of uncertainty. According to Currell & Dowman (2009), for a given linear calibration equation with the shape of equation 2, the NRMSE can be calculated by equation 4.
2n
2 2
t 1
2 max 2 min
CO CO
100 NRMSE
CO CO n
(4) where:NRMSE - normalized estimated root mean square error (% over the measured range);
CO2 max
,
CO2 min
- maximum and minimum measured carbon dioxide concentrations (ppmv), for measurements taken at every 5
CO2
- concentration of carbon dioxide measured by the standard (either PAS or OP-laser) method (ppmv);2 CO
- concentration of carbon dioxide measured by the field or
laboratory calibrated NDIR sensor method (ppmv);
n - number of observations used in the validation.
Results
Laboratory tests with the NDIR sensors
The results of the linear regression performed for NDIR sensor raw data against CO2 concentration is presented in figure 2.
Figure 2. Plot of the linear response of sensor (mV) to calibration gas CO2 concentration
(ppmv).
The performed test of linearity indicates that within the range of 0 to 1952 ppmv
of CO2 the sensor had a nearly perfect linear response (p<0.0001), with intercept and
slope of (-11 ± 2) ppmv and (10.54 ± 0.02) ppmv mV-1. Such outcome is in agreement
23
The analysis of sensitivity to static pressure yielded a Ssp value of 0.08% of the
reading per each 1hPa, over the tested range. This result agrees to the specifications of the sensor factory of 0.1% (SenseAir®, 2010). The detected sensitivity to static pressure might be due to effects of pressure on sensor circuitry, causing it to respond slightly differently when static pressure fluctuates around a constant value.
Next to the tests of linearity and sensitivity to static pressure conducted with the NDIR sensors, individual calibration was performed in the laboratory and the results are presented in table 1. In each equation, both the intercept and slope were tested against the hypothesis that the intercept and the slope are significantly different than one and zero respectively. When comparing the coefficients of calibration equations within the 17 sensors presented in table 1, one notices that they present some variability between one another. For instance, when using the sensors to measure a typical CO2
concentration of 910 ppmv, the range of measurements with the different sensors was
within 896 to 942 ppmv, resulting in an overall standard error of mean from all 17
sensors of 4 ppmv, corresponding to variability between sensors of 5%.
Table 1. Laboratory two-points individual calibration equations for the NDIR sensors raw data (mV) against CO2 concentration ([CO2], ppmv), for the linear model of the
form [CO2] = a + b · raw
Sensor ID a ± SE b ± SE
03062CE1 -11 ±10 10.40* ± 0.30
03062CD1 -9 ± 7 10.40* ± 0.20
03062CDF -9 ± 8 10.40* ± 0.20
0306281F -9 ± 14 10.10* ± 0.10
0305EFAB -9 ± 8 10.06* ± 0.06
0306820 -10 ± 7 10.08* ± 0.05
0306813 -9.8* ± 0.5 10.12* ± 0.03
03062CE0 -10* ± 1 10.12* ± 0.01
03062CD5 -10 ± 6 10.13* ± 0.04
030627C8 -9 ± 7 10.13* ± 0.05
0305DEF5 -10.4* ± 0.2 10.13* ± 0.01 03062CD3 -9.5* ± 0.4 10.13* ± 0.03 030627CA -9.4* ± 0.2 10.13* ± 0.01
03062CD4 -10* ± 3 10.14* ± 0.02
03062D34 -11* ± 7 10.61* ± 0.03
030627CB -10* ± 3 10.13* ± 0.02
03062C0 -15* ± 6 10.64* ± 0.01
*Mean value is significantly different than zero at the level of 95% probability.
the experimental trials were performed. During this time frame, the drift in calibration coefficients observed in each individual sensor was rather negligible, although over longer times of sensor exposure, significant drifts from calibration might be present. However, effects of long exposure time on sensor calibration equations was not the purpose of this study, and might be a subject for further investigation on field application of NDIR sensors.
Field calibration of individual NDIR sensors with PAS analyzers and OP-laser
The results of the field calibration of the NDIR sensors with the PAS analyzers and OP-laser are presented in figure 3 and 4, respectively, for different MIT values. The regression analysis indicated that the data presented good fit to a linear model (p<0.0001). The similarity amongst intercept and slopes for different MITs shown in figures 3 and 4 indicates that its effect on the concentration value is considered negligible. Namely, varying MIT from 5 to 60 min yielded regression coefficients that varied from (8.60 ± 0.04) ppmv mV-1 to and (8.78 ± 0.06) ppmv mV-1 for the field
determined calibration equations of the NDIR sensors compared to the PAS analyzers. The regression coefficients varied from (10.01 ± 0.04) ppmv mV-1 to (10.2 ± 0.1)
ppmv mV-1 for the field determined calibration equations of the NDIR sensors compared
to the OP-laser. The data presented in figures 3 and 4 show that both calibration methods presented strong correlation (R2 = 0.87 - 0.97 and R2 = 0.94 - 0.96 for
25
Figure 3. Relationship of CO2 concentrations ([CO2]) measured with the PAS analyzer


![Table 1. Laboratory two-points individual calibration equations for the NDIR sensors raw data (mV) against CO 2 concentration ([CO 2 ], ppm v ), for the linear model of the](https://thumb-eu.123doks.com/thumbv2/123dok_br/15393754.68754/37.892.261.672.698.1009/table-laboratory-individual-calibration-equations-sensors-concentration-linear.webp)
![Figure 3. Relationship of CO 2 concentrations ([CO 2 ]) measured with the PAS analyzer](https://thumb-eu.123doks.com/thumbv2/123dok_br/15393754.68754/39.892.204.748.120.628/figure-relationship-concentrations-measured-pas-analyzer.webp)
![Figure 4. Relationship of CO 2 concentrations ([CO 2 ], ppm v ) measured with the OP-laser](https://thumb-eu.123doks.com/thumbv2/123dok_br/15393754.68754/40.892.210.772.113.639/figure-relationship-concentrations-ppm-v-measured-op-laser.webp)