307
BUSINESS PERFORMANCE, INVESTMENTS
AND COMPETITIVENESS OF ISTRIAN HOTEL
INDUSTRY
Dijana Pletikosa
1Abstract
Istria is often mentioned as one of the most developed tourist regions of Croatia. In order to recognize its significance in the Croatian and international tourism markets this research compares performance of Istrian hoteliers with those of domestic and foreign competitors. The other purpose of this paper is to assess the impact of domestic and foreign direct investments on the financial results of Istrian hoteliers. Analyse of Istrian hotel companies business performance has been made regarding the origin of invested capital. General findings show that among the best performing hoteliers there are equally domestic and foreign owned companies, as well as among the loss making ones. Contrary to initial expectations this research did not confirm thesis that Istria is highly successful and competitive tourist region. Reasons for that are many, such as seasonality, lack of high class hotels and quality greenfield investments.
Keywords: Istria, hospitality industry, hotel performance, investment, competiveness.
Jel Classification: L83
INTRODUCTION
Istria, formerly Histria, is the largest peninsula in the Adriatic Sea located in the north between the Gulf of Trieste and the Bay of Kvarner. It is shared by three countries: Croatia, Slovenia and Italy. This paper investigates the Istrian County, which is Croatian part of the peninsula. It is often perceived as the most developed tourist region of the country. The first scientific research of the history of tourism in Istria and Kvarner was made by Blazevic (1987). Chronology of reliable data on tourist development began in 1600 mentioning the Istrian Spa that was first used by the Romans. Interesting history and health improving climate of the region continued to attract visitors over the centuries, reaching the number of 100,736 tourists in 1910 (Blazevic 1987, 304). Development of the modern tourism in Istria began in the sixties of the last century, mainly due to the favourable geographical position in relation to the main tourist markets, an attractive
1Dijana Pletikosa, PhD, Lecturer, University of Applied Sciences Vern', Zagreb, Croatia.
Review
308
natural basis for the spa and other forms of coastal tourism as well as anthropogenic tourist attractions.
According to the Croatian Central Bureau of Statistics, culmination of tourism development of destinations on the western and southern coasts of Istria took place from 1985 to 1990, when this area registered the highest number of tourist beds and overnights (Figure 1). During and after the recent war there was a significant slowdown in the previous intensive development of tourism, although Istria experienced no material destruction of tourist facilities and infrastructure. New tourism boom began in this millennium when Istrian coastal destinations were again included and reaffirmed in the domestic and international tourism market.
Comparing the tourism results after 2001 with those performed from 1981 to 1990 (the best year being 1988) it was obvious that the leading Istrian coastal destinations have not reached the level of tourist visits and overnights they had in the pre-war period (Vojnovic 2012). At the same time the average length of tourist stay shortened from nine days in 1987 to 6.66 days in 2012 (CBS 2013).
Figure 1. Tourist arrivals and tourist nights in Istria from 1988 to 2012
Istria is one of the first counties in Croatia which has created the Regional Operational Programme (IDA 2005) as the standard instrument used in the European Union to encourage regional development. The ROP created the basis for attracting domestic and foreign investors and for potential public-private partnership projects. Additionally, the Tourism Master Plan of Istria was published in 2004, specifying a model of restructuring and market repositioning of the region. The main idea was to increase accommodation capacity by 18% while improving the quality that will enable the growth of tourist traffic
by 45–50%. It was designed to increase employment and achieve a long lasting
competitiveness of the Istrian tourism by 2015 through investment projects of public and private sector (Istrian County, 2011).
Istria is today the largest Croatian tourist region that carries one third of the total Croatian tourist traffic and counting up to 250,000 accommodating units. Despite that, according to the CBS data, tourism takes only the third place among the activities contributing to Istrian GDP (11.9%), the first being an industry (25.4%) and trade as the second most important (20.8%). Most Istrian hotel capacities belong to the five largest Croatian hotel groups. Regarding the annual revenue criteria published by Croatian Financial Agency (FINA) all Istrian tourist companies are listed among the first fifteen.
0 5 10 15 20 25
1988 1991 1995 1999 2002 2009 2012
M
il
li
o
n
s
Overnights
Arrivals
309 For the last twenty years all hoteliers have been going through ownership changes and constant organizational restructuring.
According to the Ministry of Tourism data for 2012, a total of 94 hotels operated in Istria, which was 16% of the total number of Croatian hotels. Hotel accommodation capacity of Istria is 26,570 beds, respectively the 27% of all beds in Croatia. Most of the hotel accommodation capacities in Istria (41%) are rated as three-star hotels, 38% of them as a four-star, followed by two-star hotels (16 %). Only 5% among them are rated five-star. The average Istrian hotel category is only three-star, lagging behind the average of Croatia and almost all other tourist regions where it is commonly rated as four-star. Thereby it is equated only with the average category of the Croatian inland hotel, strongly imposing the need to invest in improving the quality of accommodation as well as whole destination to the four stars level.
1. ISTRIAN HOTEL INDUSTRY PERFORMANCE
Accommodation and food service activities data processed according to the National
Classification of Activities (NACA, Version 2007) and provided on request by the FINA
show that 652 entrepreneurs operated in Istria in 2012, which was an increase of 19% compared to 2008. More than half of the total number of active businesses in 2012 were operating at a loss, while profit achieved only 42% of them (Table 1). At the same time Istrian hospitality industry in total performed operating profits, unlike 2010 and 2011 when it made a net loss (FINA 2014).
Table 1. Financial results of Istrian hotel companies in thousand HRK
Year 2008. 2010. 2012.
Number of companies 529 598 652
Profitable companies 240 209 276
Loss making companies 289 389 376
Number of employees 7.900 7.632 8.253
Total revenue 3.292.572 3.160.856 3.981.924
Total expenditure 3.259.481 3.382.035 3.708.164
Profit before tax 197.384 143.731 446.444
Loss before tax 164.292 364.910 172.685
Income tax 30.200 15.208 32.031
Profit for the period 167.613 120.629 414.757
Loss for the period 164.722 357.016 173.028
Profit or loss of the period 2.891 -236.388 241.729
Export 1.625.210 1.718.558 2.159.676
Import 228.439 105.086 99.256
The trade balance (exp minus imp) 1.396.772 1.613.472 2.060.421
Investments in fixed capital 1.223.453 438.355 703.523
Average monthly net salary 4.681 5.070 5.305
The biggest hospitality industries entrepreneurs mostly belong to the subgroup named
Hotels and similar accommodation (NACA 55.10), but quite often have their own
310
Based on the revenue criterion (FINA data obtained on request, 2014), five of the biggest Istrian hoteliers are at the same time the biggest in the whole Croatia. Consolidated financial statements show that all five companies in 2012 have made profits significantly higher than in previous years. It was due to a very good tourist season and even more to investments in accommodation and facilities improvement. For example, Riviera Adria had significant losses in 2010, very small profit in 2011 but in 2012 company made a profit of HRK 52.67 million. Profitability indicators were significantly improved and raised above the average of leading companies. The company has maintained a good liquidity, but indebtedness slightly increased as a result of long-term liabilities. Total revenue growth and decline in the number of employees resulted in a high level of productivity. Plava Laguna is a foreign-owned company that for many years achieved extremely good results. In 2012 company realized a profit of HRK 106.8 million which was 10.2 million more than in 2011. The debt ratio was low, and thanks to the reduction of the number of employees by 8.8% productivity was increased compared to 2011. Istraturist from Umag in 2012 increased revenue by 12.1 % making 47.2 million Kuna profit, more than double compared to 2011. Company stated a growth in gross margin and rate of return of assets and capital, while current ratio and the debt remained at the previous level. Good results and increase in average values of selected indicators were achieved thanks to continuous investment. In 2014 the company was acquired by Plava Laguna, becoming a part of the biggest Istrian and Croatian hotel company.
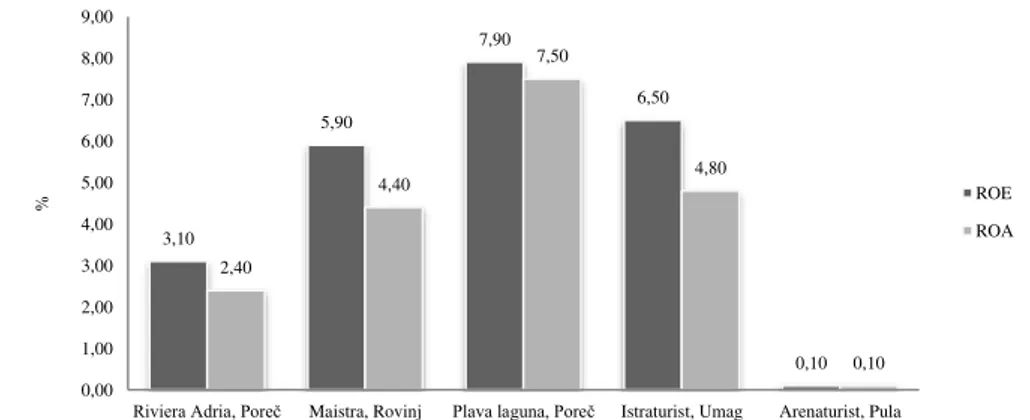
Return on Assets (ROA) as the ratio between net profit and total assets of enterprises, and Return on Equity (ROE) as the ratio of net income of equity capital of the largest Istrian hoteliers are shown in Figure 2. Plava Laguna has had the largest increase in assets (7.5 %) and capital (7.9 %) by far, followed by Istraturist Umag, Maistra from Rovinj and Riviera Adria. At the last place was Arenaturist from Pula with increase of 0.1%.
Figure 2. Profitability of assets (ROA) and equity (ROE) of the largest Istrian hoteliers in 2012
Among all Istrian hoteliers only Plava Laguna from Porec and Maslinica from Rabac are foreign-owned company, while the official FINA statistics classify all other as domestic enterprises. It should be noted that two other hoteliers (Riviera and Arenaturist) could be seen as companies receiving foreign direct investment (hereinafter FDI).
3,10
5,90
7,90
6,50
0,10 2,40
4,40
7,50
4,80
0,10
0,00 1,00 2,00 3,00 4,00 5,00 6,00 7,00 8,00 9,00
Riviera Adria, Poreč Maistra, Rovinj Plava laguna, Poreč Istraturist, Umag Arenaturist, Pula
% ROE
311 Majority of their shareholders have funds registered in Croatia but they are mostly financed by foreign capital. The largest shareholder of Istraturist from Umag was a domestic bank which is owned by another foreign bank. Only Maistra from Rovinj and Laguna from Novigrad could be classified as entirely domestically financed companies. The Residence Skipper from Savudrija which owns a hotel managed by an international
brand Kempinski is also listed as FDI hotelier. Despite the greenfield investment, famous
name and facilities such as golf course, this hotelier operates at a loss. The most likely
causes are “overinvestment" or over indebtedness and slow return on investment. The result was a net profit margin of minus 50.10% in 2011 and minus 39.9% in 2012. Common to all analysed companies is continuous investment in quality improvement. The plan was to invest about four billion Kuna and create 700 new jobs by 2015.
2. INVESTMENTS IN ISTRIAN HOSPITALITY INDUSTY
Based on Financial agency data for the period from 2008 to 2012 (FINA, 2014) Istrian entrepreneurs operating in Accommodation and food service activities (“I”) invested nearly HRK 3.3 billion. As the Figure 3 shows, about 80% of that amount (HRK 2.6
billion) had been invested in Hotels and similar accommodation (subgroup 55.10).
Figure 3. Gross fixed capital formation in fixed assets of Istrian hoteliers
The first strategic goal of the Regional Development Plan of Istria (Istrian County 2005) was to establish highly competitive economic environment. One of the measures envisaged to achieve the objective was determination to attract foreign investors. In the period from 1993 to 2012 Istria received one billion two hundred million euros of foreign direct investments (FDI). As the Table 2 shows, Hotels and restaurants attracted EUR 121.3 million, which was only 10% of the total FDI inflow. Unfortunately the most hotel industry FDI relate to the purchase of domestic hotel companies during transition and privatization process while a smaller part refers to much favourable greenfield investments. Greenfield investment is defined as a form of FDI where a parent company starts a new venture in a foreign country by constructing new operational facilities from the ground up.
2008 2009 2010 2011 2012
NACE "I" activity 1.223.453 351.921 438.355 582.091 703.523
NACE 55.10 764.947 309.215 355.927 520.094 666.106
200.000 400.000 600.000 800.000 1.000.000 1.200.000 1.400.000
'0
0
0
312
Table 2. Foreign direct investments in Istrian County 1993 – 2012 (mill EUR)
NACE Activity Total
Manufacture of other non-metallic mineral products 395,5
Equity investments in real estate 282,1
Real estate 178,4
Hotels and restaurants 121,3
Manufacture of wearing apparel ; dressing and dyeing of fur 45,6
Recreational, cultural and sporting activities 38,7
Supporting and auxiliary transport activities 22,7
Other business activities 22,6
Wholesale trade and commission trade 21,7
Construction 17,9
Manufacture of chemicals and chemical products 17,8
Manufacture of motor vehicles, trailers and semi-trailers 15,5
Agriculture, hunting and related services 9,4
Total 1.208,39
One of the aims of this research is to compare business performance of FDI and domestic hotel companies through main financial indicators analysis. Data provided by FINA for the period from 2008 to 2012 show that total revenues of domestic hotel entrepreneurs increased by 31% though FDI revenue raised by18%. Total profit of the activity was faltering and in decline until the loss in 2011. The year 2012 was extremely successful for Istrian hoteliers achieving a total profit of more than 264 million Kuna. Increase in value added for domestic enterprises was 40%, and foreign ones only 21%. Number of domestic entrepreneurs in Istria was twice as much as foreign.
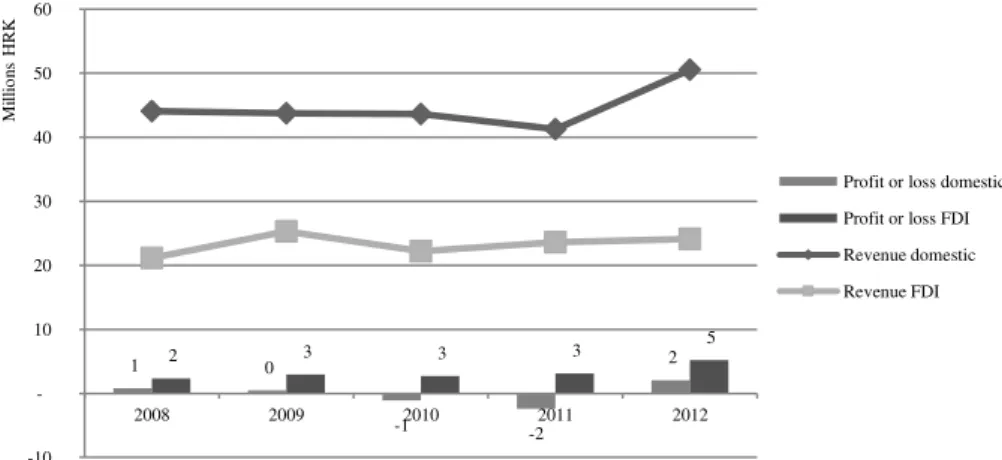
In further research average entrepreneur indicators were calculated by year and type of company ownership in order to obtain as reliable results as possible. It turned out that the cumulative average revenue of domestic hotelier in the reporting period surpassed the FDI company average revenue by 48% (Figure 4).
Figure 4. Average revenue and profit or loss of domestic and FDI hoteliers in Istria
As Figure 4 shows, in terms of net profit/loss results do not favour domestic owned businesses. In the period from 2008 to 2012 domestic hoteliers made cumulative loss of
1 0
-1 -2
2
2 3 3 3 5
-10 10 20 30 40 50 60
2008 2009 2010 2011 2012
M
il
li
o
n
s
HR
K
Profit or loss domestic
Profit or loss FDI
Revenue domestic
313 HRK 150,216, while FDI enterprises realized profit of HRK 16,260,570. In the same period average domestic entrepreneur invested in fixed assets 47% more than FDI one. The largest difference was at the beginning of the period (52% more domestic investment) than in 2012 (16% more).
The total value added was higher by 32% for domestic companies comparing to FDI hoteliers. Earnings before interest, taxes, depreciation and amortization (EBITDA) as a very important indicator of financial performance also speak in favour of domestic firms. An average EBITDA in the observed period was by 26% higher in domestic than in foreign companies.
Previously presented analysis of the best performing Istrian hoteliers showed that FDI and domestic owned companies have been equally represented among them. On the
other side, the major Istrian greenfield project - residence Skipper operates cumulating
losses and debts. Positive examples of FDI in hotel industry such as the Plava Laguna in
Poreč and Maslinica in Rabac were actually brownfield projects implemented through privatization process of previously state owned hotel companies. Brownfield project is FDI strategy used when a company purchases or leases existing production facilities to launch a new production activity.
3. INVESTMENTS IN SPECIAL FORMS OF TOURISM
According to Pirjevec (1998) main forces driving people to travel are: desire to escape from the routine of everyday life, need for vacation, recreation outside the usual environment, health improvement and the search for new experiences. Rest and recreation outside the usual environment involve specific major and a number of side activities on vacation accordingly affecting the final decision and behaviour of tourists in order to meet their travel needs.
TOMAS Summer survey is a research on attitudes and spending of tourists in Croatia
carried out and published by the Institute for Tourism (2011). It shows that every second Istrian tourist is middle-aged and travels with family members. The share of tourists older than 56 is on the rise, while the share of those younger than 35 is reduced compared to 2004. Most of Istrian visitors are good educated and earn monthly household income between EIR 1500 and 3000 (about 57% of respondents). This socio-demographic profile of tourists is in accordance with the primary motives of arrival to Istria, namely passive rest and relaxation (3/4 guests). Survey shows that 53% of respondents were attracted by entertainment possibilities and every fourth by gastronomy, which is above the average of all Croatian coastal counties. Significant number of visitors is attracted by the natural beauty (23% of respondents) and new experiences (19%). Compared with the 2007 survey, tourists quite more often come looking for passive recreation and entertainment, while the share of arrivals for sport, recreation and cultural monuments is in decline.
The results of TOMAS Summer 2010 survey also show that Istrian tourist is the most
satisfied guests among all Croatian coastal counties regarding all segments of tourist offer. It could be attributed to the systematic work on developing specific forms of tourism or so called special interest tourism as an alternative to mass tourism. Term
special interest tourism is in use for various forms of tourism focusing on activities that
314
et al. (2011, 40) classify special interest tourism into two main groups. The first is largely based on natural resources and includes various types of tourism such as medical, sports, nautical, ecotourism, rural, hunting and fishing, naturism and many others. The second group is based on social resources. The most common forms are congress, cultural, religious, gastronomic, oenologist, event and casino tourism. There are also many new forms such as shopping tourism, cruises, historical, mystical tourism and so on.
Several scientific researchers have been done proving the urge for diversification on
supply side of tourism. For example, Medina-Muñoz analyse wellness tourism
development on Gran Canaria. Authors imply that the growing commodification of health care and therapeutic landscape, as well as the recent growth in international demand for wellness services and treatments, has led to the proliferation of destinations and enterprises that have selected health and wellness tourism as part of their corporate
strategy, including coastal tourism destinations (Medina-Muñoz and Medina-Muñoz
2013). Another study explores a wine regional destination's perceived image according
to multiple theories such as servicescape2, place-based and destination choice. Authors
conclude that the most important winescape3 dimension is the natural beauty and geographical setting (Bruwer, Pratt, Saliba, and Hirche 2014).
Donohoe (2011) consulted more than 100 ecotourism experts from 39 countries employing the Delphi technique in order to assess the import of culture for ecotourism. The study identified cultural sensitivity as a contemporary ecotourism planning and
management imperative. While participants expressed concern about the process and
resources required to make ecotourism culturally sensitive, there was agreement about its importance and its contribution to sustainable development.
Interesting research evaluating the resources in a tourism destination has been done
by Sánchez Rivero, Sánchez Martín, Rengifo Gallego (2014). The authors state that not every criterion is equally important in the process of evaluation and ranking of the tourism potential of a destination's resources. An IRT methodology is applied to weight qualitative and hierarchical evaluation attributes by estimating a discrimination parameter tested using data from rural tourism resources in the Spanish province of
Cáceres. Istrian resources for rural tourism should be measured by the same methodology in order to evaluate its potential as destination.
Starting from the existing features of Croatian tourist offer the Tourism Development
Strategy of the Republic of Croatia by 2020 (Ministry of Tourism NN 55/13, 2013)
defines ten key tourism product groups which are to be developed by 2020. The aim is to attract a wider visitor segments prone to different types of travel as well as various pricing positions and traveling in different periods of the year. It should reduce seasonality and increase tourist spending. According to the Strategy, Istrian tourism products are divided into three segments. First and most present in Istria are old-fashioned products as sun and sea, heritage, gastro, rural, golf and cycling tourism. The secondary tourism product segment includes yachting, wellness, medical, events, creative and city tourism. The third group of products to be developed in Istria includes cruising, spa, religious tourism, diving, canoeing, hunting and adrenaline tourism.
2 Servicescape is a concept which emphasizes the impact of the physical environment in which a service
process takes place.
3 Winescape is defined as spatial realm that integrates winemaking and wine tourism within a vinicultural
315 Implementation of systematic investment in the development of specific forms of tourism in Istria is performed by private and public sector and specified by the Tourism Master Plan (Istrian County 2004). For example, for the period from 2010 to 2012 total expected investment in infrastructure, accommodation, services and attractions was HRK 7.1 billion. Due to objective circumstances such as global crisis and recession in Croatia which could not be foreseen in time of setting a plan, Istria invested HRK 5.8 billion, or 81.9% of totally predicted amount. According to data provided by the Istrian County Department of Tourism major hotel companies invested HRK 1.3 billion, or 15.7% of the total amount. The highest amount is invested in construction and improvement of accommodation facilities (60%), than in a variety of attractions and improvement of services (20% of investment in each activity).
Accommodation quality research (Horwath Consulting 2014) shows that an average Istrian hotel is three-star, same as in the Croatian inland, but lower than in other regions. A good part of the other hotel facilities is below Croatian average (eg number of hotels with conference hall, swimming pools, fitness and wellness centre, children's club, casino and marina). It could be explained by a smaller number of high class hotels than in other tourist regions of the country. Only considering the number of hotels with sports hall and tennis courts Istria gets ranking above the Croatian average.
One of the biggest problems of Croatian and therefore Istrian hotel industry is seasonality. Average operating period of Istrian hotels is 8.4 months, while hotels in the Croatian inland operate year-round. In a group of coastal regions slightly longer operate hotels in South Dalmatia (8.8 months). It may be associated with an average category of accommodation in that region which is mostly in five-star range. Seasonality as one of the main phenomena affecting world tourism depends on the characteristics of both tourism demand and tourism destinations in terms of location and services supplied. Cuccia and Rizzo (2011) focus their research on the cultural attractiveness of tourism destinations, investigating the role of cultural tourism in tourism seasonality. The authors analyse the seasonality of tourist presence in different destinations in Sicily, selected according to their different degree of cultural attractiveness. Similar research should be carried out for Istria in order to find out how its reach cultural and historical sites could improve hotel occupancy outside the main tourist season.
4. FINANCIAL RESULTS OF ISTRIAN HOTELIERS AND THEIR COMPETITORS
316
average rental rate for a single room. RevPAR is calculated as room revenue divided by rooms available.
In 2012 Istria registered almost 20 million overnight stays, i.e. 32% of total tourist nights in Croatia. At the second place was Kvarner region with 13.8 million overnight
stays (share of 22%) and the third was Split – Makarska region with 10.5 million tourist
nights (17%). The average hotel age in Istria is 44.8 years, which is roughly on par with the average of the country. Istria is the largest employer in the hotel industry with the share of 40.2% of all Croatian hotel workers.
The average annual Istrian hotel occupancy in 2012 amounted to 39.2% and was below the Croatian average (42.1%). City of Zagreb, Kvarner and South Dalmatia performed better results, while the Northern and Central Dalmatia were slightly worse. As expected, the lowest occupancy was registered in continent region (31%). Total Croatian total operating revenue per available room (TRevPAR) was EUR 16,555. Istrian TRevPAR in 2012 was EUR 14,625, i.e. 12% below the country average (Figure 5). Compared to other national regions Istria was significantly behind the others, especially compared with the Southern Dalmatia the City of Zagreb.
Figure 5. Hotel occupancy and TRevPAR of Croatian tourist regions
Indicators of almost all regions in 2012 were worse than in 2008, which was the last pre-crisis year for Croatian tourism. Average occupancy in 2012 fell by 4%, in Istria even worse (by 6%). At the same time average national TRevPAR decreased by 10%, while data for Istria improved by 2%.
The average realized daily room rate (ADR) in 2012 in Istria was EUR 69.85, i.e. by 36% less than in the South Dalmatia, but similar to Zagreb and 20% higher than in the continental part of the country (Figure 6). Compared to 2008 figures, an increase of ADR occurred in Istria and Kvarner (by 23%) and Southern Dalmatia (by 10%). At the same time the price was reduced in Central and Northern Dalmatia (by 11%) and the City of Zagreb (by 22%).
0 10 20 30 40 50 60
5.000 10.000 15.000 20.000 25.000 30.000 35.000 40.000 45.000
Istria Kvarner N and C Dalmatia
S Dalmatia Continent Zagreb Croatia %
E
UR
TRevPAR 2008
TRevPAR 2012
Occupancy 2008
317
Figure 6. Average Room Rate and Revenue per Available Room of Croatian tourist regions
In 2012 share of profit before fixed costs (GOP) in business income of Istrian hoteliers was higher than in the Croatian inland but lagged behind the country average by 5%. In relation to 2008 it was increased by 30%, more than in all other regions with the exception of Central and Northern Dalmatia, where the increase was 78%. According to this survey, the only regions achieving positive EBITDA were the Central and Northern Dalmatia (17.2%) and the City of Zagreb (14.6%). The whole country generated a loss before tax of 0.4% of total hotel revenue. The biggest loss was made by hoteliers in South Dalmatia (16.8%). Istria suffered a loss of 3.4%, which was the deterioration of 70% compared to 2008.
As the conclusion of the previous research (based on Horwath Consulting Hotel
Survey for various years) it could be argued that Istria is not the best Croatian tourist
region. In most categories it ranks at the national average, TRevPAR being even below that position. One of the main reasons for such average results are in shortage of high class accommodation, especially four-star hotels which have been proved to have most impact on profitability. Excellent indicators of physical performance as well as very good results of the major hotel companies probably contribute to public image of Istria as the most successful national tourist destination.
The main Croatian and thereby Istrian competitors selected for these analyses are successful receptive tourist countries such as Spain, Portugal, Italy, France, Greece and Turkey. There is a significant difference in accommodating capacities and consequently in number of overnight stays and tourist arrivals between Istria and other observed countries. Therefore, in order to get objective and reliable results, comparison is made regarding the specific hotel industry performance indicators, such as occupancy, ADR and RevPAR. Indicators for Istrian hoteliers are calculated according to Horwath Consulting surveys for the period from 2008 to 2012. Data source for other selected countries were STR Global Reports (2014a and 2014b) tracking supply and demand data for the hotel industry and providing valuable market share analysis for international, regional hotel chains and independent hotels.
Table 3 illustrates main findings of the analysis. Istrian hotel occupancy is far the lowest of all surveyed countries. The biggest difference is if compared to France (40%), followed by Spain and Turkey (39%). It is also by 28% worse than in the penultimate
0 20 40 60 80 100 120
Istria Kvarner N and C Dalmatia
S Dalmatia Continent Zagreb Croatia
E
UR
ADR 2008
ADR 2012
RevPAR 2012
318
Greece. In 2012 this indicator deteriorated for most observed countries compared to numbers in 2008 while Italy recorded an increase of one percentage point.
ADR or average daily room rate and RevPAR of Istrian hotels for the observed period were worse than those performed by all other competitors. Istrian ADR lags behind the
French by 56%. It is also worse than the Italian (by 45%), the Turkey’s (38%), the Greek
(by 36%), the Spanish (by 17%) and the Portuguese (14%). Despite that, in comparison to 2008 only Istria had an average price increase of 23%, while all the others noted certain deterioration of this indicator.
Table 3. ADR, RevPAR and hotel occupancy in Istria and selected countries
ADR in EUR RevPAR in EUR Occupancy in %
2008 2012 2008 2012 2008 2012
Istria 56.70 69.85 23.70 27.38 41.80 39.20
Portugal 82.72 78.09 49.92 44.42 60.30 56.90
Spain 93.47 85.00 58.86 54.40 63.00 64.00
Greece 114.51 98.73 73.07 54.12 63.81 54.81
Turkey 118.90 115.69 74.73 74.84 62.85 64.69
Italy 135.69 125.57 77.80 73.37 57.34 58.44
France 151.80 109.90 106.86 71.50 70.40 65.06
Spanish hotels have made the largest revenue per available room (RevPAR) in 2012, leaving Istrian hotels behind by as much as 74%. Portuguese and French hoteliers have
made by 63 or 61% better results. Turkey’s hoteliers were by 39% better than Istrian,
realising RevPAR of EUR 74.84. At the same time, Istria was the only tourist destination which increased RevPAR in relation to 2008 (increase was 15%) while the largest deterioration of that indicator occurred in France (35%).
CONCLUSION
319 of Croatia: frequent changes in tax policy, administrative barriers and unresolved regional plans and land registers. Only by addressing these key issues Istrian hoteliers
could attract much greater inflow of high-quality greenfield investment from home and
abroad and increase the competitiveness of destination.
REFERENCES
Blazevic, Ivan. 1987. Povijest turizma Istre i Kvarnera. Opatija: Otokar Kersovani.
Bruwer, Johan., Marlene Pratt, Anthony Saliba, and Martin Hirche. 2014. Regional destination image perception of tourists within a winescape context. Current Issues in Tourism. Taylor & Francis DOI: 10.1080/13683500.2014.904846.
Croatian Bureau of Statistics (CBS–Drzavni zavod za statistiku). 2013. Yerbook of Statistic. Zagreb: DZS.
———. 2014. Investments in 2012. Statistical Report 1531. Zagreb: DZS.
Croatian National Bank (CNB–Hrvatska narodna banka). Statistical Reviews, Reports and Information:
various years. Zagreb: CNB.
———. FDI data on request. http://www.hnb.hr/statistika/estatistika.htm (accessed June 21, 2015). Cuccia, Tiziana, and Ilde Rizzo. 2011. Tourism seasonality in cultural destinations: Empirical evidence from
Sicily. Tourism Management 32 (3): 589–595.
Cavlek, Nevenka, Mato Bartoluci, Darko Prebezec, Oliver Kesar, et al. 2011. Turizam: Ekonomske osnove i organizacijski sustav. Zagreb: Skolska knjiga.
Donohoe, Holly M. 2011. Defining culturally sensitive ecotourism: A Delphi consensus. Current Issues in Tourism 14 (1): 27–24. DOI: 10.1080/13683500903440689.
Financial Agency (FINA Financijska agencija). Registry of annual financial statements (Registar godisnjih financijskih izvjestaja – RGFI). http://www.fina.hr/Default.aspx?sec=973 (accessed June 21, 2015). Horwath Consulting. 2014. Istrazivanje poslovanja hotelijerstva u Hrvatskoj 2013. Zagreb: Horwath HTL Institute for Tourism. 2011. Thomas Summer Survey 2010. [Stavovi i potrosnja turista u Hrvatskoj]. Zagreb:
Institut za turizam. http://www.iztzg.hr/hr/institut/projekti/istrazivanja (2014) (accessed June 11, 2015). Istrian County. 2004. Tourism Master Plan of Istrian County for the period2004–2012 [Master plan razvoja
turizma Istre za razdoblje od 2004–2012 godine]. Pula: Istarska zupanija. http://www.istra-istria.hr/fileadmin/dokumenti/Istra_2015.pdf. (accessed June 27, 2015).
———. 2011. Istra 2015: Puna zaposlenost; Trajna konkurentnost. Labin: Istarska zupanija.
Istrian Development Agency (IDAcIstarska razvojna agencija). 2005. Regional Operational Programme of Istria County (ROP) for the period 2006–2010. Pula: Istarska razvojna agencija
Medina-Muñoz,Diego Ramón, and Rita Dolores Medina-Muñoz. 2013. Critical issues in health and wellness tourism: an exploratory study of visitors to wellness centres on Gran Canaria. Current Issues in Tourism
16 (5): 415–435. DOI: 10.1080/13683500.2012.748719.
———. 2012. Turizam u brojkama. http://www.mint.hr/UserDocsImages/htz-turizam-br012_HR.pdf. (accessed June 27, 2015).
———. 2013. Tourism Development Strategy of the Republic of Croatia by 2020 [Strategija razvoja turizma Republike Hrvatske do 2020. godine]. NN 55/13. Zagreb: Ministarstvo turizma.
Pirjevec, Boris. 1998. Ekonomska obiljezja turizma [Economic characteristics of tourism]. Zagreb: Goldenmarketing.
Sánchez Rivero, Marcelino, José Manuel Sánchez Martín, and Juan Ignacio Rengifo Gallego. 2014. Methodological approach for assessing the potential of a rural tourism destination: An application in the
province of Cáceres (Spain).Current Issues in Tourism 5: 1–19. DOI: 10.1080/13683500.2014.978745. STR Global. 2014a. European Hotel Revue 13 (EU12), Jan 2014. London
———. 2014b. Country Report: Croatia, STR London & Hendersonville.
———. 2014c. Data available from STR Share Centre (Hendersonville) and Dropbox link.
Vojnovic, Nikola. 2012. Obiljezja zivotnog ciklusa odabranih turistickih destinacija istarskog priobalja [Features of a Lifecycle of Selected Tourist Destinations Along Istrian Coast]. Ekonomska misao i praksa