1097
HETEROSIS IN THE SECOND AND THIRD GENERATION AFFECTS LITTER SIZE IN A
CROSSBREED MINK (NEOVISON VISON) POPULATION
JANNE THIRSTRUP1, CINO PERTOLDI2,3,4,PETER FOGED LARSEN5 and VIVI HUNNICKE NIELSEN1
1Department of Molecular Biology and Genetics, Faculty of Science and Technology, Aarhus University, Blichers Allé 20, DK-8830 Tjele, Denmark
2Department of Biological Science, Aarhus University, Ny Munkegade 114, DK-8000 Aarhus C, Denmark 3Department 18/Section of Environmental Engineering, Aalborg University,
Sahngaardsholmvej 49, DK-9000 Aalborg, Denmark 4Aalborg Zoo, Mølleparkvej 63, DK-9000 Aalborg, Denmark 5Copenhagen Research, Agro Food Park 15, DK-8200 Aarhus N, Denmark
Corresponding author: [email protected]
Abstract – Litter sizes in a cross between Brown and Black mink color types were observed through six generations. Litter size was signiicantly afected by yearly environmental variations. Ater adjusting for year efects, we found signiicant in-creases in litter size in the second and third generations (F2 and F3) ater crossing. hereater, in the following generations,
litter size dropped to a level comparable to the mean litter size of the midparent. Increased litter size in F2 compared to F1
indicated that maternal efects inluenced litter size more than non-maternal efects. he heterosis was mainly caused by an increase in litter size compared to the Black parental line. his indicates that the Black line was afected by inbreeding depression prior to crossing. We also found that two-year old F1 females had signiicantly more ofspring compared to
one-year old F1 females.
Key words:Inbreeding depression; maternal efect; non-maternal efects; environmental variation; color types.
INTRODUCTION
he positive efect of crossing breeds and lines has been well known for centuries as heterosis (Bruce, 1910; Crow, 1948; Shull, 1948; Chambers and What-ley, 1951; Donald et al., 1977; Crow, 1998), and the efect of heterosis has been explored and exploited in agriculture (Buchanan et al., 1990; Fairfull, 1990; VanRaden and Sanders, 2003) and in wildlife man-agement (Holleley et al., 2011; Pickup, 2012).
inbreeding. Inbreeding depression is a consequence of changes of genotype frequencies, which change toward a higher level of homozygosity in inbred populations compared to non-inbred populations and recessive detrimental alleles will have higher probability of expression in homozygotes. Reduc-tion of the mean phenotypic value of the populaReduc-tion is directly proportional to the inbreeding coeicient (Falconer and Macay, 1996) and Demontis et al., (2011) found a strong negative correlation between levels of relatedness between parents and litter size in mink.
Mink is a small carnivore of the Mustelidae fam-ily. It is domesticated and bred for the pelt which is used for clothing. Minks mature at one year of age and females are mated in the irst 2-3 years of life. hey have one litter per year and litter size is ap-proximately 5-6 ofspring per litter, however, in rare instances, it can be as high as 12 ofspring. Mink breeders on mink farms oten experience an increase in litter size ater crossing two lines (of the same color) or two color types. Litter size is important for mink production as the number of produced skins has an impact on the economy of the mink breed-ers. In Denmark, some exchanges of mink between farms exist, but the main reason for the exchange is improvement of body size and fur quality. Hansen et al. (2008) and Nielsen (2006; 2008) previously dem-onstrated heterosis for litter size in crosses between color types in mink.
he magnitude of heterosis depends on the difer-ences of the allele frequencies in the two populations that are crossed. he efect is greatest when the two populations are ixed for diferent alleles. he efect of heterosis can be observed in the irst two genera-tions (F1 and F2 generagenera-tions), but because of Mende-lian segregation the efect in the F2 is expected to be half the efect in the F1 (Falconer and Macay, 1996). Unraveling heterosis efect might be complicated by maternal efect (Norberg and Sørensen, 2007). In the irst generation ater crossing, the increase in the phenotypic value is due to heterosis in the ofspring (non-maternal efect), whereas in the second genera-tion, the increase in phenotypic value is due to
het-erosis in both mother and ofspring (maternal and non-maternal efect).
he aim of this analysis was to investigate the level of heterosis for litter size in a crossbreed of two mink color types. Based on the theoretical background, we expected to observe heterosis in F1 and F2. If the maternal efect is strong enough, we could expect to observe the greatest efect in F2 due to both maternal and non-maternal efects. In the following genera-tions, F3 and onward, we expected to observe stagna-tion in litter size. For the analysis, two mink color types were crossed and the population was kept at a limited population size for an additional ive genera-tions. he two color types were Black short nap mink and Brown mink; these two types were chosen be-cause of phenotypic diferences, with the Black type having very small litter sizes while the Brown type having larger litter sizes.
he F1 females were mated in two succeeding years. his allowed us to compare the number of ofspring that was born from one- and two-year-old females. On mink farms, it happens that two-year-old females give birth to more ofspring than one-year-olds. his is supported by Ślaska et al. (2009), who found that, at least for some color types, two-year-old females had more ofspring in litters than one-year-old females.
MATERIALS AND METHODS
Populations
and 7 males from the Black color type were selected. Brown female mink were mated to Black males and Black females were mated to Brown males. he se-lected mink for the parental generation were not re-lated: neither sibs and nor mother/ofspring were se-lected. In the following generations, it was attempted to minimize inbreeding, by avoiding mating between close relatives.
A limited number of mink from each generation (F1-F5) were mated the following years 2006-2010. F1 females were mated in two succeeding years: females mated in 2006 were mated to the same males in 2007. As there were no diferences in litter size between lines 74 and 75, the two Brown lines were merged into one line; there were also no diferences in litter size if Brown females were mated to Black males or if Black females were mated to Brown males. he F1 and following generations were hereater character-ized as line 71 (see a thorough explanation in Statisti-cal Analysis).
A Brown production line (line 19) was used as a control line. his line was also established and bred at the research farm in Foulum. he population size was large and there was a continuous supply of males from other lines of the Brown color type, which re-duced inbreeding in this line. Line 19 represented the overall productivity of the research farm in Fou-lum. Line 19 had not been involved in other research projects that could afect litter sizes in the years of this project. he number of mink in the two lines and in each generation is listed in Table 1.
Phenotypes
Litter size in the irst census (number of ofspring ob-served within the irst 48 h ater birth) for all females was registered through six generations (2005-2010) in line 71 and in line 19. Litter sizes in line 70 (Black short nap mink), lines 74 and 75 (Brown mink) was the litter size in which the mink was born. Barren females were not registered in these lines and there-fore the barren percent for these lines was estimated from the barren percent in 2004 for Black and Brown females on the research farm in Foulum.
Statistical analysis
To analyze whether there was a diference in mean litter size between the two Brown lines (line 74 and line 75) and between mean litter size when mating Brown females (line 74 or line 75) to Black males (line 70) or mating Black females (line 70) to Brown males (line 75), we used a t-test.
In the ANOVA analysis, we used a mixed model with mating year and mink line as ixed efects and male identity as random efect. Male identity did not have signiicant efect (F = 0.363, df = 1, p = 0.55) and the linear model was used for the analysis:
Ykij = μ+ li + pj + lipj + εikj (1)
where Ykij is litter size in the kth mink female in line i
(i = 19 or 71) in breeding year j (j = 2004…2010), μ is mean value, li is ixed efect of line i, pj is ixed efect
of breeding year j, lipj is interaction between breeding
year j and line i andεikjis random error. he efects of
the parameters in the model were estimated using the R package, doBy version 4.5-3 (Højsgaard and Hale-koh, 2012) and were used for estimating least square means of litter size for each year in lines 19 and 71.
Due to the signiicant efect of year (see results), an adjusted mean litter size was calculated for line 71. he efect of year, calculated from least square means in line 19 was used for adjustment in line 71:
ŷ71j =1/n71j Σk=1(y71jk + [y19,2004- y19j]) (2)
where ŷ71j is adjusted mean litter size in line 71 in year
j, n71j is number of mink in line 71 in year j, y71jk is
lit-ter size in the kth female in line 71 in year j, and y 19,2004
- y19jis the efect of year j on litter size using line 19
in 2004 as reference.
Percentage of change in litter size using midpar-ent litter size 2004 as reference was calculated as:
Change % = 100 • ((ŷ
71j-
ŷ
71,2004)
/
ŷ
71,2004)
(3)
year j and ŷ71,2004 is mean liter size for line 71 in year
2004.
To test if there were signiicant changes from the reference year (2004), t-tests were performed.
To test if two-year-old females had more ofspring compared to one-year-old females we used a t-test. F1
females were mated in two succeeding years. In 2006, the females were one year old and in 2007 the females were two years old. herefore, adjusted mean litter sizes from years 2006 and 2007 were used for the test. To test if there was a signiicant change in mean litter size in F3 compared to F2, we used a t-test. Due to the efect of mother’s age on litter size, we used one-year-old females in both generations, hence, the adjusted
Table 1. Least square means of litter size and standard errors (SE) of lines 71 and 19 as well as number of mink in the analyses in the years 2004-2010. Signiicant deviations of mean litter size from the mean litter size in year 2004 are shown.
Line 71 Line 19
Year Number Litter size (SE) Number Litter size (S.E.)
2004 71 5.90 (0.37) 484 7.23 (0.14)
2005 49 5.18 (0.45) 370 6.24 (0.16)***
2006 97 6.71 (0.32)* 287 6.91 (0.18)
2007 92 6.29 (0.33)** 63 5.60 (0.39)***
2008 18 7.56 (0.74)** 179 6.51 (0.23)**
2009 19 5.37 (0.72) 425 7.14 (0.15)
2010 21 4.52 (0.68) 743 6.14 (0.11)***
Levels of signiicance: * p < 0.05, p < **0.01, p < ***0.001
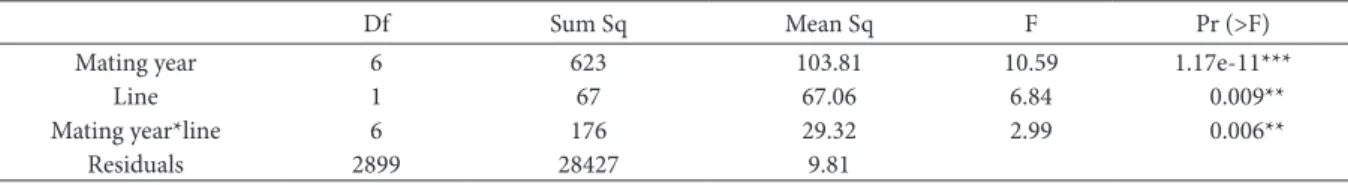
Table 2. hree-way ANOVA of the linear model (1). Litter size as response, mating year and line as well as interaction between mating year and line as ixed efects as explanatory variable. Degrees of freedom (df), sum of squares (Sum Sq), mean squares (Mean Sq), F-values and p-F-values are shown.
Df Sum Sq Mean Sq F Pr (>F)
Mating year 6 623 103.81 10.59 1.17e-11***
Line 1 67 67.06 6.84 0.009**
Mating year*line 6 176 29.32 2.99 0.006**
Residuals 2899 28427 9.81
Levels of signiicance: * p < 0.05, p < **0.01, p < ***0.001
Table 3. Adjusted litter size and standard errors (SE) in line 71, number of mink, percentage change in litter size with year 2004 as refer-ence, t-values and p-values are shown.
Year / generation Num. Adjusted litter size (S.E.) Change% t-value p-value
Browna 31b 6.75 (0.45)
Blacka 35b 5.0 (0.36)
2004 / midparent 61 5.90 (0.37) 0.00
2005 / F1 49 6.18 (0.50) 4.64 -0.50 0.62
2006 / F2 97 7.03 (0.29) 19.15 -2.64 0.009**
2007 / F2 92 7.92 (0.24) 34.24 -5.28 3.97E-07***
2008 / F3 18 8.28 (0.46) 40.34 -3.66 0.0004***
2009 / F4 19 5.44 (0.68) -7.80 0.67 0.54
2010 / F5 21 5.61 (0.65) -4.92 0.43 0.67
a: parental lines. b: Phantom females included.
mean litter size in years 2006 and 2008 were used for the test. he sotware package Past (Hammer et al., 2001) was used for all t-tests.
RESULTS
Barren percentages for Black and Brown females in 2004 were 10.9% and 6.7%, respectively. hree and two phantom females without ofspring were there-fore added to the parental populations. Mean lit-ter sizes (and standard errors) in Brown and Black were 6.75 (0.45) and 5.0 (0.36) ofspring respectively. Mean litter size of the two parental populations (mid-parent) was 5.9 (0.37) ofspring (see Table 1 for least square means of litter size for the two lines). here was no diference between litter size in line 74 and in line 75 (t = 0.46, p = 0.64). here was no diference in litter sizes regardless of whether Brown females were mated to Black males or Black females were mated to Brown males (t = 0.060, p = 0.55). Ofspring from the crossbreeding (F1) and following generations (F2-F5) were therefore regarded as the same line (line 71).
Litter size was signiicantly afected by breeding year, line and interaction between breeding year and line F13, 2904 = 6.98, p < 0.001 (see Table 2 for results of ANOVA). here were signiicantly fewer ofspring in the midparent of line 71 in 2004 (reference year) compared to line 19 in 2004 (t = 3.33, p <0.001) where the midparent of line 71 had 18.25% fewer ofspring compared to line 19 (the control line). For line 19, there were signiicant deviations from the reference year in years 2005, 2007, 2008 and 2010, where the litter sizes were signiicantly smaller compared to the reference year. In line 71, least square means of lit-ter size were signiicantly increased in the years 2006, 2007 and 2008 compared to the reference year. he least square means of litter size and standard errors (SE) of line 71 and line 19 are listed in Table 1. Sig-niicant deviations of mean litter size from the mean litter size in 2004 are shown.
he t-test of adjusted mean litter size in line 71 showed signiicant increase in the years 2006, 2007 and 2008 compared to midparent. hereater, the lit-ter size fell to a level comparable to litlit-ter size of the
midparent. he improvements in percentage were 19.15, 34.24 and 40.34%, respectively. (See Table 3 for adjusted mean litter size in line 71 and changes in percent using year 2004 as reference). Increase in litter size in 2008 was not signiicantly diferent from year 2006 (t = 1.18, p = 0.08). here were signiicant diferences in litter size between years 2006 and 2007 (t = 2.36, p = 0.02).
DISCUSSION
Litter size in a crossbreeding between two mink color types was analyzed for heterosis. We found an increase in litter size in F2 and F3 generations com-pared to the mean of the two parental color types, corresponding to midparent. In F4 and F5, the litter size was in the same order of magnitude as the litter size of the midparent.
We found signiicant efect of line. Line 71, which was our study population, had in general less ofspring per litter compared to the control line. he Brown control line (line 19) was a production line with a large population size. Furthermore, there was a continuous supply of males to the line from other lines of the same color type. We therefore assumed that this line did not sufer from an inbreeding de-pression that could afect litter size. Both the Black and the Brown color type used for our analysis had smaller litter size compared to this control line. In particular, the Black color type had very small litter size. Crossing the two color types resulted in a 23.6% increase in litter size in F1 compared to the Black color type. his corresponded to 1.18 ofspring. Compared to the Brown color type there was a decrease of 8.44% in the F1. Based on these results, it is likely that the Black color type sufered from inbreeding depression before crossing, while the Brown color type did not.
our studied populations. We did not ind signiicant increase in litter size in F1 compared to midparent. Heterosis in F1 is caused by non-maternal efect while the efect in F2 is caused by both maternal and non-maternal efects. If the maternal and non-ma-ternal efects were in the same order of magnitude, we would have seen efect in F1 and one and a half of the efect of F1 in F2. As we did not ind an a signii-cant increase in litter size in F1, this might indicate that the non-maternal efect was of less importance and we might therefore assume that, at least for this population, the maternal efect was the most impor-tant cause for the observed increase of the mean litter size. he importance of maternal vs. non-maternal efects for litter size is not univocal (e.g. Southwood and Kennedy, 1990; Roehe and Kennedy, 1993), but estimating the efects in mink might be of impor-tance for selection strategies. We expected litter size to stabilize at the level of F2 in F3 and in the following generations, but we found a tendency (p = 0.08) for increased litter size in F3 compared to F2. his ten-dency to increased litter size in F3 could be due to 1) environmental variation that was not grasped by the analysis and we therefore did not take it into account; 2) the very small population size in this generation and therefore large variation in the estimated value; 3) epistatic efect – inbred populations will, if mated at random, reach phenotypic and genotypic equilib-rium ater one generation. If however there is linkage disequilibrium between loci, an increase in pheno-typic value might occur. To our knowledge heterosis efects in F3 have not been observed in other organ-isms. Nielsen (2006; 2008) also found an increase in litter size in the third generation ater crossing Black and Brown mink color types.
Litter size in F4 and F5 fell to a level comparable to midparent. he population sizes in F3 and the fol-lowing generations were very small and the popula-tion was therefore likely to become inbred. Due to inbreeding or genetic drit, the population might have lost genetic variation and therefore genotypic frequencies might have changed toward higher lev-els of homozygosity, so the decrease in litter size was probably caused by small population size in F3 and succeeding generations. he estimated litter sizes
should be interpreted with some caution because of the small population sizes. Variations (SE) in the esti-mated litter sizes in these generations were very large compared to previous generations and accordingly there might be some uncertainty of the estimates.
he fact that we found signiicant diference in litter size between F1 females having ofspring as one-year-olds (in 2006) and as two-year-olds (2007), conirms what was previously found for other mink color types by Ślaska et al. (2009), and it is a result that is also oten experienced by mink breeders.
We have shown that a cross between color types can increase considerably the mean litter size. here-fore, a breeding strategy focusing on the advantag-es (due to maternal and non-maternal efects) that can be obtained in the generations following a cross should be considered, especially in those crosses where the other characteristics of the pelt are not ex-cessively altered. Clearly, given the relatively strong contribution of the maternal efects on mean litter size, a long-term breeding strategy should be con-sidered. his breeding strategy should be focused on creating females that harbor the highest possible lev-el of heterozygosity in their genomes. his can be ob-tained by crossing lines with the highest genetic dis-tance between them, which are not necessarily lines of diferent colors. If information about the genetic distances between lines is not available, then another option will be to cross lines that show reduced mean litter size. Such a strategy could provide increased economic advantages that outweigh the additional costs associated with the detailed registrations of the numbers of litters born and/or a genetic screening of the lines.
Acknowledgments - CP was supported by a grant from Dan-ish Natural Science Research Council (grant numbers: 11-103926, 09-065999, 95095995) and the Carlsberg Foundation (grant number 2011-01-0059).
REFERENCES
Bruce, A.B. (1910). he Mendelian theory of heredity and the augment of vigor. Science 32: 627-628.
Buchanan, D.S., Luce, W.G. and Clutter, A.C. (1990). Swine cross-breeding systems. OSU Ext. Coop. Ext. Serv. Okla. State. Univ. Stillwater. Okla. http:\\pods.dasnr.okstate.edu.
Chambers, C. and Whatley, J.A. (1951). Heterosis in crosses of inbred lines of Duroc Swine. J. An. Sci. 10: 505-515.
Charlesworth, D. and Willis, J.H. (2009). he genetics of inbreed-ing depression. Nature Reviews Genetics 10: 783-796.
Crow, J.F. (1948). Alternative hypotheses of hybrid vigor. Genet-ics 33: 477-487.
Crow, J.F. (1998). 90 years ago: the beginning of hybrid maize. Genetics 148: 923-928.
Demontis, D., Larsen, P.F., Bækgaard, H., Sønderrup, M., Hansen, B.K., Nielsen, V.H., Loeschcke, V., Zalewski, A., Zalewska, H. and Pertoldi, C. (2011). Inbreeding afects fecundity of American mink (Neovison vison) in Danish farm mink. Animal Genetics 42: 437-439.
Donald, H.P., Gibson, D. and Russel, W.S. (1977). Estimation of heterosis in crossbreed dairy cattle. Animal Production 25: 193-208.
Fairfull, R.W. (1990). Heterosis. In: Poultry Breeding and Genet-ics. Ed. by Crawford R.D. Elsevier Science Publishers. Pp. 913-934.
Falconer, D.S. and Mackay, T.F.C. (1996). Inbreeding and cross-breeding. In: Introduction to Quantitative genetics. Fourth edition. Pearson Prentice Hall. Pp. 247 - 262.
Farkas, J., Curik, I., Csató, L., Csörnyei, Z., Baumung, R. and Nagy, I. (2007). Bayesian inference of inbreeding efects on litter size and gestation length in Hungarian Landrace and Hungarian Large White pigs. Lifestock science 112: 109-114.
Hammer, Ø., Harper, D.A.T. and Ryan, P.D. (2001). Past: Pale-ontological Statistics Sotware Package for Education and Data Analysis. Palaeontologia Electronica, vol. 4, issue 1, art. 4:9 pp., 178kb. http://palaeo-electronica.org/2001_1/ past/issue1_01.htm.
Hansen, B.K., Berg, P. and Larsen, P.F. (2008). Heterosis in mink. Proceedings the IX International Scientiic Congress in Fur Animal Production Scientifur 4:. 11-14.
Holleley, C.E., Nichols, R.A., Whitehead, M.R., Gunn, M., Gupta, J. and Sherwin, W.B. (2011). Induced dispersal in wildlife
management: experimental evaluation of the risk of hy-brid breakdown and the beneit of hyhy-brid vigor in the F1 generation. Conservation Genetics 12: 31-40.
Holt, M., Meuwissen, T. and Vangen, O. (2005). he efect of fast created inbreeding on litter size and body weights in mice. Genetics Selection Evolution 37: 523-537.
Højsgaard, S. and Halekoh, U. (2012). R package version 4.5-3, doBy – Groupwise summary statistics, general linear con-trasts, population means (least-squares-means), and other utilities. http://CRAN.R-project.org/package=doBy
Keller, L.F. and Waller, D.M. (2002). Inbreeding efects in wild populations. Trends in Ecology and Evolution 17: 230-241.
Nielsen, V.H. (2006). Krydsning af Wild og standard sort mink. Faglig Årsberetning, Pelsdyrerhvervets Forsøgs- og Forskn-ingscenter, 47-52.
Nielsen, V.H. (2008). Krydsning af Wild og standard sort mink. Intern rapport. DJF Husdyrbrug 10:. 11-17.
Norberg, E. and Sørensen, A.C. (2007). Inbreeding trend and in-breeding depression in the Danish population of Texel, Shropshire and Oxford Down. J. An. Sci. 85: 299-304.
Pickup, M., Field, D.L., Rowell, D.M. and Young, A.G. (2012). Source population characteristics afect heterosis follow-ing genetic rescue of fragmented plant populations. Pro-ceedings of the Royal Society B. 280: 20122058.
Roehe, R. and Kennedy, B.W. (1993). he inluence of maternal efects on accuracy of evaluation of litter size in swine. J. An. Sci. 71: 2353-2364.
Shull, G.H. (1948). What is heterosis? Genetics 33: 439-446.
Ślaska, B., Rozempolska-Rucińska, I. and Jeźewska-Witkowska, G. (2009). Variation in some reproductive traits of mink (Neovison vison) according to their coat color. Annals of Animal Science 9: 287-297.
Southwood, O.I. and Kennedy, B.W. (1990). Estimation of direct and maternal genetic variance for litter size in Canadian Yorkshire and Landrace swine using an animal model.J. An. Sci. 68: 1841-1847.
Springer, N.M. and Stupar, R.M. (2007). Allelic variation and heterosis in maize: how do two halves make more than a whole? Genome Res. 17: 264-275.