Access to Medicines by Seguro Popular
Beneficiaries: Pending Tasks towards
Universal Health Coverage
Edson Servan-Mori1, Ileana Heredia-Pi1, Julio Montañez-Hernandez1, Leticia Avila-Burgos1, Veronika J. Wirtz1,2*
1Center for Health Systems Research, National Institute of Public Health, Cuernavaca, Morelos, Mexico, 2Department for Global Health, Boston University School of Public Health, Boston, United States of America
Abstract
Objective
In the context of aiming to achieve universal health coverage in Mexico, this study com-pares access to prescribed medicines (ATPM) between Seguro Popular (SP) and non-SP affiliated outpatient health service users.
Materials and Methods
ATPM by 6,123 users of outpatient services was analyzed using the National Health and Nutrition Survey 2012. Adjusted bi-probit models were performed incorporating instrumental variables.
Results
17.3% of SP and 10.1% of the non-SP population lacked ATPM. Two-thirds of all outpatient SP and 18.5% of all outpatient non-SP received health services at Ministry of Health facili-ties, among whom, 64.6 and 53.6% of the SP and non-SP population respectively reported ATPM at these facilities. Lack of medicines in health units, chronic health problems (com-pared to acute conditions) and prescription3 medicines were risk factors for non-ATPM.
Adjusted models suggest that when using Ministry of Health services, the SP population has a higher probability of ATMP compared to the non-SP population.
Conclusion
Given the aspirations of achieving universal health coverage in Mexico, it is important to increase ATPM in Ministry of Health facilities thereby ensuring basic rights to health care are met.
OPEN ACCESS
Citation:Servan-Mori E, Heredia-Pi I, Montañez-Hernandez J, Avila-Burgos L, Wirtz VJ (2015) Access to Medicines by Seguro Popular Beneficiaries: Pending Tasks towards Universal Health Coverage. PLoS ONE 10(9): e0136823. doi:10.1371/journal. pone.0136823
Editor:Abdisalan Mohamed Noor, Kenya Medical Research Institute - Wellcome Trust Research Programme, KENYA
Received:August 14, 2014
Accepted:August 10, 2015
Published:September 25, 2015
Copyright:© 2015 Servan-Mori et al. This is an open access article distributed under the terms of the Creative Commons Attribution License, which permits unrestricted use, distribution, and reproduction in any medium, provided the original author and source are credited.
Data Availability Statement:a) Our data do not contain identifying or sensitive subject information. b) There are no ethical restrictions on requesting access to the data from INSP. c) All data files are available from the web pagehttp://ensanut.insp.mx/but user name and password need to be requested via an email from the INSP. d) The authors do not own or manage the data; ownership is with INSP which provides data access upon request.
Introduction
Medicines are an essential element of a functioning health systems. Appropriate use of medi-cines contributes to the prevention, treatment and eradication of various diseases [1,2]. Access barriers to medicines limits the therapeutic capabilities of health personnel and jeopardizes patient health via reduced health service utilization as well as imposing financial burdens on users, which are often catastrophic [3].
Within resource constrained settings, low availability of medicines in health care units is particularly related to shortcomings in facility management, including through the purchasing, distribution or storage processes, as well as lack of training for personnel and insufficient investment in medicines in general [3]. Consequently, ensuring equitable and affordable access to medicines is an ongoing challenge for health systems.
In Mexico, the Seguro Popular (SP) has been implemented as a means to ensure timely and equitable access to medicines for poor populations [4–7]. SP is the main component of the Social Protection System in Health, which additionally includes the Protection Fund Against Catastrophic Medical Expenses and the Health Insurance Siglo XXI (previously known as, Insurance for a New Generation,). The SP was introduced in 2003 with the aim of ensuring the provision of health services and providing financial protection through a voluntary insurance to the populations that, due to their employment status (unemployed and self-employed), are excluded from social security [4–6].
The financial model input of the SP consists of federal government and state aid, with contri-butions from members according to their economic capacity [4]. Since its inception, the number of SP members has grown exponentially from approximately 2 million in 2003 to nearly 53 mil-lion by the end of 2012 [8,9]. In addition, funds allocated to SP have experienced a significant growth to 1,300%, from USD 382.6 million in 2004 to USD 5,087.6 million in 2012 (with an annual average/affiliated of USD 100) [10], of which up to 30% annually is intended for the pur-chase of medicines [7,9]. Currently, SP ensures access to a package of interventions called Univer-sal Health Services Catalog (CAUSES), including 284 interventions and 522 medicines [10–13].
Despite SP’s growing financial protection, supply of medicines in Mexico’s public health units remains a barrier to accessing care [14,15]. Recent studies suggest that in 2008 the SP population had an 86.7% probability of incurring expenditure on medicines (among those who spent on health), with an average amount equivalent to 6.2% of disposable household income accounting for nearly 80% of household expenditure on health (6% higher than the national average) [16]. Results of external evaluations of SP 2006 show that demand for medicines has increased: 83.3% and 89.1% (in 2005 and 2006 respectively) of SP members who were treated as outpatients in Ministry of Health (MoH) units were prescribed medicines [17]. In 2002 the estimated figure for the same population was 55% [18].
Much of the published literature reports on the earlier years of SP implementation. Now that the government has declared success over meeting its goal of universal coverage, a study of SP affiliates access to prescribed medicines (ATPM) through primary care is warranted. This study aims to compare ATPM for SP and non-SP affiliated users of primary care services, tak-ing into account the type of provider, socio-demographic profile health needs of users of these services, as well as the main barriers to ATPM for both insurance groups.
Materials and Methods
2.1 Data, study population and key definitions
We performed a cross-sectional study with data collected by the National Survey of Health and Nutrition (ENSaNut) 2012. This survey used a stratified multistage sampling, probabilistic
design and representation at national, state and stratified urban/rural levels in each of the 32 states of Mexico [19]. In particular, we analyzed the data from the primary care service user module and the associated households. The ENSaNut includes information from 194,758 indi-viduals. The primary care service user module represents a random sample of 12,973 people who claimed having received primary care services during the two weeks prior to the survey and who received care from medical personnel. We obtained the data in an anonymized form for analysis from the public repository of the National Health and Nutrition Survey (ENSa-Nut). The local Committees of Research, Biosafety and Ethics at the National Institute of Public Health (INSP) in Mexico approved the survey. All subjects provide informed consent prior to taking part.
Access to prescribed medicines or ATPM was defined as receiving all medicines prescribed from primary care services, regardless of whether or not individuals had to pay. In principle, medicines could be obtained at the MoH facilities (the same place as the medical consultation) free of charge, or outside MoH facilities (e.g. private community pharmacies) where individuals have to pay for medicines. For both cases a dichotomous variable equal to one was used if the event occurred and zero was used if the event did not occur.
An individual who reported insurance affiliation to Seguro Popular at the time of the survey was classified as SP and those without any health insurance scheme were classified as non-SP (marked as 0).
The test sample included 6,123 individuals (around 4 million nationwide), with a sample loss of 13.6%. It is relevant to note that the analysis of key socio-demographic characteristics among both those included and those excluded from the study population suggests no statisti-cal differences exist between the groups.
2.2 Analytic Strategy
The main socio-demographic characteristics of the study population according to SP member-ship are described. Through statistical independence tests (χ2 for categorical variables and t-student for continuous) [20,21] the main differences between the two groups of affiliation were described. Using the same tests, the ATPM and the main reasons for its non-occurrence were identified (lack of medicines in the care unit, remoteness, lack of time for the person who used health services were not included as part of the consultation received, lack of money, prices, or other). The influence of SP on ATPM was estimated in principle from the following specifica-tion:
ATPM¼aþdSPþgXþε ð1Þ
Where X is a vector of control variables of such effect andεthe error term [21]. This model assumes that there are no "unobservable" omitted variables which influence both the decision to join SP and the probability of using health services. This assumption is feasible when the def-inition of ATPM is independent of the place where the prescribed medicines were obtained. Enrolling in SP is non-random and voluntary which means that the estimation of the SP’s influence on (δ) ATPM at the place of care (in the MoH), could be confounded by factors related to any differences associated with problems of self-selection [corr(X,ε)6¼0]. This could
result in biased and inconsistent estimates of the influence of the SP [22–24]. Thefirst step esti-mations used to resolve this issue followed as:
SP¼cZþt ð2Þ
Where Z is a vector of instrumental variables, in such a way that such assumptionscorr(Z,SP)
The Z vector included the natural logarithm of the number of SP members at municipal-level between the years 2003–2010. This information is derived from administrative records of the National Commission for Social Protection in Health [26]. Previous studies have shown the validity of this instrumental variable [27,28]; it is highly correlated with the probability of being member of SP and not associated with the probability of receiving health care. However, unlike the aforementioned studies, our approach not only captures the penetration of the pro-gram at the municipal level and heterogeneity cross, it also incorporates the dynamics of expansion, anticipating that municipalities with greater penetration and higher expansion rates will include individuals with a higher probability of SP affiliation.
Additionally, X included the following control variables: reported health needs (acute, chronic or other) [29], the number of medicines prescribed (1, 2,3), age, and sex. Other con-trol variables at household level were sex, age, the head of houses’education and employment status, indigenous status [30], social program beneficiary of Oportunidades (formerly Pros-pera), and total annual household expenditure per adult equivalent (in terciles) [31]. (3) The place of residence (city or town) was characterized by population size (rural:<2500
inhabi-tants, urban: 2500–100 thousand, metropolitan:>100 thousand) and degree of marginalization
(very low/low, medium, high/very high) [32].
In order to estimate the association between SP and ATPM two approaches were proposed. First, considering the endogeneity problem mentioned, we adjust an IV model using 2-stage least squares (2SLS) [22]. I would suggest rephrasing as: Because both SP and ATPM are binary variables whose error terms might not be independent, a bivariate probit model or bi-probit was used to analyze the probability of ATPM. [22,33,34]. Second, and following other studies [34], we contrasted our IV estimations using a naïve model that assumes exogeneity, and there-fore directly adjusted (1). Both approaches include crude and adjusted estimations in order to control for any possible distortion of the association between SP and ATPM that would arise from differences in socio-demographic, health, and contextual characteristics included in the X vector. Marginal effects were also reported (in percentage points or pp) [22,35,36]. All analyses were performed using Stata 13.1 [37].
Results
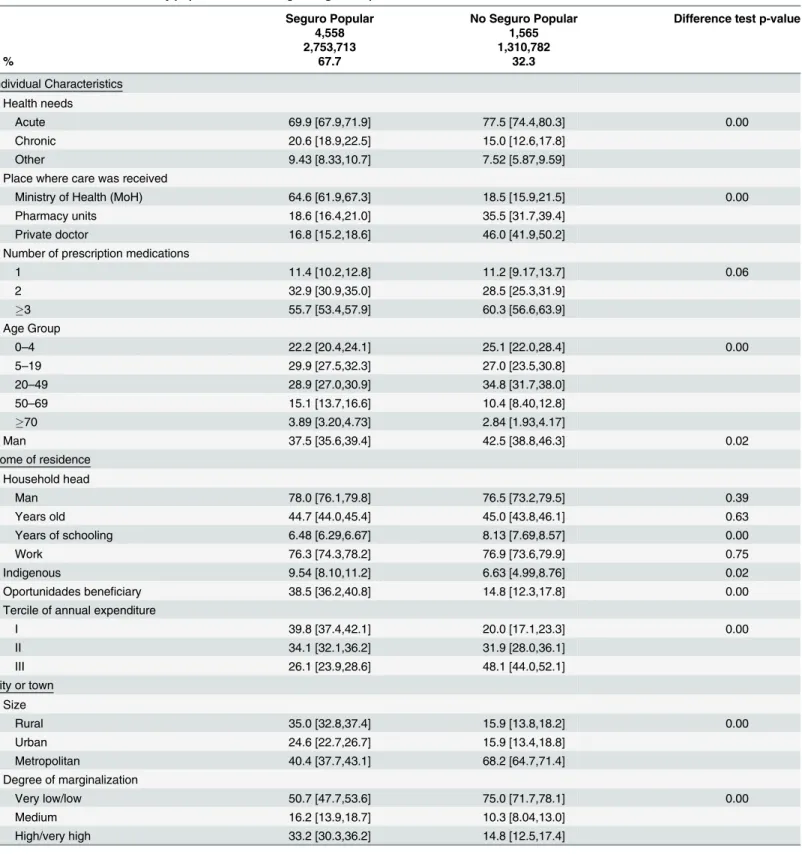
Table 1shows the general characteristics of the study population (N = 4,064,495) according to SP membership. Some relevant differences include: (1) 20.6% of SP members (N = 2,753,713) and 15% of the non-SP population (N = 1,310,782) reported a chronic condition, while 69.9% and 77.5% of the respective groups reported having some acute condition; (2) 64.6% of SP members and 18.5% of non-members received health care in primary care MoH facilities, while 35.4% and 81.5% of the respective groups received care in a private clinic or pharmacy; (3) 55.7% of SP members and 60.3% of non-members were prescribed three or more medica-tions; (4) the SP population lived in households whose head of house had an average of 1.7 years less schooling compared to non-SP affiliates. (5) Among the SP population, 9.5% belonged to indigenous households (3% more than the non-SP), 38.5% lived in households Oportunidades recipients (23.7% more than the non-SP) and 73.9% of households fall into ter-ciles I and II for annual expenditure per equivalent adult (22% higher than non-SP). (6) With regard to the place of residence, 35% of the SP population lived in rural areas and 33.2% resided in environments of high/very high marginalization. For the non-SP population, these percent-ages were 16% and 15%, respectively.
Table 1. Differences in the study population according to Seguro Popular Affiliation.
Seguro Popular No Seguro Popular Difference test p-value
n 4,558 1,565
N 2,753,713 1,310,782
% 67.7 32.3
Individual Characteristics Health needs
Acute 69.9 [67.9,71.9] 77.5 [74.4,80.3] 0.00
Chronic 20.6 [18.9,22.5] 15.0 [12.6,17.8]
Other 9.43 [8.33,10.7] 7.52 [5.87,9.59]
Place where care was received
Ministry of Health (MoH) 64.6 [61.9,67.3] 18.5 [15.9,21.5] 0.00
Pharmacy units 18.6 [16.4,21.0] 35.5 [31.7,39.4]
Private doctor 16.8 [15.2,18.6] 46.0 [41.9,50.2]
Number of prescription medications
1 11.4 [10.2,12.8] 11.2 [9.17,13.7] 0.06
2 32.9 [30.9,35.0] 28.5 [25.3,31.9]
3 55.7 [53.4,57.9] 60.3 [56.6,63.9]
Age Group
0–4 22.2 [20.4,24.1] 25.1 [22.0,28.4] 0.00
5–19 29.9 [27.5,32.3] 27.0 [23.5,30.8]
20–49 28.9 [27.0,30.9] 34.8 [31.7,38.0]
50–69 15.1 [13.7,16.6] 10.4 [8.40,12.8]
70 3.89 [3.20,4.73] 2.84 [1.93,4.17]
Man 37.5 [35.6,39.4] 42.5 [38.8,46.3] 0.02
Home of residence Household head
Man 78.0 [76.1,79.8] 76.5 [73.2,79.5] 0.39
Years old 44.7 [44.0,45.4] 45.0 [43.8,46.1] 0.63
Years of schooling 6.48 [6.29,6.67] 8.13 [7.69,8.57] 0.00
Work 76.3 [74.3,78.2] 76.9 [73.6,79.9] 0.75
Indigenous 9.54 [8.10,11.2] 6.63 [4.99,8.76] 0.02
Oportunidades beneficiary 38.5 [36.2,40.8] 14.8 [12.3,17.8] 0.00
Tercile of annual expenditure
I 39.8 [37.4,42.1] 20.0 [17.1,23.3] 0.00
II 34.1 [32.1,36.2] 31.9 [28.0,36.1]
III 26.1 [23.9,28.6] 48.1 [44.0,52.1]
City or town Size
Rural 35.0 [32.8,37.4] 15.9 [13.8,18.2] 0.00
Urban 24.6 [22.7,26.7] 15.9 [13.4,18.8]
Metropolitan 40.4 [37.7,43.1] 68.2 [64.7,71.4]
Degree of marginalization
Very low/low 50.7 [47.7,53.6] 75.0 [71.7,78.1] 0.00
Medium 16.2 [13.9,18.7] 10.3 [8.04,13.0]
High/very high 33.2 [30.3,36.2] 14.8 [12.5,17.4]
Note: Estimates considering the survey design.
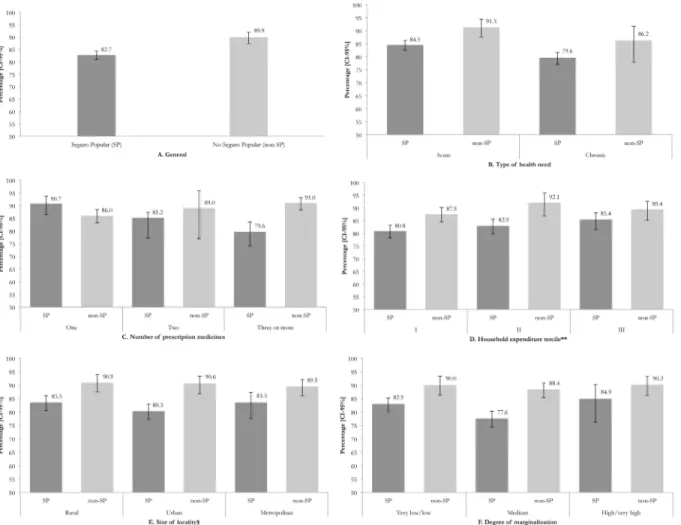
and household characteristics as well as type of care received. The probability of ATPM decreased when there was an increase in the number of medicines, when there was lower household spending, and in the presence of chronic diseases. In terms of size of locality and degree of marginalization, no trend was detected.
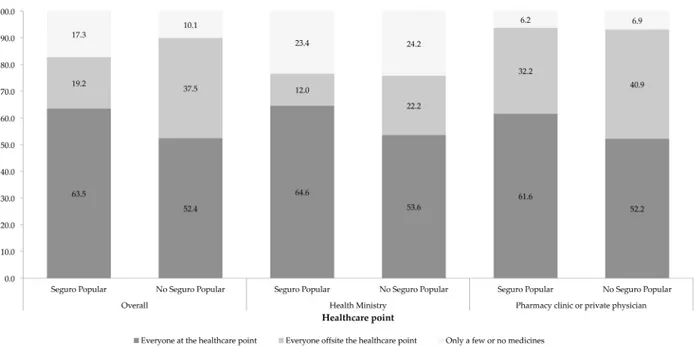
The descriptive analysis shows that, when stratified by type of institutions where health care was received, SP beneficiaries using the MoH reported greater ATPM than the non-SP mem-bers (64.6% v. 53.6%) (Fig 2). Interestingly, among beneficiaries of SP, the percentage of users who received either a portion or none of their prescription medicines was higher among those who used the MoH compared to those who used the private sector (23.4% v. 6.2%).
In nine out of ten cases, unavailability of medicines was reported as the reason for SP affili-ated individuals experiencing no ATPM when receiving care at MoH institutions (Table 2). In contrast, when SP members reported no ATPM when receiving care in private institutions or pharmacy clinics, the primary reason was that the medicines seemed expensive or they lacked money to pay for the medicines (31%).
Finally,Table 3shows the influence of SP on the probability of ATPM. When only analyz-ing the group of individuals that obtained prescription medicines at the same place where they received health care, SP increases the probability of ATPM 10.3 percentage points compared to Fig 1. Access to prescribed medicines (ATPM) regardless of place according to individual characteristics and specific environment and affiliation to the Seguro Popular.Note: Estimates considering the survey design.*Estimated figures on the total population who received a prescription from medical personnel.**Calculation per adult equivalent. $ Rural:<2500 inhabitants, Urban: 2500–100000, Metropolitan:>100000.
Fig 2. Access to prescribed medicines by type of care provider.Note: Estimates considering the survey design.*Indicator calculated on the total population who receive a prescription from medical personnel.
doi:10.1371/journal.pone.0136823.g002
Table 2. Overall reasons for not obtaining medicines, according to the place where the health care was received and to affiliation to the Seguro Popular.
Seguro Popular No Seguro Popular Difference test p-value
n 4,558 1,565
N 2,753,713 1,310,782
% 67.7 32.3
PANEL A: General
Lack of medicine 85.9 [82.4,88.8] 58.6 [44.7,71.2] 0.00
Did not know where to go, lack of time or cannot leave work 0.24 [0.06,0.95] 6.09 [1.56,20.9] They seemed expensive or lack of money 5.79 [4.12,8.07] 21.3 [12.2,34.4] Health care does not include medicines 4.18 [2.53,6.82] 7.45 [3.56,14.9]
Other reason 3.90 [2.52,5.97] 6.63 [2.90,14.5]
PANEL B: Users of health services of the Ministry of Health
Lack of medicine 91.4 [88.2,93.8] 83.3 [67.8,92.2] 0.02
Did not know where to go, lack of time or cannot leave work 0.13 [0.12,0.15] 2.43 [0.66,8.49] They seemed expensive or lack of money 2.16 [1.26,3.66] 5.08 [2.85,8.90] Health care does not include medicines 2.18 [0.90,5.16] 0.38 [0.05,2.71]
Other reason 4.12 [2.60,6.47] 8.80 [2.24,28.9]
PANEL C: Users of pharmacy units or private clinics
Lack of medicine 48.0 [37.0,59.1] 38.9 [24.2,55.9] 0.18
Did not know where to go, lack of time or cannot leave work 0.94 [0.13,6.61] 8.99 [1.74,35.5] They seemed expensive or lack of money 30.8 [21.6,41.9] 34.2 [18.2,54.7] Health care does not include medicines 17.9 [10.8,28.3] 13.1 [6.25,25.3]
Other reason 2.36 [1.96,2.84] 4.91 [2.22,10.5]
Note: Estimates considering the effect of the survey design.
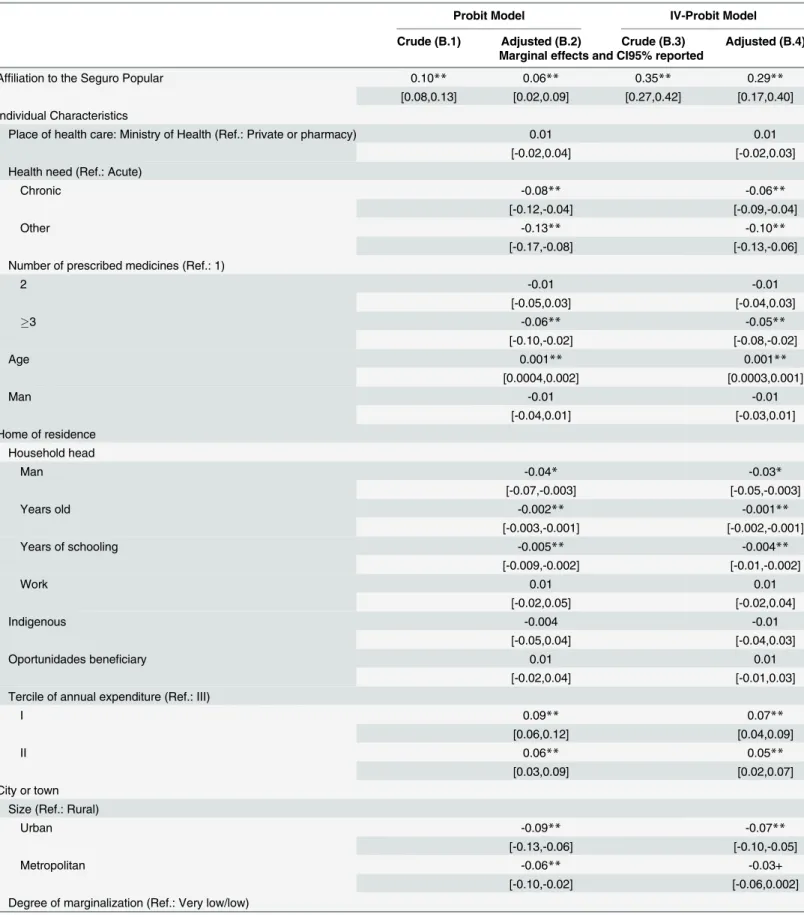
Table 3. Comparison of access to prescribed medicines (ATPM) between those affiliated to Seguro Popular and those not affiliated.
Probit Model IV-Probit Model
Crude (B.1) Adjusted (B.2) Crude (B.3) Adjusted (B.4) Marginal effects and CI95% reported
Affiliation to the Seguro Popular 0.10** 0.06** 0.35** 0.29**
[0.08,0.13] [0.02,0.09] [0.27,0.42] [0.17,0.40] Individual Characteristics
Place of health care: Ministry of Health (Ref.: Private or pharmacy) 0.01 0.01
[-0.02,0.04] [-0.02,0.03]
Health need (Ref.: Acute)
Chronic -0.08** -0.06**
[-0.12,-0.04] [-0.09,-0.04]
Other -0.13** -0.10**
[-0.17,-0.08] [-0.13,-0.06]
Number of prescribed medicines (Ref.: 1)
2 -0.01 -0.01
[-0.05,0.03] [-0.04,0.03]
3 -0.06** -0.05**
[-0.10,-0.02] [-0.08,-0.02]
Age 0.001** 0.001**
[0.0004,0.002] [0.0003,0.001]
Man -0.01 -0.01
[-0.04,0.01] [-0.03,0.01]
Home of residence Household head
Man -0.04* -0.03*
[-0.07,-0.003] [-0.05,-0.003]
Years old -0.002** -0.001**
[-0.003,-0.001] [-0.002,-0.001]
Years of schooling -0.005** -0.004**
[-0.009,-0.002] [-0.01,-0.002]
Work 0.01 0.01
[-0.02,0.05] [-0.02,0.04]
Indigenous -0.004 -0.01
[-0.05,0.04] [-0.04,0.03]
Oportunidades beneficiary 0.01 0.01
[-0.02,0.04] [-0.01,0.03]
Tercile of annual expenditure (Ref.: III)
I 0.09** 0.07**
[0.06,0.12] [0.04,0.09]
II 0.06** 0.05**
[0.03,0.09] [0.02,0.07]
City or town Size (Ref.: Rural)
Urban -0.09** -0.07**
[-0.13,-0.06] [-0.10,-0.05]
Metropolitan -0.06** -0.03+
[-0.10,-0.02] [-0.06,0.002]
Degree of marginalization (Ref.: Very low/low)
non-SP members (Model B.2). This association is reduced to 5.5 percentage points after adjust-ing for control variables. As in the previous model, the probability of ATPM is reduced among those who reported a chronic health need (v. acute condition), when the number of prescrip-tion medicines was3 (v. having only one medicine prescribed), between users categorized in tercile III of annual spending (v. terciles I and III), as well as for residents of urban or metropol-itan areas, and those living in low/very low marginalization areas.
Discussion
Access to prescribed medicines or ATPM is one of the most sensitive indicators of the perfor-mance of the Mexican health system. This study contributes to the empirical analysis of a major health programs that the Mexican government has implemented in the last decade; the Seguro Popular or SP [7]. The main contribution of this study arises from the result comparing ATPM prescribed in ambulatory care between members of SP and those not affiliated with SP. Barriers to ATPM for the SP affiliated population result in overall lower access to medicines compared to that in the non-SP member population, one-fifth (17%) of SP beneficiaries did not obtain some or all of their prescribed medicines. This percentage is higher than was esti-mated in the non-SP population (10% of non-SP users failed to receive all of their prescription medicines).
This analysis also revealed that regardless of whether ambulatory health care is provided, being affiliated with SP has no influence on ATPM. Some explanatory factors include that one-third of SP affiliates seek primary care outside MoH facilities, which would result in out-of-pocket expenses to obtain medicines. In this case ATPM depends on one’s ability to pay rather than their affiliation (74% of the SP are terciles I and II v. 52% of the non-SP group).
Table 3. (Continued)
Probit Model IV-Probit Model
Crude (B.1) Adjusted (B.2) Crude (B.3) Adjusted (B.4) Marginal effects and CI95% reported
Medium -0.008 -0.01
[-0.05,0.03] [-0.04,0.02]
High/very high 0.04* 0.03*
[0.01,0.08] [0.003,0.06]
Observations 6,123 6,123 6,123 6,123
Log likelihood -3,999 -3,887 -7,347 -7,245
LRχ2 52.76 276.7 —— ——
Prob>χ2 0.000 0.000 —— ——
Waldχ2 —— —— 430.5 653.1
Prob>χ2 —— —— 0.000 0.000
AIC 8,002 7,816 14,719 14,551
rho (ρ) —— —— -0.556 -0.477
Likelihood-ratio test of rho (ρ) = 0
χ2 —— —— 30.70 12.48
Prob>χ2 —— —— 0.000 0.000
Note: **P<0.01
*p<0.05
+p<0.1
This study suggests that care in MoH facilities is a key factor in analyzing the influence of SP on ATPM. This is not surprising considering that medicines are only provided free to SP beneficiaries at the MoH point of care. In crude terms, the percentage of ATPM for SP is 64.6% compared to the non-SP group at 53.6%. Although the analytic model shows a high probability (28.5 percentage points) for SP affiliates receiving ATPM in MoH facilities compared to non-SP individuals, it is concerning that ten years after the non-SP’s implementation 35.4% of non-SP affili-ates still have to obtain medicines outside of MoH facilities.
Given the policy goals and implementation of a program like SP, ATPM is not yet at the level expected. SP guarantees ATPM for those medicines included in the formulary free of charge at the point of care. CAUSES, the SP insurance formulary, states that 285 interventions are included in the coverage, which represents 100% coverage for primary care visits and up to 90% coverage of secondary care consultations (SSA, 2014). International recommendations suggest 80% or greater availability to essential generic medicines in both public and private institutions [38].
Finally, the findings of this study demonstrate that users seeking care for chronic health problems as opposed to an acute and users prescribed3 medications have a lower probability of obtaining their prescribed medicines. ATPM for chronic health needs is lower than for acute problems; this finding is supported by previous research [39]. Users with chronic conditions have a higher probability of comorbidities than those without resulting in higher out-of-pocket expenditure and the need for financial protection. The ENSANUT 2012 reveals that 47% of patients diagnosed with diabetes mellitus also have a diagnosis of high blood pressure [40].
Some limitations should be noted. First, the type of information source used (a population survey) has a transversal character, meaning it is subject to self-report biases as well as limita-tions in the ability to establish causal inference. Secondly, the study was unable to estimate the influence of SP solely among users of MoH. This limitation arises due to the small number of MoH service users that are not affiliated with SP. For every four users affiliated with SP, there is one non-SP user. Finally, we limited our study to access prescribed medicines rather than medicines in general, as the need for receiving pharmacotherapy is established by a health care provider. Despite these limitations, we believe that the following constituents promote assur-ance of the results:
1. The benefits of the sampling design of the survey used (probabilistic, nationally representa-tive, state and urban/rural strata, and oversampling of households in greatest need of the country).
2. The use of instrumental variables to adequately correct the endogeneity problem for both discrete and unobservable variables (compared to other methods such as matching by pro-pensity score), as well as the use in the analysis of control variables widely suggested in the international literature as determinants of service use. In order to test the validity of our results we used propensity score matching. The results produced are very similar to the ones reported in our manuscript (data not shown).
the demand for MoH services, thus ensuring ATPM based on the health needs of disadvan-taged populations in Mexico.
Acknowledgments
Ethical approval
We obtained the data in an anonymized form for analysis from the public repository of the National Health and Nutrition Survey (ENSaNut). The local Committees of Research, Bio-safety and Ethics at the National Institute of Public Health (INSP) in Mexico approved the sur-vey. All subjects provide informed consent prior to taking part.
Author Contributions
Conceived and designed the experiments: ESM VW. Performed the experiments: ESM VW. Analyzed the data: ESM VW JMH. Contributed reagents/materials/analysis tools: ESM VW IHP LAB. Wrote the paper: ESM VW IHP LAB.
References
1. Organización Mundial de la Salud (OMS). Medicamentos esenciales. Disponible en:http://www.who. int/topics/essential_medicines/es/. (Last accessed: 5 May 2013).
2. Organización Mundial de la Salud (OMS). Medicamentos esenciales. 10 datos sobre los medicamen-tos esenciales. Disponible en:http://www.who.int/features/factfiles/essential_medicines/es/index.html. (Last accessed: 5 May 2013).
3. Garrido-Latorre F, Hernández-Llamas H, Gómez-Dantés O. 2008. Surtimiento de recetas a los afiliados al Seguro Popular de Salud de México.Salud Pública Mex50 supl 4:S429–S436.
4. Secretaría de Salud (SeSa). 2006. Utilización de servicios y trato recibido por los afiliados al Seguro Popular de Salud. In: Secretaría de Salud. Sistema de Protección Social en Salud. Evaluación de pro-cesos. Mexico City: Secretaría de Salud, 2006: 39–57.
5. Gómez Dantés O, Ortiz M. 2004. Seguro popular de salud: Siete perspectivas. Salud Pública De México, 46(6), 585–588.
6. King G, Gakidou E, Imai K, Lakin J, Moore R, Nall C, et al. 2009. Public policy for the poor? A random-ized assessment of the mexican universal health insurance programme. The Lancet, 373(9673), 1447–1454. doi:10.1016/S0140-6736(09)60239-7
7. Knaul FM., González-Pier E, Gómez-Dantés O, García-Junco D, Arreola-Ornelas H, Barraza-Lloréns M, et al. 2012. The quest for universal health coverage: Achieving social protection for all in Mexico. The Lancet, 380(9849), 1259–1279. doi:10.1016/S0140-6736(12)61068-X
8. Comisión Nacional de Protección Social en Salud. 2013. Cifras del Seguro Popular: Afiliación histórica. Disponible en:http://www.seguro-popular.salud.gob.mx/index.php?option = com_content&view = article&id=552&Itemid=481. (Last accessed: 13 July 2013).
9. Comisión Nacional de Protección Social en Salud. 2012. Libro Blanco. Sistema de Protección Social en Salud.“Seguro Popular”. Disponible en:http://www.seguro-popular.salud.gob.mx/images/
contenidos/Transparencia/rend_ctas_libros_bcos/seguropopular.pdf. (Acceded 2013 June 19). 10. Sistema de Protección Social en Salud. Informe de resultados 2012. Disponible en:http://gaceta.
diputados.gob.mx/Gaceta/62/2013/feb/InfSPSS-20130201.pdf. (Acceded 2013 June 19).
11. Sistema de Protección Social en Salud. 2012. Informe de resultados del SPSS Enero-Diciembre 2012. Secretaría de Salud. Disponible enhttp://www.seguro-popular.salud.gob.mx/index.php?option = com_ content&view = article&id=277&Itemid=293. (Acceded 2013 June 17).
12. Sistema de Protección Social en Salud. Informe de resultados 2011. Disponible en:http://www. slpsalud.gob.mx/archivos/Seguro-Popular/PEF/2011/Informe_Resultados_2011.pdf. Consultado: 19 de junio de 2013.
14. Wirtz VJ, Russo G, Kageyama ML. 2010. Acceso a medicamentos para los usuarios del primer nivel de los servicios de salud: análisis de las encuestas nacionales de salud 1994, 2000, 2006. Salud Pública Mex; 52:32–40.
15. López Moreno S, Granados Cosme JA, coordinadores. El abasto de medicamentos en México. México, DF: Universidad Autónoma Metropolitana, Unidad Xochimilco, 2010.
16. Wirtz VJ, Santa-Ana-Téllez Y, Servan-Mori E, Avila-Burgos Leticia. 2012. Heterogeneous Effects of Health Insurance on Out-of-Pocket Expenditure on Medicines in Mexico. Value Health 15: 593–603. doi:10.1016/j.jval.2012.01.006PMID:22867767
17. Secretaría de Salud de México (SeSa). 2006. Sistema de Protección Social en Salud: Evaluación de Procesos. Primera edición. México 2007. Available inhttp://salud_2013.salud.gob.mx/codigos/ columnas/evaluacion_programas/cnpss1.html.
18. Secretaría de Salud (SeSa)-Dirección General de Evaluación del Desempeño (DGED). 2006. Síntesis
Ejecutiva 15. Surtimiento de recetas en los Servicios Estatales de Salud y en los Servicios de Salud del DF. Available inhttp://www.salud.gob.mx/unidades/evaluacion/publicaciones/publicaciones.htm
19. Romero-Martínez M, Shamah-Levy T, Franco-Núñez A, Villalpando S, Cuevas-Nasu L, Gutiérrez JP,
et al. 2013. Encuesta Nacional de Salud y Nutrición 2012: diseño y cobertura. Salud Pública Mex; 55
supl 2:S332–S340.
20. Greenwood P.E., Nikulin M.S. 1996. A guide to chi-squared testing. Wiley, New York. ISBN 0-471-55779-X.
21. McDonald J.H., Handbook of Biological Statistics Sparky House Publishing, Baltimore, 2008. 22. Wooldridge JM. 2002. Econometric analysis of cross section and panel data. MIT Press, Cambridge,
2002.
23. Angrist J, Krueger A. 2001. Instrumental Variables and the Search for Identification: From Supply and Demand to Natural Experiments. Journal of Economic Perspectives 15(4):69–85.
24. Angrist J, Imbens GW, Rubin D. 1996. Identification of Causal Effects Using Instrumental Variables. Journal of the American Statistical Association 91 (434): 444–455.
25. Heckman JJ. 1997. Instrumental variables: a study of implicit behavioral assumptions used in making program evaluations. J. Hum. Resour 32: 441–462.
26. Comisión Nacional de Protección Social en Salud. 2010. Datos administrativos de la afiliación al Seguro Popular a nivel de las localidades y fecha de incorporación de las municipalidades. México, DF: Secretaría de Salud, 2010.
27. Galárraga O, Sosa-Rubí S, Salinas-Rodríguez A, Sesma-Vázquez S. 2010. Health insurance for the poor: impact on catastrophic and out-of-pocket health expenditures in Mexico. Eur J Health Econ 11 (5): 437–447. doi:10.1007/s10198-009-0180-3PMID:19756796
28. Sosa-Rubí SG, Galárraga O, Harris JE. 2009. Heterogeneous impact of the“Seguro popular”program on the utilization of obstetrical services in Mexico, 2001–2006: A multinomial probit model with a dis-crete endogenous variable. Journal of Health Economics 28(1): 20–34. doi:10.1016/j.jhealeco.2008.
08.002PMID:18824268
29. Wirtz VJ, Serván-Mori E, Heredia-Pi I, Dreser A, Ávila-Burgos L. 2013. Utilización y gasto en medica-mentos en México: avances y retos en el acceso equitativo a medicamedica-mentos. Salud Pública Mex 55 supl 2:S112–S122.
30. Comisión Nacional para el Desarrollo de los Pueblos Indígenas (CDI). 2009. Los hogares y la pobla-ción indígena. Available in:http://www.cdi.gob.mx/index.php?id=211&option = com_content&task = view, 2009. (Last accessed: 1 October 2012).
31. Teruel GL, Rubalcava L. 2005. Escalas de Equivalencia para México, D.F. Serie: Documentos de Investigación. SEDESOL. Documentos de investigación 23, SEDESOL, 2005.
32. Consejo Nacional de Población (CONAPO). 2010. Índice de marginación por localidad. Available in
http://www.conapo.gob.mx/es/CONAPO/Indice_de_Marginacion_por_Localidad_2010. (Acceded 2012 November 11].
33. Verbeek M.J.C.M. (2012). A Guide to Modern Econometrics, 4th edition. Chichester: John Wiley and Sons.
34. Galárraga O, Sosa-Rubí S, Salinas-Rodríguez A, Sesma-Vázquez S. 2010. Health insurance for the poor: impact on catastrophic and out-of-pocket health expenditures in Mexico. Eur J Health Econ 11 (5): 437–447. doi:10.1007/s10198-009-0180-3PMID:19756796
35. Cameron AC and Trivedi PK. 2009. Microeconometrics Using Stata. College Station, TX: Stata Press, 2009.
37. Stata Corp. LP. Stata/SE 12.1 for Windows XP 64 bits. College Station Texas, USA: Stata Corp LP, 2011.
38. World Health Organization (WHO). 2012. A draft comprehensive global monitoring framework, includ-ing indicators, and a set of voluntary global targets for the prevention and control of non-communicable diseases. A/NCD/INF./1 31 October 2012. Ginebra, OMS, 2012.
39. Cameron A, Roubos I, Ewen M, Mantel-Teeuwisse AK, Leufkens HG, Laing RO. 2011. Differences in the availability of medicines for chronic and acute conditions in the public and private sectors of devel-oping countries. Bull World Health Organ 1; 89(6):412–21. doi:10.2471/BLT.10.084327PMID:
21673857