www.ann-geophys.net/31/277/2013/ doi:10.5194/angeo-31-277-2013
© Author(s) 2013. CC Attribution 3.0 License.
Annales
Geophysicae
Geoscientiic
Geoscientiic
Geoscientiic
Geoscientiic
Spatiotemporal variability analysis of diffuse radiation in China
during 1981–2010
X. L. Ren1,2, H. L. He1, L. Zhang1, L. Zhou1,2, G. R. Yu1, and J. W. Fan1
1Institute of Geographic Sciences and Natural Resources Research, Chinese Academy of Sciences, Beijing 100101, China 2University of Chinese Academy of Sciences, Beijing 100049, China
Correspondence to:H. L. He ([email protected])
Received: 8 August 2012 – Revised: 7 January 2013 – Accepted: 17 January 2013 – Published: 19 February 2013
Abstract. Solar radiation is the primary driver of terres-trial plant photosynthesis and the diffuse component can enhance canopy light use efficiency (LUE), which in turn influences the carbon balance of terrestrial ecosystems. In this study we calculated the spatial data of diffuse radiation in China from 1981 to 2010, using a radiation decomposi-tion model and spatial interpoladecomposi-tion method based on ob-servational data. Furthermore, we explored the spatiotempo-ral characteristics of diffuse radiation using GIS and trend analysis techniques. The results show the following: (1) The spatial patterns of perennial average of annual diffuse radi-ation during 1981–2010 are complex and inhomogeneous in China, generally lower in the north and higher in the south and west. The perennial average ranges from 1730.20 to 3064.41 MJ m−2yr−1 across the whole country. (2) There
is an increasing trend of annual diffuse radiation in China from 1981 to 2010 on the whole, with mean increasing am-plitude of 7.03 MJ m−2yr−1 per decade. Whereas a signif-icant downtrend was observed in the first 10 years, distinct anomalies in 1982, 1983, 1991 and 1992 occurred due to the eruptions of El Chinchon and Pinatubo. (3) The spatial distri-bution of the temporal variability of diffuse radiation showed significant regional heterogeneity in addition to the seasonal differences. Northwestern China has the most evident down-trend, with highest decreasing rate of 6 % per decade, while the Tibetan Plateau has the most evident uptrend, with high-est increasing rate of up to 9 % per decade. Such quantitative spatiotemporal characteristics of diffuse radiation are essen-tial in regional scale modeling of terrestrial carbon dynamics.
Keywords. Atmospheric composition and structure (Trans-mission and scattering of radiation) – Meteorology and at-mospheric dynamics (Radiative processes)
1 Introduction
Solar radiation reaching the Earth’s surface is the primary energy source for life on our planet (Wild et al., 2005). Ter-restrial plant photosynthesis tends to increase with global ra-diation (Mercado et al., 2009), which can be divided into two components, the direct and the diffuse (Lauret et al., 2010). The diffuse radiation represents the shortwave energy of so-lar origin scattered downwards by gas molecules, aerosols, water vapor and clouds in the atmosphere (Bhattacharya et al., 1996). Due to its effective penetration to lower depths of the canopy (Urban et al., 2007), diffuse radiation can reduce the photosynthetic saturation of the canopy as a whole and in-crease the canopy light use efficiency (LUE) compared to di-rect radiation (Kanniah et al., 2012; Farquhar and Roderick, 2003), which enhances the terrestrial carbon sink (Gu et al., 2002, 2003; Alton et al., 2007; Urban et al., 2007; Mercado et al., 2009; Zhang et al., 2010, 2011). This is known as the diffuse radiation fertilization effect (Roderick et al., 2001). It is also likely to have implications for carbon sequestration of vegetation by affecting evapotranspiration (ET), which is a key component of the climate system linking the hydro-logic, energy and carbon cycles (Oliveira et al., 2011; Kan-niah et al., 2012). The explicit treatment of diffuse radiation in ecological models is needed to accurately simulate the car-bon dynamics of terrestrial ecosystems, given the influence of diffuse radiation on LUE and ET (Gu et al., 2003; Mer-cado et al., 2009; Kanniah et al., 2012). So understanding the spatial and temporal variations of diffuse radiation is criti-cal to estimate the impact on the carbon balance of terrestrial ecosystems.
thus often estimated from global radiation. Many radiation decomposition models have been developed to estimate the daily diffuse fraction, defined as the ratio of diffuse radia-tion to global radiaradia-tion, using various predictors, such as the clearness index, sunshine percentage and cloud cover (Liu and Jordan, 1960; Page, 1961; Iqbal, 1979, 1980; Erbs et al., 1982; Skartveit and Olseth, 1987; Reindl et al., 1990; Boland et al., 2001, 2008). The clearness index is defined as the ratio of the daily terrestrial global radiation on a horizontal sur-face to the daily extraterrestrial radiation on that sursur-face (Liu and Jordan, 1960). It is a general indicator of the absorbing and scattering during the transmission of radiation in atmo-sphere, more objective than cloud cover because it does not depend on visual perceptions (Che et al., 2005). Liu and Jor-dan (1960) first found the correlation between daily diffuse fraction and the clearness index, and then many piecewise polynomials with different forms were established to predict diffuse radiation using the clearness index. For example, Erbs et al. (1982) proposed forth power polynomials and Reindl et al. (1990) developed a linear function. Boland et al. (2001) established a logistic model to substitute piecewise linear or nonlinear functions. Lauret et al. (2010) validated the Boland model with measurement data that include Northern as well as Southern Hemisphere sites, and compared it with several previous models. The results showed that the Boland model had better or similar performance than the other models but with a simpler expression.
Trends of solar radiation have received prominent atten-tion in the world (Stanhill and Cohen, 2001; Wild et al., 2005; Wild, 2009), but far less studies have investigated the vari-ations of diffuse radiation. As for China, Lin et al. (1996) showed the distribution patterns of annual and seasonal dif-fuse radiation in Yunnan province. Zhang et al. (2004) found an increasing trend of diffuse radiation in three stations of eastern China for the period of 1961 to 1990. Che et al. (2005) analyzed the variability of diffuse radiation based on observational data at 64 stations, and found no signifi-cant trend in annually-averaged diffuse radiation from 1961 to 1990, but a significant declining trend after 1980. Liang and Xia (2005) studied the long-term trends of 42 first class pyranometer stations, concluding that the spatial patterns of observed trends in diffuse radiation are complex and inho-mogeneous from 1961–2000. Shi et al. (2008) tested a set of quality assessments on the observational data, and found no obvious trend in diffuse radiation either. Guo et al. (2009) found that the trends of diffuse radiation are decreasing in the west and increasing in the east, based on observational data from 12 sites. Ma et al. (2011) concluded that the majority of 14 sites in China have downtrends in 1990s. However, all of these studies focused on the site scale (Lin et al., 1996; Che et al., 2005; Zhang et al., 2004; Liang and Xia, 2005; Shi et al., 2008; Ma et al., 2011; Guo et al., 2009), making the results subject to the selection of research sites. It is urgent to ini-tiate the regional scale research of the spatial and temporal
variability of diffuse radiation in China, thereby promoting the regional scale modeling of ecosystem processes.
The purpose of this study is to explore the spatiotempo-ral characteristics of diffuse radiation from 1981 to 2010 at the regional scale in China. Firstly, we calculate daily dif-fuse radiation based on measurement data of meteorologi-cal stations, and produce the spatial data of monthly diffuse radiation through spatial interpolation technique. Secondly, spatial patterns and temporal trends of diffuse radiation are analyzed using the spatial analysis method and trend anal-ysis techniques. In the end, the potential factors that affect diffuse radiation are discussed, such as clouds and aerosols, and then we calculate and analyze the spatial data of global radiation, diffuse fraction and the clearness index to explore the possible causes of spatiotemporal variations of diffuse ra-diation in China.
2 Data and methods
2.1 Data and quality control
The dataset used in this study includes daily sunshine dura-tion, daily global radiadura-tion, daily diffuse radiadura-tion, and DEM (Digital Elevation Model) data. The sunshine duration and radiation data were recorded all across China from 1981 to 2010, provided by the China Meteorology Administration (CMA). Daily sunshine duration is observed at 756 meteoro-logical stations and daily global radiation is measured at 122 radiation stations (Fig. 1). Due to the adjustment of radiation stations in 1993, the number of radiation stations observing diffuse radiation dropped from more than 70 to 17 after 1993. There are 81 stations that have more than 1-year record of diffuse radiation during the period of 1981 to 2010 (Fig. 1). The spatial resolution of The DEM data is 500 m×500 m, provided by Institute of Geographic Sciences and Natural Resources Research, Chinese Academy of Sciences.
The CMA has performed some basic quality checks on the observational data (Shi et al., 2008), and we further checked the data for each station based on the following criteria: (1) daily sunshine duration cannot exceed the possible sun-shine duration; (2) daily global radiation (Q)must be smaller than extraterrestrial radiation (Q′), which is calculated ac-cording to the latitude of each station and day of year; and (3) daily diffuse radiation (Qd)cannot be bigger than global radiation, and have to satisfy two additional conditions for overcast skies and clear skies (Reindl et al., 1990) in Eq. (1).
QdQ≥0.9 , for QQ′<0.2
QdQ≤0.8 , for QQ′>0.6 (1)
2.2 Calculation of diffuse radiation
Because there are only 122 stations measuring global radia-tion in China, we calculate it from sunshine duraradia-tion based on the empirical relationship between them. Consequently, the expansion of diffuse radiation data consists of the fol-lowing two steps.
The first step is the calculation of global radiation. Chen et al. (2004) calibrated several global radiation estimation models based on sunshine or air temperature, and found that the daily global radiation was estimated more accu-rately using sunshine-based models. The simple Angstrom model (Angstrom, 1924) (Eq. 2) is one of them, and pro-vided good results in China (Chen et al., 2004). So we picked the Angstrom model to calculate daily global radiation. The parameters of Angstrom model were estimated using daily global radiation and sunshine duration data at 122 radiation stations, and then we utilized sunshine duration data of 756 meteorological stations to calculate the global radiation of all these stations.
Q
Q′ =a+b·
n
N (2)
In Eq. (2),nandN represent actual sunshine duration and possible sunshine duration, respectively; anda,bare under-mined coefficients. The daily possible sunshine duration is calculated according to the latitude of each station and day of year.
The second step is the calculation of diffuse radiation. Lauret et al. (2010) validated the Boland model (Boland et al., 2008, 2001) (Eq. 3) with data from several sites of Eu-rope, Africa, Australia and Asia, including the site of Macau, China, and found that the model had good performance and simpler form. So we used the Boland model to calculate daily diffuse radiation in this study. We estimated the param-eters of the Boland model using data of radiation stations, which measure both diffuse radiation and global radiation, after which daily diffuse radiation of 756 stations were de-rived.
Qd
Q =
1
exp(c+d·QQ′) (3)
In Eq. (3),canddare undetermined parameters.
It should be noted that China has extraordinary spatial heterogeneous topography and climate, so we estimate the parameters of the Angstrom model and the Boland model of northwest China, Inner Mongolia, northeast China, north China, central China, south China, southwest China, and Qinghai-Tibet Plateau separately, according to the conven-tionally accepted eight geographical regions of Chinese Physical Geography Division (Fig. 1).
2.3 Spatialization of diffuse radiation
We use ANUSPLIN software (Hutchinson, 2001) to in-terpolate monthly diffuse radiation data in China with
Fig. 1. Distribution of meteorological and radiation stations in China (I: northwest China; II: Inner Mongolia; III: northeast China; IV: north China; V: central China; VI: south China; VII: southwest China; VIII: Qinghai-Tibet Plateau).
10 km×10 km spatial resolution from 1981 to 2010. ANUS-PLIN is a widely used spatial interpolation package, devel-oped by the Center for Resource and Environmental Stud-ies at the Australian National University (Hutchinson, 1998a, b, 1995; Hijmans et al., 2005). It implemented thin plate smoothing splines, allowing the incorporation of covariates in addition to the independent spline variables, and can esti-mate the prediction standard errors (Hutchinson, 2001). The specific steps of the interpolation in this study are as follows. Firstly, daily diffuse radiation was scaled to monthly data, and the DEM data is resampled from 500 m×500 m to 10 km×10 km using ArcGIS software. Secondly, we used three-dimensional spline to interpolate monthly diffuse radi-ation, with latitude and longitude as the independent vari-ables and elevation as the covariate. The mean prediction standard errors all across China are around 4 %. Thirdly, we calculated the annual spatial diffuse radiation using map al-gebra in the ArcGIS platform based on the monthly spatial diffuse radiation data, which was just derived.
2.4 Trend analysis method of diffuse radiation
Mann–Kendall trend analysis technique (Wei, 1999; Wang and Liang, 2006) was used to analyze the temporal varia-tions of spatial diffuse radiation from 1981 to 2010. It is a non-parametric statistical test method, not easily affected by the distribution and outliers in the data compared to the tra-ditional parametric statistical test methods (Wang and Liang, 2006). So it has been widely used in time series analysis, es-pecially in the analysis of environmental and climatic data (Wei, 1999). The details of the method are as follows:
sign(θ )=
1 (θ >0)
0 (θ=0) −1 (θ <0)
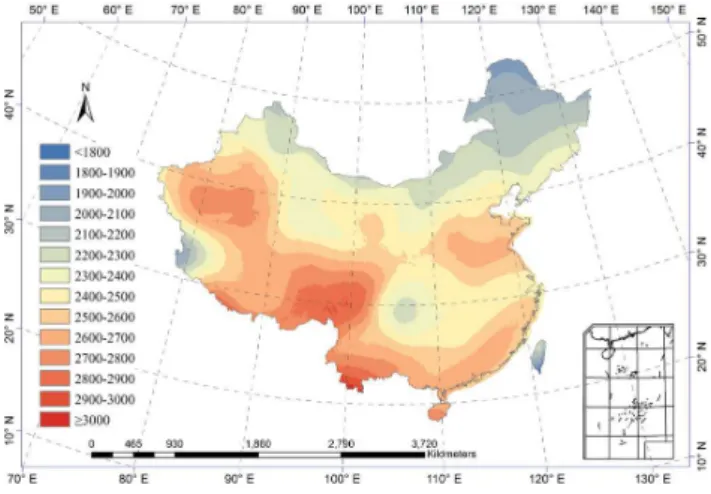
Fig. 2.Spatial distribution of perennial average of annual diffuse radiation in China during 1981–2010 (Unit: MJ m−2yr−1).
S=
n−1
X
i=1
n
X
j=i+1
sign(xj−xi) (5)
Z=
S−1
√
V ar(S) (S >0)
0 (S=0)
S+1
√
V ar(S) (S <0)
(6)
In Eq. (5),S denotes the test statistic andx is a data value in the time series with length ofn;S is approximately nor-mally distributed, and its expectation and variance are given in Eqs. (4) and (5). In Eq. (6),Zis the standardized test statis-tic calculated fromS. There will be statistically significant trends in the data if|Z| ≤Z1−α/2, whereZ1−α/2denotes the
value in the normal distribution table with confidence level ofα.
E(S)=0 (7)
Var(S)=n(n−1)(2n+5)
18 (8)
The estimation of the slope of the trend (β)is described by Eq. (9), in whichxj andxi denote data values in time series
ofxwith lengthn, andiis an integer from 1 ton−1 andjis fromi+1 ton. Positive values ofβrefer to increasing trends, while the time series is decreasing whenβis negative.
β=median x
j−xi
j−i
(9)
3 Results
3.1 Model parameterization and validation
We estimated the parameters of the Angstrom model and the Boland model, and validated the performance of the models
in different regions of China. In order to expand the models to more sites and years, we checked the site and time inde-pendence of the models using leave-one-out method for cross validation. Specifically, taking time expansion, for example, the data of 29 years were used for training and the last one year data was used for evaluation. This process was repeated 30 times, leaving out one different year’s data for each eval-uation interation. From this, we can derive the average per-formance of time expansion.
Tables 1 and 2 show the results, including estimated val-ues of the parameters, correlation coefficient (R) and root mean square error (RMSE) of the models. On the whole, both models perform well in all regions of China. Almost all the correlate coefficients exceed 0.9 and 0.8, and RMSEs are less than 3 MJ day−1and 2 MJ day−1for the Angstrom model and
the Boland model, respectively. However, the model perfor-mance is relatively poor in the Qinghai-Tibet Plateau, which might be caused by the large differences in climatic condi-tions among the sparse stacondi-tions there.
The estimated values of parameters for the two models (Tables 1 and 2) are compared with previous studies (Boland et al., 2008; Zhu et al., 2010; Sun et al., 1992). For the Angstrom model, the estimated parameters in different re-gions are very close to those reported by Zhu et al. (2010), and the mean values of eight regions (0.19, 0.54) are almost the same as the averages of China as a whole (0.19, 0.55) given by Sun et al. (1992). The differences of the specific val-ues may be caused by the different time periods of the data used. The fitted values of parameters of the Boland model differ widely from those (−5.00, 8.60) estimated by Boland et al. (2008), because the research data are from sites in dif-ferent areas.
3.2 Spatial patterns of diffuse radiation
(a) (b)
(c) (d)
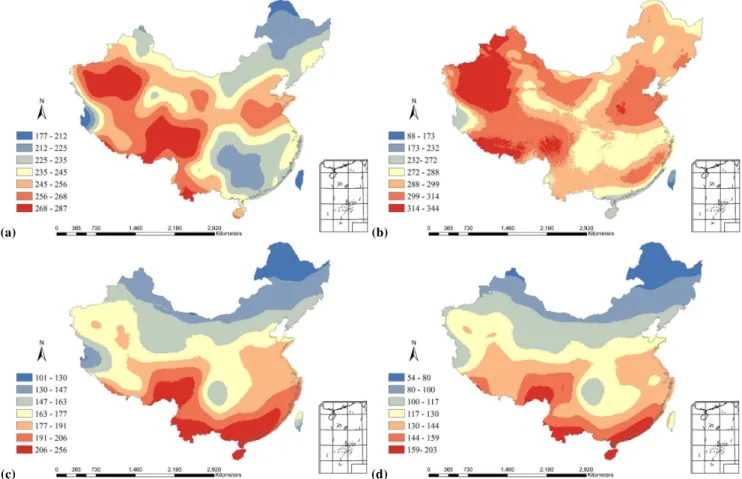
Fig. 3.Spatial distribution of perennial average of seasonal diffuse radiation in China during 1981–2010 (a,b,candddenote spring, summer, autumn and winter, respectively. Unit: MJ m−2month−1).
Table 1.Results of the calibration and validation of Angstrom model in different regions across China.
Estimated values and validation Northwest Inner Northeast North Central South Southwest Qinghai-Tibet
of parameters China Mongolia China China China China China Plateau
a(intercept) 0.22 0.18 0.20 0.17 0.15 0.17 0.19 0.20
b(slope) 0.52 0.57 0.52 0.53 0.55 0.53 0.55 0.55
Rof site expansion 0.96 0.95 0.94 0.94 0.93 0.91 0.88 0.87
RMSE of site expansion (MJ m−2day−1) 2.11 2.38 2.60 2.45 2.88 2.96 3.08 3.58
Rof time expansion 0.96 0.95 0.94 0.94 0.93 0.90 0.88 0.81
RMSE of time expansion (MJ m−2day−1) 2.17 2.41 2.52 2.49 2.74 2.97 2.95 4.08
western part of northwest China has much higher diffuse ra-diation than the eastern part, and there are some small areas of low diffuse radiation in the north (around Tsaidam Basin) and west of the Qinghai-Tibet Plateau.
The spatial distribution of seasonal diffuse radiation is presented in Fig. 3, where spring, summer, au-tumn and winter are represented by April, July, Octo-ber and January, respectively. Summer has the maximum amount of diffuse radiation, with pixel-averaged value of 297.60 MJ m−2month−1; and winter has the minimum, with average value about 120.13 MJ m−2month−1. Spring and au-tumn are in between summer and winter, with average value
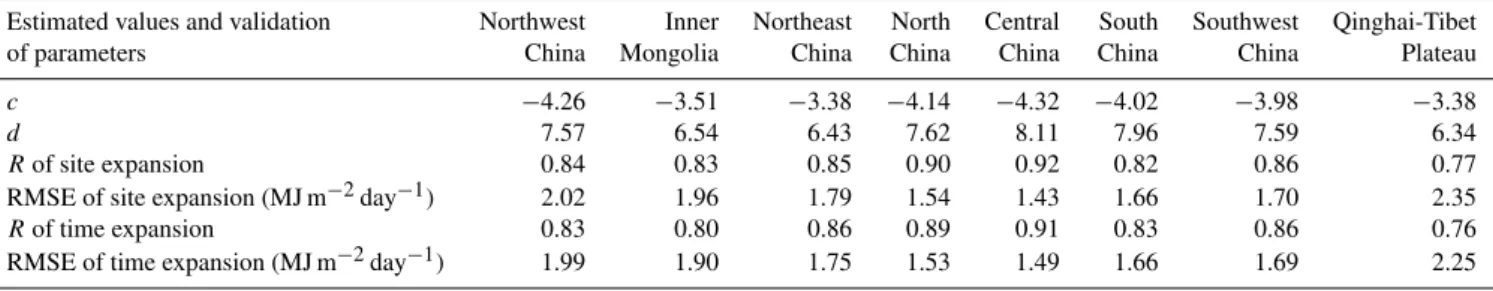
Table 2.Results of the calibration and validation of Boland model in different regions across China.
Estimated values and validation Northwest Inner Northeast North Central South Southwest Qinghai-Tibet
of parameters China Mongolia China China China China China Plateau
c −4.26 −3.51 −3.38 −4.14 −4.32 −4.02 −3.98 −3.38
d 7.57 6.54 6.43 7.62 8.11 7.96 7.59 6.34
Rof site expansion 0.84 0.83 0.85 0.90 0.92 0.82 0.86 0.77
RMSE of site expansion (MJ m−2day−1) 2.02 1.96 1.79 1.54 1.43 1.66 1.70 2.35
Rof time expansion 0.83 0.80 0.86 0.89 0.91 0.83 0.86 0.76
RMSE of time expansion (MJ m−2day−1) 1.99 1.90 1.75 1.53 1.49 1.66 1.69 2.25
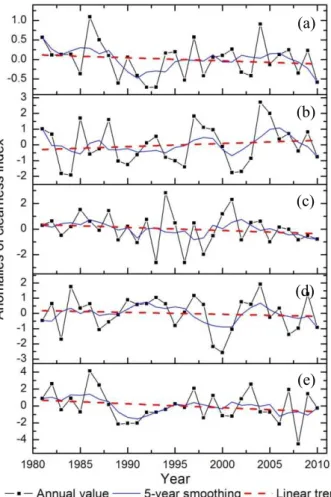
(e)
(d)
(c)
(b)
(a)
Fig. 4.Anomalies of annual and seasonal diffuse radiation averaged all across China from 1981 to 2010 (adenotes annual diffuse radi-ation; unit: MJ m−2yr−1. Panelsb,c,dandedenote seasonal dif-fuse radiation of spring, summer, autumn and winter, respectively; unit: MJ m−2month−1). The averages are 2476.98, 245.14, 297.6, 169.39 and 120.13, respectively.
3.3 Interannual variation trend of diffuse radiation av-eraged over China
The quantities of annual and seasonal diffuse radiation were averaged over all grids in China through map algebra in Ar-cGIS, aiming to acquire the interannual variability of mean
Table 3.Linear regression coefficients of annual and seasonal dif-fuse radiation from 1981 to 2010.
Annual Spring Summer Autumn Winter
Slope 0.703 −0.030 0.148 0.147 0.024 Intercept 2466.075 245.611 295.301 167.112 119.753 R 0.405* 0.096 0.547* 0.473* 0.113
* significant atα=0.05
diffuse radiation of China. Then we analyzed the time series of annual and seasonal diffuse radiation from 1981 to 2010 using linear regression analysis method (Fig. 4 and Table 3). Annual diffuse radiation increases significantly from 1981 to 2010 on the whole, with a mean increasing amplitude of 7.03 MJ m−2yr−1per decade. But it has a distinct downtrend
from 1981 to 1990 and unusually high departures in 1982 and 1983, which is consistent with the result reported by Shi et al. (2008). Then it increases dramatically in 1991 and 1992, and peaks in 1992. After that it decreases fast to a relatively high value, compared to the low value through in 1990, until 1995. Afterwards, the diffuse radiation keeps increasing with fluctuations (Fig. 4a).
The diffuse radiation of all seasons have increasing trends except spring (Fig. 4b–e), and only the trends of summer and autumn are statistically significant (Table 3). The sum-mer has the most evident ascending trend of diffuse ra-diation (Fig. 4c), with amplitude of 1.48 MJ m−2month−1
per decade, and autumn’s increasing trend is obvious too (Fig. 4d), with amplitude of 1.47 MJ m−2month−1 per
decade. These two seasons play important roles in the temporal dynamics of annual diffuse radiation. Winter has a slightly increasing trend of 0.24 MJ m−2month−1 per decade (Fig. 4e). Unlike other seasons, spring has a mi-nor opposite trend (Fig. 4b), with decreasing amplitude of 0.30 MJ m−2month−1per decade.
3.4 Spatial distribution of the temporal variability of diffuse radiation
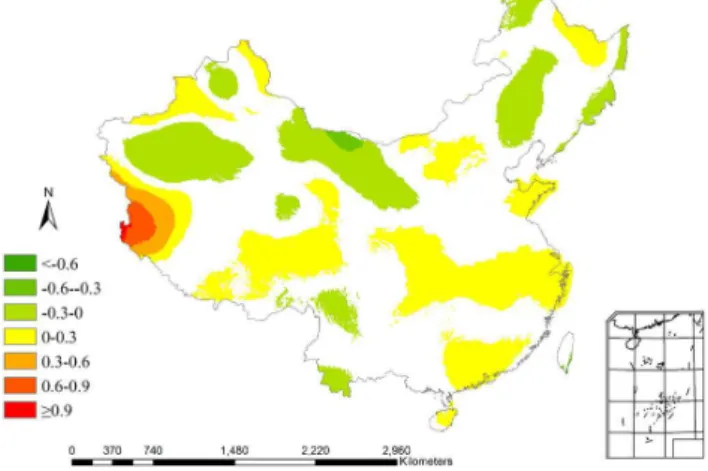
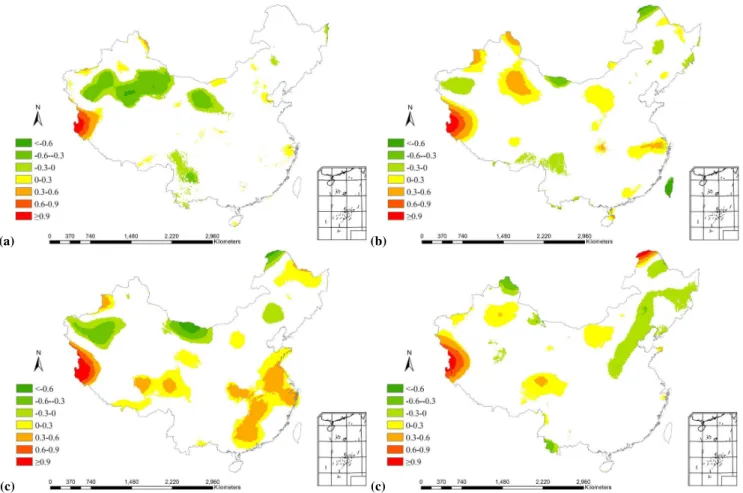
Fig. 5.Spatial distribution of the changing rate of annual diffuse radiation in China from 1981 to 2010 (white areas denote that there are no statistically significant trends,α=0.05. Unit: % per year).
north decreasing overall (Fig. 5). And in the eastern part of China, there is a consistent increasing trend except the north-eastern part. The Tianshan Mountains have an uptrend (0– 3 % per decade) while the Junggar Basin in the north and the Tarim Basin in the south both present a downtrend (0– 3 % per decade). The northern areas of Hexi Corridor, in-cluding Badain Jaran Desert, have an obvious decreasing trend (0–4 % per decade). The annual diffuse radiation of Qinghai-Tibet Plateau has increased significantly in recent 30 years except the southeast foot and the Tsaidam Basin. North China, central China and south China have rising an-nual diffuse radiation, especially obvious in the Shandong Peninsula, the middle and lower reaches of the Yangtze River and Guangdong province, with increasing rates at 1 %–3 % per decade. In these eight regions of China, Qinghai-Tibet Plateau has the most obvious increasing trend of annual dif-fuse radiation with highest increasing rate up to 9 % per decade, and the northwest China has the most evident de-creasing trend with highest dede-creasing rate of more than 6 % per decade.
There are significant seasonal differences in the spatial dis-tribution of the temporal variability of diffuse radiation in China from 1981 to 2010 (Fig. 6) in addition to the regional heterogeneity just mentioned (Fig. 5). The overall spatial pat-terns of variations of seasonal diffuse radiation are roughly similar to the distribution of annual diffuse radiation, but the changing rates and areas are much more different. Signifi-cant decreasing areas of diffuse radiation dominate in spring, while the areas of upward trends exceed the downtrends ob-viously in summer and autumn, and the increasing amplitude is much larger than annual diffuse radiation. In winter, the area of uptrend is slightly larger than that of downtrend, rep-resenting a minor rise of diffuse radiation. This is consistent with the interannual variation of pixel-averaged diffuse radi-ation all across China (Fig. 4) described in Sect. 3.3.
Specifically, in spring, the variation trend of the eastern region of China is not statistically significant, but the north-west China region has a significant downward trend (Fig. 6a). When it comes to summer, the declining areas in northwest China reduce notably, and even some uptrend areas emerge. The eastern region of China also begins to have significant increasing trends (Fig. 6b). In autumn, the areas with ob-vious increasing trends expand further, mainly concentrated in central China, and the ascending areas of Qinghai-Tibet Plateau also increase substantially (Fig. 6c). But in winter, central China changes back, with no significant changing trend again. The northeastern part of China showed the most significant downtrend in winter (Fig. 6d).
4 Discussion
There are many factors influencing diffuse radiation, such as extraterrestrial radiation, greenhouse gases (GHGs), clouds and aerosols (Che et al., 2005; Kanniah et al., 2012). Ex-traterrestrial radiation is determined by solar constant and ge-ographical latitude, and the variation of solar constant is neg-ligible, with changing amplitude of only about 1.36 W m−2 (Zhu et al., 2010; Lean, 1997). Unlike the greenhouse gases, which are distributed almost uniformly over the globe, clouds and aerosols have substantial spatial and temporal variations (Ramanathan et al., 2001). Therefore, all the factors deter-mine the spatial distribution of diffuse radiation all together, but only clouds and aerosols are the main variables affecting the spatial and temporal variations of diffuse radiation (Kan-niah et al., 2012).
Clouds and aerosols can influence the total and partition-ing of solar radiation into direct and diffuse components (Kanniah et al., 2012), namely global radiation and dif-fuse fraction. Understanding the characteristics of clouds and aerosols is critical to predict the variations of diffuse radia-tion. Atmospheric aerosols can be categorized into sulfates, carbonaceous (organic and black carbon) particles, sea salt and mineral dust (Kanniah et al., 2012; Menon et al., 2002), and the sources involve volcanic eruptions (Farquhar and Roderick, 2003; Gu et al., 2003), human activities (Kvalevag and Myhre, 2007) and so on. Pure sulfate aerosols primarily scatter solar radiation, and produce much more diffuse radi-ation without reducing the total radiradi-ation substantially, while carbonaceous aerosols both absorb and scatter solar radiation (Ramanathan et al., 2001). In addition to the direct radiative forcing, aerosols also have indirect effects on diffuse radia-tion through their modificaradia-tion of cloud properties (Mercado et al., 2009; Qian and Giorgi, 2000). Increases in cloud cover and scattering aerosols enhance the diffuse fraction of the ra-diation reaching the surface, whereas increasing concentra-tions of absorbing aerosols just reduce the total solar radia-tion (Mercado et al., 2009).
(a) (b)
(c) (c)
Fig. 6.Spatial distribution of changing rate of seasonal diffuse radiation in China from 1981 to 2010 (white areas denote that there are no statistically significant trends,α=0.05.a,b,candddenote spring, summer, autumn and winter. Unit: % per year).
season or pollution level (Wild, 2009), and the net effect of clouds and aerosols on diffuse radiation depends on a balance between the reduction in global radiation and the enhance-ment in the diffuse fraction. We therefore calculated and an-alyzed the spatial data of extraterrestrial radiation, global ra-diation, clearness index and diffuse fraction with the same procedure as diffuse radiation, for the purpose of exploring the reasons of the spatial distribution and temporal variability of diffuse radiation.
4.1 Cause for the spatial patterns of diffuse radiation
The spatial patterns of annual diffuse radiation in China should be consistent with that of extraterrestrial radiation, which decreases with increasing latitude (figures not shown), if there are no impacts from other factors. However, the ac-tual spatial patterns of annual diffuse radiation in China are complex and inhomogeneous (Fig. 2) due to the effects of clouds and aerosols on global radiation and diffuse fraction. Figures 7 and 8 show the spatial distribution of annual global radiation and annual diffuse fraction, respectively, averaged over the period of 1981 to 2010. The global radiation ranges from 3133.35 MJ m−2yr−1to 7128.97 MJ m−2yr−1, higher
in the west and lower in other areas (Fig. 7), while the dif-fuse fraction ranges from 24.27 % to 74.62 %, higher in the southeastand lower in other regions (Fig. 8) . Taken together, these lead to lower diffuse radiation in the north, and higher diffuse radiation in the south and west (Fig. 2).
The carbonaceous aerosols in China are mostly concen-trated in the areas south to the Yellow River and east to the Tibetan Plateau, and the Sichuan Basin even has the highest value because of its special geographical and climatic condi-tions (Su and Wang, 2009; Su et al., 2010). Meanwhile, most areas of the southern part of China have higher cloud cover (above 65 %) than the northern part, especially in the Sichuan Basin (higher than 75 %) (Duan and Liu, 2011). This leads to relatively high diffuse fraction in central China (Fig. 8), but the global radiation is reduced much more (Fig. 7). Accord-ingly, the diffuse radiation is relatively low in the middle and lower reaches of the Yangtze River, and the Sichuan Basin even becomes a low value center of diffuse radiation in China (Fig. 2).
Fig. 7.Spatial distribution of perennial average of annual global radiation in China during 1981–2010 (Unit: MJ m−2yr−1).
Fig. 8.Spatial distribution of perennial average of annual diffuse fraction in China during 1981–2010 (Unit: %).
(Su and Wang, 2009). Therefore, although the global radia-tion is highest in the Qinghai-Tibet Plateau (Fig. 7), the dif-fuse radiation is not so rich (Fig. 2) because of the very low diffuse fraction (Fig. 8). However, extremely high diffuse ra-diation exists in the southeast foot (Fig. 2). This may con-tribute to the cross-country transportation of aerosols through southwest monsoon, which makes the southeast foot a high value center of aerosols in China (Su and Wang, 2009; Su et al., 2010), thereby reducing the global radiation (Fig. 7) but enhancing the diffuse fraction even more (Fig. 8).
As for seasonal diffuse radiation, the spatial patterns of the diffuse radiation in spring, autumn and winter are roughly similar to that of annual diffuse radiation, but the distribu-tion in summer is much different (Fig. 3). In this case, the extraterrestrial radiation is the main reason for the differ-ence. The quantity of extraterrestrial radiation increases with decreasing latitude in spring, autumn, winter and the year as a whole, but it is not the same in summer (figures not shown) because of the change of solar declination. The
ex-1
(e)
(d)
(c)
(b)
(a)
Fig. 9.Anomalies of annual and seasonal clearness index averaged all across China from 1981 to 2010 (adenotes annual clearness in-dex;b,c,dandedenote seasonal clearness index of spring, sum-mer, autumn and winter, respectively. Unit: %). The averages are 48.47, 48.52, 46.48, 50.92 and 49.43, respectively.
traterrestrial radiation in summer peaks and then decreases, from north to south in China. And the extraterrestrial radia-tion is the basis of diffuse radiaradia-tion, so the diffuse radiaradia-tion in summer has its distinctive spatial pattern compared to other seasons and the year as a whole.
4.2 Cause for the temporal variation of diffuse radiation
(e)
(d)
(c)
(b)
(a)
Fig. 10.Anomalies of annual and seasonal diffuse fraction aver-aged all across China from 1981 to 2010 (adenotes annual diffuse fraction;b,c,d andedenote seasonal diffuse fraction of spring, summer, autumn and winter, respectively. Unit: %). The averages are 47.01, 47.42, 51.10, 42.65 and 43.88, respectively.
consistent with the negative correlation between the diffuse fraction and clearness index (Liu and Jordan, 1960).
The trend of annual clearness index is decreasing with the rate of 0.08 % per decade (Fig. 9a, Table 4), while that of annual diffuse fraction is increasing with the rate of 0.21 % per decade (Fig. 10a, Table 5) during the period of 1981 to 2010. Because the changing rate of diffuse fraction is much larger than that of the clearness index, the annual diffuse ra-diation has shown an upward trend similar to diffuse fraction in recent 30 years (Fig. 4a). As for seasonal scales, the clear-ness index of all seasons exhibits downward trends except for spring (Fig. 9b–e), whereas the diffuse fraction exhibits up-ward trends for all seasons except spring (Fig. 10b–e). From Tables 4 and 5, we can see that the changing rates of diffuse fraction are larger than those of the clearness index in all sea-sons, so the trends of seasonal diffuse radiation are consistent with those of diffuse fraction (Fig. 4b–e). Meanwhile, the changing rates of diffuse fraction in summer and autumn are 0.52 % per decade and 0.49 % per decade, respectively, much
Table 4.Linear regression coefficients of annual and seasonal clear-ness index from 1981 to 2010 for annual clearclear-ness index.
Annual Spring Summer Autumn Winter
Slope −0.008 0.020 −0.024 −0.013 −0.047 Intercept 48.596 48.205 46.862 51.118 50.157 R 0.151 0.139 0.173 0.100 0.225
Table 5.Linear regression coefficients of annual and seasonal dif-fuse fraction from 1981 to 2010 for annual difdif-fuse fraction.
Annual Spring Summer Autumn Winter
Slope 0.021 −0.026 0.052 0.049 0.051 Intercept 46.685 47.824 50.287 41.897 43.096 R 0.299 0.166 0.314 0.367* 0.254
* significant atα=0.05
larger than those of the clearness index, which are 0.24 % per decade and 0.13 % per decade, respectively. While the varia-tion amplitudes of clearness index are 0.2 % per decade and 0.47 % per decade in spring and winter, close to 0.26 % per decade and 0.51 % per decade of diffuse fraction. Therefore, the changing amplitudes of diffuse radiation in summer and autumn are much larger than spring and winter (Fig. 4b–e, Table 3).
Although an overall uptrend is observed in these exam-ined 30 years of 1981–2010, the annual diffuse radiation has a distinct declining trend from 1981 to 1990 along with anomalously high values in 1982–1983, and extremely fast increases in 1991–1992 (Fig. 4a). As China has experienced significant decreases in cloud cover over the last several decades (Wu and Liu, 2011; Qian et al., 2006; Kaiser, 2000), cloud cover cannot be the main factor influencing the varia-tion of diffuse radiavaria-tion in recent 30 years. Wang et al. (2012) proved that the spatiotemporal changes in sunshine hours in China could largely be explained by API (air pollution in-dex), which is a representative index of aerosols and pos-itively relates with diffuse fraction. Additionally, Guo et al. (2011) and de Meij et al. (2012) showed that there is no apparent trend in aerosols in the 1980s, but a significant up-trend was observed in the 1990s and the first ten years of the 21st century. Meanwhile, Zhang et al. (2012) found that scat-tering aerosols are majorities of the total aerosols in China in most circumstances. Therefore, it seems reasonable to at-tribute the overall increase and decline in the 1980s of diffuse radiation to aerosols.
1981, the diffuse radiation has unusually positive anomalies in 1982 and 1983. It is worth mentioning that many stud-ies have investigated the consequences of the 1991 Pinatubo eruption (Blumthaler and Ambach, 1994; Farquhar and Rod-erick, 2003; Mercado et al., 2009; Gu et al., 2003), such as solar radiation and carbon cycle. The 1991 eruption of Mount Pinatubo in the Philippines released about 20 million tons of sulfur dioxide gas into the lower stratosphere up to 30 km altitude (Blumthaler and Ambach, 1994). The consequent aerosol concentration in the atmosphere was the strongest it had been since the 1883 eruption of Krakatoa (Blumthaler and Ambach, 1994), and greatly increased diffuse radiation worldwide the following 2 years (Mercado et al., 2009). Therefore, there was also a dramatically increasing trend of annual diffuse radiation in 1991 and 1992 (Fig. 4a). After 1992, the impact of the eruption gradually dissipated, along with the decline of diffuse radiation in China before 1995 (Fig. 4a). As a result of the increasing trend of aerosols in the 1990s and the first ten years in the 21st century in China (Guo et al., 2011; de Meij et al., 2012), the annual diffuse radiation in 1995 is far greater than the value of the bottom in 1990, and the uptrend occurs afterwards.
5 Conclusions
We calculated the spatial data of monthly and annual diffuse radiation from 1981 to 2010, and analyzed the spatial pat-terns and temporal variability of annual and seasonal diffuse radiation in China. We found that
1. The spatial patterns of perennial average of annual dif-fuse radiation during 1981–2010 are complex and inho-mogeneous in China, lower in the north and higher in the south and west on the whole, which can contribute to the effects of clouds and aerosols on global radia-tion and diffuse fracradia-tion. The perennial average ranges from 1730.20 to 3064.41 MJ m−2yr−1across the whole
country, with mean value of 2476.98 MJ m−2yr−1. Summer exhibits the maximum quantity and most tinctive spatial pattern of diffuse radiation due to the dis-tribution of extraterrestrial radiation.
2. There is a significant increasing trend of annual diffuse radiation in China from 1981 to 2010 on the whole, with a distinct downtrend in the first 10 years. The mean increasing amplitude of annual diffuse radiation was 7.03 MJ m−2yr−1 per decade. There are evident anomalies in 1982, 1983, 1991 and 1992, due to the El Chinchon eruption in 1982 and the Pinatubo eruption in 1991. Also, the variation trends of diffuse radiation of all seasons are upward except in the spring.
3. The spatial distribution of the variability of diffuse ra-diation showed significant regional and temporal differ-ences in the 30 years between 1981–2010. The diffuse
radiation in the southern areas of China increased, and decreased overall in the northern areas. The Qinghai-Tibet Plateau exhibited the most obvious increasing trend, while the northwest China region exhibited the most evident decreasing trend. Throughout the 30 years, the trends of most areas changed with the seasons. This study examined the spatiotemporal variability charac-teristics of long-term diffuse radiation of China comprehen-sively. Although the procedures of data observation, model expansion and spatial interpolation would inevitably lead to some uncertainties, the spatial data still can reflect the spatial patterns and temporal trends of diffuse radiation in general. This will facilitate the explicit treatment of diffuse radiation in regional scale modeling of ecosystem processes.
Acknowledgements. This research was supported by the
Na-tional Key Research and Development Program (Grant No. 2010CB833500), “Strategic Priority Research Program – Climate Change: Carbon Budget and Relevant Issues” of the Chinese Academy of Sciences (Grant No. XDA05050600), and the Environmental Protection Public Welfare Industry Targeted Research Fund (Grant No. gyh5031103). The radiation and sunshine duration data used in this study were obtained from China Meteorology Administration, which is highly acknowledged. We really appreciate the kind help of the topical editor P. Drobinski and the invaluable comments of the reviewers.
Topical Editor P. Drobinski thanks W. Ju and F. Sun for their help in evaluating this paper.
References
Alton, P. B., North, P. R., and Los, S. O.: The impact of dif-fuse sunlight on canopy light-use efficiency, gross photosynthetic product and net ecosystem exchange in three forest biomes, Global Change Biology, 13, 776–787, doi:10.1111/j.1365-2486.2007.01316.x, 2007.
Angstrom, A.: Solar and terrestrial radiation. Report to the inter-national commission for solar research on actinometric investi-gations of solar and atmospheric radiation, Q. J. Roy. Meteorol. Soc., 50, 121–126, 1924.
Bhattacharya, A. B., Kar, S. K., and Bhattacharya, R.: Diffuse so-lar radiation and associated meteorological parameters in India, Ann. Geophys., 14, 1051–1059, doi:10.1007/s00585-996-1051-1, 1996.
Blumthaler, M. and Ambach, W.: Changes in Solar-Radiation Fluxes after the Pinatubo Eruption, Tellus B, 46, 76–78, 1994. Boland, J., Scott, L., and Luther, M.: Modelling the diffuse fraction
of global solar radiation on a horizontal surface, Environmetrics, 12, 103–116, 2001.
Boland, J., Ridley, B., and Brown, B.: Models of dif-fuse solar radiation, Renew Energ, 33, 575–584, doi:10.1016/j.renene.2007.04.012, 2008.
Chen, R. S., Ersi, K., Yang, J. P., Lu, S. H., and Zhao, W. Z.: Validation of five global radiation models with measured daily data in China, Energ. Convers. Manage., 45, 1759–1769, doi:10.1016/j.enconman.2003.09.019, 2004.
de Meij, A., Pozzer, A., and Lelieveld, J.: Trend analy-sis in aerosol optical depths and pollutant emission esti-mates between 2000 and 2009, Atmos. Environ., 51, 75–85, doi:10.1016/j.atmosenv.2012.01.059, 2012.
Duan, J. and Liu, Y.: Variation and Trends of Cloud Amount in China over Past 20 Years, Meteorol. Sci. Technol., 39, 280–288, 2011 (in Chinese).
Erbs, D. G., Klein, S. A., and Duffie, J. A.: Estimation of the Diffuse-Radiation Fraction for Hourly, Daily and Monthly-Average Global Radiation, Sol. Energy, 28, 293–302, 1982. Farquhar, G. D. and Roderick, M. L.: Atmospheric science:
Pinatubo, diffuse light, and the carbon cycle, Science, 299, 1997– 1998, 2003.
Gu, L. H., Baldocchi, D., Verma, S. B., Black, T. A., Vesala, T., Falge, E. M., and Dowty, P. R.: Advantages of diffuse radiation for terrestrial ecosystem productivity, J. Geophys. Res.-Atmos., 107, 4050, doi:10.1029/2001jd001242, 2002.
Gu, L. H., Baldocchi, D. D., Wofsy, S. C., Munger, J. W., Michalsky, J. J., Urbanski, S. P., and Boden, T. A.: Response of a deciduous forest to the Mount Pinatubo eruption: Enhanced photosynthesis, Science, 299, 2035–2038, 2003.
Guo, J. P., Zhang, X. Y., Wu, Y. R., Zhaxi, Y. Z., Che, H. Z., La, B., Wang, W., and Li, X. W.: Spatio-temporal variation trends of satellite-based aerosol optical depth in China during 1980–2008, Atmos. Environ., 45, 6802–6811, doi:10.1016/j.atmosenv.2011.03.068, 2011.
Guo, Q. Y., Ma, J. Y., Li, W., Liu, F. Q., and Zhang, Y. C.: The general study on the radicalization of the dispersion of the sun in nearly fifities years in China, Chinese Journal of Scientific In-strument, 30, 235–239, 2009 (in Chinese).
Hijmans, R. J., Cameron, S. E., Parra, J. L., Jones, P. G., and Jarvis, A.: Very high resolution interpolated climate sur-faces for global land areas, Int. J. Climatol., 25, 1965–1978, doi:10.1002/Joc.1276, 2005.
Hutchinson, M.: Interpolating mean rainfall using thin plate smoothing splines, Int. J. Geographical Information Systems, 9, 385–403, 1995.
Hutchinson, M. F.: Interpolation of rainfall data with thin plate smoothing splines. Part II: Analysis of topographic depen-dence, J. Geographic Information Decision Analysis, 2, 152– 167, 1998a.
Hutchinson, M. F.: Interpolation of rainfall data with thin plate smoothing splines. Part I: Two dimensional smoothing of data with short range correlation, J. Geographic Information Decision Analysis, 2, 139–151, 1998b.
Hutchinson, M. F.: ANUSPLIN Version 4.2 User Guide, Center for Resource and Environmental Studies, the Australian National University, Canberra, 2001.
Iqbal, M.: Correlation of Average Diffuse and Beam Radiation with Hours of Bright Sunshine, Sol Energy, 23, 169–173, 1979. Iqbal, M.: Prediction of Hourly Diffuse Solar-Radiation from
Mea-sured Hourly Global Radiation on a Horizontal Surface, Sol. En-ergy, 24, 491–503, 1980.
Kaiser, D. P.: Decreasing cloudiness over China: An updated anal-ysis examining additional variables, Geophys. Res. Lett., 27,
2193–2196, 2000.
Kanniah, K. D., Beringer, J., North, P., and Hutley, L.: Con-trol of atmospheric particles on diffuse radiation and terrestrial plant productivity: A review, Prog. Phys. Geog., 36, 209–237, doi:10.1177/0309133311434244, 2012.
Kvalevag, M. M. and Myhre, G.: Human impact on direct and dif-fuse solar radiation during the industrial era, J. Climate., 20, 4874–4883, doi:10.1175/Jcli4277.1, 2007.
Lauret, P., Boland, J., and Ridley, B.: Derivation of a Solar Diffuse Fraction Model in a Bayesian Framework, Case Studies in Busi-ness, Industry and Government Statistics, 3, 108–122, 2010. Lean, J.: The sun’s variable radiation and its relevance for earth,
Annu. Rev. Astron. Astr., 35, 33–67, 1997.
Liang, F. and Xia, X. A.: Long-term trends in solar radiation and the associated climatic factors over China for 1961–2000, Ann. Geo-phys., 23, 2425–2432, doi:10.5194/angeo-23-2425-2005, 2005. Lin, W. X., Lu, E. R., Gao, W. F., Pu, S. X., and Liu, T.: Distribution
patterns of diffuse solar radiation in Yunnan Province, China, En-erg. Convers. Manage., 37, 553–560, 1996.
Liu, B. Y. H. and Jordan, R. C.: The Interrelationship and Charac-teristic Distribution of Direct, Diffuse and Total Solar Radiation, Sol. Energy, 4, 1–19, 1960.
Liu, S., Qiu, X. F., and Wang, X. Y.: Distributed Modeling of Dif-fuse Solar Radiation over Rugged Terrains of China, Journal of Nanjing Institute of Meteorology, 30, 371–376, 2007 (in Chi-nese).
Ma, J. Y., Liang, H., Luo, Y., and Li, S. K.: Variation trend of direct and diffuse radiation in China over recent 50 years, Acta Phys. Sin., 60, 853–866, 2011 (in Chinese).
Menon, S., Hansen, J., Nazarenko, L., and Luo, Y. F.: Climate ef-fects of black carbon aerosols in China and India, Science, 297, 2250–2253, 2002.
Mercado, L. M., Bellouin, N., Sitch, S., Boucher, O., Huntingford, C., Wild, M., and Cox, P. M.: Impact of changes in diffuse ra-diation on the global land carbon sink, Nature, 458, 1014–1017, doi:10.1038/Nature07949, 2009.
Oliveira, P. J. C., Davin, E. L., Levis, S., and Seneviratne, S. I.: Vegetation-mediated impacts of trends in global radiation on land hydrology: a global sensitivity study, Global Change Biology, 17, 3453–3467, doi:10.1111/j.1365-2486.2011.02506.x, 2011. Page, J. K.: The estimation of monthly mean values of daily total
short wave radiation on vertical and inclined surfaces from sun-shine records for latitudes 40 N–40 S, Proc. UN Conf. on New Sources of Energy, 378–390, 1961.
Qian, Y. and Giorgi, F.: Regional climatic effects of anthropogenic aerosols? The case of Southwestern China, Geophys. Res. Lett., 27, 3521–3524, 2000.
Qian, Y., Kaiser, D. P., Leung, L. R., and Xu, M.: More frequent cloud-free sky and less surface solar radiation in China from 1955 to 2000, Geophys. Res. Lett., 33, L01812, doi:10.1029/2005gl024586, 2006.
Ramanathan, V., Crutzen, P. J., Kiehl, J. T., and Rosenfeld, D.: At-mosphere – Aerosols, climate, and the hydrological cycle, Sci-ence, 294, 2119–2124, 2001.
Reindl, D. T., Beckman, W. A., and Duffie, J. A.: Diffuse Fraction Correlations, Sol. Energy, 45, 1–7, 1990.
2001.
Shi, G. Y., Hayasaka, T., Ohmura, A., Chen, Z. H., Wang, B., Zhao, J. Q., Che, H. Z., and Xu, L.: Data quality assessment and the long-term trend of ground solar radiation in China, J. Appl. Mete-orol. Clim., 47, 1006–1016, doi:10.1175/2007jamc1493.1, 2008. Skartveit, A. and Olseth, J. A.: A Model for the Diffuse Fraction of
Hourly Global Radiation, Sol. Energy, 38, 271–274, 1987. Stanhill, G. and Cohen, S.: Global dimming: a review of the
evi-dence for a widespread and significant reduction in global radia-tion with discussion of its probable causes and possible agricul-tural consequences, Agr. Forest Meteorol., 107, 255–278, 2001. Su, X. T. and Wang, H. J.: A Simulation Study on Distributive
Characteristics and Radiative Forcing of Black Carbon Aerosols over China, Transactions of Atmospheric Sciences, 32, 798–806, 2009 (in Chinese).
Su, X. T., Wang, H. J., and Zhou, L.: A simulation study on temporal and spatial distribution characteristics and radiative forcing of organic carbon aerosols in China, J. Trop. Meteorol., 26, 765– 772, 2010 (in Chinese).
Sun, Z. A., Shi, J. R., and Weng, D. M.: A further research on the climatological calculation method of the global solar radiation over China, Journal of Nanjing Institute of Meteorology, 15, 21– 29, 1992 (in Chinese).
Urban, O., Janous, D., Acosta, M., Czerny, R., Markova, I., Navratil, M., Pavelka, M., Pokorny, R., Sprtova, M., Zhang, R., Spunda, V., Grace, J., and Marek, M. V.: Ecophysiological controls over the net ecosystem exchange of mountain spruce stand. Comparison of the response in direct vs. diffuse solar radia-tion, Global Change Biology, 13, 157–168, doi:10.1111/j.1365-2486.2006.01265.x, 2007.
Wang, J. L. and Liang, X. J.: Non-parametric statistical analysis, Higher Education Press, Beijing, 2006 (in Chinese).
Wang, Y. W., Yang, Y. H., Zhao, N., Liu, C., and Wang, Q. X.: The magnitude of the effect of air pollution on sun-shine hours in China, J. Geophys. Res.-Atmos., 117, D00V14, doi:10.1029/2011jd016753, 2012.
Wei, F. Y.: Modern statistical diagnosis and forecasting techniques for climate, China Meteorological Press, Beijing, 1999 (in Chi-nese).
Wild, M.: Global dimming and brightening: A review, J. Geophys. Res.-Atmos., 114, D00D16, doi:10.1029/2008jd011470, 2009. Wild, M., Gilgen, H., Roesch, A., Ohmura, A., Long, C.
N., Dutton, E. G., Forgan, B., Kallis, A., Russak, V., and Tsvetkov, A.: From dimming to brightening: Decadal changes in solar radiation at Earth’s surface, Science, 308, 847–850, doi:10.1126/science.1103215, 2005.
Wu, J. and Liu, J.: Trend of cloud amount in East Asia under the backdrop of global warming in the past 20 years, J. Trop. Mete-orol., 27, 551–559, 2011 (in Chinese).
Zhang, M., Yu, G.-R., Zhang, L.-M., Sun, X.-M., Wen, X.-F., Han, S.-J., and Yan, J.-H.: Impact of cloudiness on net ecosystem exchange of carbon dioxide in different types of forest ecosys-tems in China, Biogeosciences, 7, 711–722, doi:10.5194/bg-7-711-2010, 2010.
Zhang, M., Yu, G. R., Zhuang, J., Gentry, R., Fu, Y. L., Sun, X. M., Zhang, L. M., Wen, X. F., Wang, Q. F., Han, S. J., Yan, J. H., Zhang, Y. P., Wang, Y. F., and Li, Y. N.: Effects of cloudi-ness change on net ecosystem exchange, light use efficiency, and water use efficiency in typical ecosystems of China, Agr. Forest Meteorol., 151, 803–816, doi:10.1016/j.agrformet.2011.01.011, 2011.
Zhang, X. Y., Wang, Y. Q., Niu, T., Zhang, X. C., Gong, S. L., Zhang, Y. M., and Sun, J. Y.: Atmospheric aerosol com-positions in China: spatial/temporal variability, chemical sig-nature, regional haze distribution and comparisons with global aerosols, Atmos. Chem. Phys., 12, 779–799, doi:10.5194/acp-12-779-2012, 2012.
Zhang, Y. L., Qin, B. Q., and Chen, W. M.: Analysis of 40 year records of solar radiation data in Shanghai, Nanjing and Hangzhou in Eastern China, Theor. Appl. Climatol., 78, 217– 227, doi:10.1007/s00704-003-0030-7, 2004.