The Brazilian Venture Capital Industry and its Strategic
Role in Closing the Financing Gap of SMEs
This discussion paper is a contribution of the Brazilian Government to the 2006 Annual Conference of the OECD High-level Conference on "Better Financing for Entrepreneurship and SMEs" to be held in Brasilia, Brazil on 27-30 March 2006. It has been prepared by The Center for Studies in Private Equity and Venture Capital of EAESP-Fundação Getúlio Vargas under the auspices of ABDI – Agência Brasileira para o Desenvolvimento Industrial – an agency of the Ministry of Industrial Development and Foreign Trade, in cooperation with ABVCAP – The Brazilian Association of Private Equity and Venture Capital
Index
AUTHORS AND COLLABORATORS... 1
I. INTRODUCTION ... 2
II. VENTURE CAPITAL IN BRAZIL AND THE FINANCING OF SMALL AND MEDIUM SIZED ENTERPRISES... 6
II.1 ENTREPRENEURIAL ACTIVITY IN BRAZIL: A PERSPECTIVE... 6
II.2 CORPORATE FINANCING FOR MICRO,SMALL AND MEDIUM SIZED COMPANIES:ADIAGNOSIS... 7
III. THE CONSOLIDATION OF THE BRAZILIAN PRIVATE EQUITY AND VENTURE CAPITAL INDUSTRY... 10
IV. THE ORGANIZATION AND SUSTAINABILITY OF THE BRAZILIAN PE/VC INDUSTRY ... 19
IV.1 THE PLAYERS IN THE PE/VCINDUSTRY IN BRAZIL... 19
IV.1.1 Managing Organizations... 19
IV.1.2 Investment Vehicles ... 25
IV.1.3 Funds Investors ... 28
IV.2 THE CYCLE OF PE/VC IN BRAZIL... 31
IV.2.1 Investment Origination and Selection ... 31
IV.2.2 Investment Structuring ... 32
IV.3 THE NEW REGULATORY FRAMEWORK OF THE PE/VCINDUSTRY:CORPORATE AND TAX LAWS... 36
IV.3.1 Legal Aspects ... 36
IV.3.2 Taxation of Private Equity and Venture Capital Investments in Brazil ... 38
V. GOVERNMENT SPONSORED PROGRAMS TO INCREASE VENTURE CAPITAL FINANCING OF SMES: SOME LESSONS FROM THE INTERNATIONAL EXPERIENCE... 41
V.1 ABRIEF OVERVIEW OF RELEVANT INTERNATIONAL EXPERIENCES... 43
V.1.1 The North American Experience ... 43
V.1.2 The German Program - WFG ... 43
V.1.3 The Israeli Program – YOZMA and INBAL ... 45
V.1.4 The British Program ... 45
AUTHORS AND COLLABORATORS
This discussion paper is the result of a coordinated work of the following authors and collaborators. It is based on a previous research performed by the same experts entitled
“The Financing GAP of SMEs in Brazil”, December 2005 for the ABDI (Agência Brasileira de Desenvolvimento Industrial).
Prof. Claudio Vilar Furtado, MSc, DBA
Executive Director, Center for the Study of Private Equity and Venture Capital, FGV-EAESP
Editor and Author
Tiago de Melo Cruz, MBA
Associate Researcher, Center for the Study of Private Equity and Venture Capital, FGV-EAESP
Executive Coordinator
Prof. Antonio Gledson de Carvalho, MSc, PhD
Associate Professor, FGV-EAESP
Prof. Hsia Hua Sheng, DBA
Associate Professor, FGV-EAESP
Prof. Marcio Issao Nakane, DE
Associate Professor, FEA-USP
Prof. Marco Aurélio Bedê, DE
Manager, Economic Research Assessment, SEBRAE – SP
Leonardo de Lima Ribeiro, MSc
Associate Researcher, Center for the Study of Private Equity and Venture Capital, FGV-EAESP
João Ricardo de Azevedo Ribeiro
Corporate Lawyer and Partner, Mattos Filho, Veiga Filho, Marrey Jr. e Quiroga Advogados
Ricardo Pereira Ribeiro, LL.M
Corporate Lawyer, Lacaz Martins, Halembeck, Pereira Neto, Gurevich & Schoueri Advogados
Ricardo Lacaz Martins, Master in Law
Corporate Lawyer and Partner, Lacaz Martins, Halembeck, Pereira Neto, Gurevich & Schoueri Advogados
Maurício José Serpa Barros de Moura, MBA - University of Chicago
Associate Professor, IBMEC-SP
Team of BNDES (National Bank for the Economic and Social Development) Capital Market Branch
Ethel Rosemberg Handfas
Communication Department, FINEP (Studies and Projects Financing Agency)
I. INTRODUCTION
This paper examines the role of the Private Equity and Venture Capital industry in Brazil. In particular we describe the financing gap for small and medium enterprises’ (SMEs) and the role played by the PE/VC industry in bridging the financing gap that these companies face during their lives.
We address this issue by looking at the determinants of both the supply and the demand for capital for SMEs in Brazil. On the demand side we focus on the formation and growth processes of SMEs. On the supply side we examine the structure and functioning of the Brazilian Private Equity and Venture Capital industry, as well as the government initiatives to foster entrepreneurship and provide risk capital.
In our view, the Brazilian Venture Capital industry holds a strategic position in the financing chain of high-growth SMEs because it has developed the necessary skills to foster innovation and competition. Considering the number of PE/VC management firms operating in the country, their quality, the level of education and experience of their managers, the current stage of market oriented institutions, and the developments of the legal system, the Brazilian PE/VC industry will continue to play a fundamental role in the development of innovative and high tech enterprises in the country.
According to the Global Entrepreneurship Monitor research, Brazil is one of the seven countries with the highest entrepreneurship activity (as measured by the ratio of entrepreneurs to the total population). Even though, most of Brazilian entrepreneurs are
entrepreneurs by necessity, there is still a considerable number of entrepreneurs by opportunity. The high absolute number of entrepreneurs by opportunity suggests a
continuous deal flow for the PE/VC industry.
As the World Bank Investment Climate Survey (WBICS) shows, credit and other
types of financing for SMEs are still quite scarce in Brazil. The existing bank loans are predominantly short term, especially for companies with lack of collateral (characteristics of SMEs). Credit is also scarce due to the high interest rates that have prevailed in Brazil (the second highest in the world). A recent survey of SMEs in the State of Sao Paulo, pointed out that 77% of the entrepreneurs are willing to pay as much as 2% a.m. for loans (600 b.p. above return on the Treasury bills). The banking system charges at least 1500 b.p. above the T-bill rate on receivables-backed trade credit.
consequence, bank financing and trade credit represent no more than a third of new businesses’ financing. Bank credit and other forms of loans account for meager 3% of SMEs initial funding. Non-bank credit for SMEs is available in the country but to a much lesser extent. Personal funds are by far the main sources for initial capitalization for micro and small businesses. In the course of their existence, internal cash flow generation is the most important source of capital.
Despite the lack of financing, Brazil presents good opportunity for entrepreneurship: The country has (i) large population; (ii) vigorous economy; (iii) high degree of scientific and technological developments; and (iv) considerable institutional development to foster entrepreneurship.
Between 1993 and 2003, the number of newly launched enterprises varied between 445,000 and 533,000 a years. The majority of these new enterprises (80%) are dedicated to retail-trade and services, activities that usually require low capital investments and technology. They are mainly family-owned businesses, with major focus on meeting the basic needs of the population (food, clothing, construction, furniture and personal services). However, a few of the remaining 20% (nearly 100,000 a year) may present potential for adequate forms of seed and early-stage VC investment.
A large number of candidate firms to seed and early-stage investments come form the business-incubator program. This program is experiencing rapid growth in Brazil. The number of active incubators went from 135 in 2000 to a 283 in 2004. A recent assessment of the program shows that more than five thousand SMEs have benefited from this type of support. Most of the incubated companies bring innovation to industries such as software and information technology (25%), electronics (14%), the Internet (11%), biotechnology (5%), telecommunication (4%) and product design (4%). These are most suitable for PE/VC financing and differ from those of companies traded in the Brazilian stock exchanges.
multilateral institutions and private pension funds, was the first spark in the development of PE/VC vehicles focused on high tech SMEs.
During the past ten years the Brazilian PE/VC industry has evolved significantly. By the end of 2004 there were 71 PE/VC organizations managing US$ 5.58 billion in 97 investment vehicles. The portfolio was comprised of more than 300 companies of all sizes in 26 different sectors.
For a long time there were concerns about the possibility of Brazilian PE/VC managers completing the entire VC investment cycle. The main weakness was in exiting from investments: 1) the Brazilian IPO market had been inactive since the late 1980s; 2) usually only large firms access the American IPO market; and 3) the burst of the stock market bubble in 2000 caused the American market to be highly selective. This posed a threat to the development of a dynamic PE/VC industry. However, 2004 and 2005 witnessed the rebirth of the Brazilian IPO market: In these two years there were 16 IPOs, 9 of which were of venture backed firms. These 16 IPOs raised nearly R$10 billion (US$4.5 billion). The importance of the reopening of the Brazilian IPO market cannot be overemphasized, particularly in view of the extreme underpricing (nearly 7% on average) and high acquisition rates by international investors (nearly 60% on average).
After the completion of the first PE/VC investment cycle, a pool of qualified PE/VC professionals has emerged. There are 498 professionals, of which 233 are partners having long-term commitment to the activity they perform. The group is highly educated (75% passing graduate studies) and experienced (62% work in the industry for more than five years). This group of professionals has become prepared to handle PE/VC challenges in an emerging economy such as Brazil.
While PE/VC constitutes an attractive source of financing, it is obtained by only 1% of all proposed business projects. In 2004 the industry received more than 3,600 investment proposals and invested in 35 of them. During the process, 840 were fully examined by PE/VC professionals and 140 reached the due diligence stage. Only 25% of those underwent the due diligence process received investment in the same year.
considers the growth opportunity for the Brazilian PE/VC industry: while investments in PE/VC represent 1% of the American GDP, PE/VC investment in Brazil is as low as 0.06% of GDP.
The Brazilian institutional environment has also become supportive of early-stage entrepreneurial activity. The recent developments in this area include: (i) a new corporate law; (ii) acknowledgement of arbitration; (iii) a new bankruptcy law (which has opened new avenues for corporate recovery as a substitute for liquidation); (iv) liberalization of pension funds portfolio composition to allow for a quarter percentage of VC/PE investment in their portfolios; and (v) changes in the PE/VC regulation with great emphasis on governance. All this had the effect of augmenting pension funds awareness to and interest in this asset class.
Besides the developments listed above, there are suggestions for improving minority shareholder protection in PE/VC funds organized under the CVM (Brazilian SEC) regulatory framework such as admission of different classes of shares with special voting rights, a plural voting system, and the express recognition in the Brazilian Civil Code of rights typically found in PE/VC investment (tag along, drag along, registration rights and liquidation rights).
There is also room to improve the tax burden on the PE/VC activity in Brazil, and recent changes – MP 281 of Feb. 15, 2006- in tax rules have created a greatly improved environment for venture capital investors. The recent provisional measure (MP 281 of Feb. 15, 2006) enacted by the Federal Government has reduced and equalized capital gains tax rates on VC funds investors.
While tax planning has been used to reduce effective taxation on PE/VC capital gains, this technique has proved itself very costly and cumbersome to PE/VC managers that should be otherwise spending their time in their core activities. The industry needs no tax subsidy; on the contrary, adjustments in tax rules such as equal treatment to foreign investment in all types of long-term mutual funds investments should promote a dramatic increase in the availability of PE/VC funding. This has been the aim of MP 281.
funds, development banks, and state controlled companies) are in the process of coordinating efforts and actions in order to stimulate 1) the creation of technology- and innovation-based SMEs and 2) extend financing to these firms (in partnership with the private sector). Nonetheless, there is still need to set up a more comprehensive investment initiative toward seed, start-up and early-stage innovative and technology-based enterprises.
II. VENTURECAPITALINBRAZILANDTHEFINANCINGOFSMALLAND
MEDIUMSIZEDENTERPRISES
The Venture Capital and Private Equity industry is notorious for its ability to extend financing to small fast growing technological firms. These firms are also notorious for their importance in promoting technological progress, and generating highly qualified job opportunities. Next, we argue that Brazil presents favorable conditions — entrepreneurial activity, high company building rates, institutional innovation, and political and economical stability — for the development and consolidation of the Private Equity and Venture Capital industry.
II.1 ENTREPRENEURIAL ACTIVITY IN BRAZIL: A PERSPECTIVE
Brazil presents high entrepreneurial capacity. GEM (2004), a 34-country compared study on the Total Entrepreneurial Activity, has Brazil on the seventh position in terms of entrepreneurial activity. The Total Entrepreneurial Activity rate corresponds to the share of the workforce between 18 and 64 years old who wish and are actively performing actions to start a new enterprise, or who already own a business that has been operating for 42 months at most. The same study notes that Brazil has a high absolute number of entrepreneurs. With nearly 15.4 million entrepreneur prospects and/or new business entrepreneurs in absolute figures, Brazil is superseded only by the United States (20.8 million entrepreneurs, according to the same concept).
Also according to GEM (2004), attention should be paid to the high number of
opportunity entrepreneurs (those motivated by the perception of an opportunity or a little
explored market niche) as opposed to necessity entrepreneurs (those motivated to open a
business due to not finding a reasonable alternative for occupation and income). According to this study, nearly half of the 15.4 million are classified as opportunity entrepreneurs. The
other half is made up by necessity entrepreneurs.
companies capable of promoting robust growth based on high value-added processes. There must also be an institutional development that allows a properly performing financial system to bloom and provide entrepreneurs with the required capital.
On average, nearly 500.000 companies are created every year in Brazil. (DNRC, 2005) Approximately half of them are Sole Proprietorships (companies with only 1 owner) and the other half is made by Limited Liability Enterprises (companies with partners). The share of Corporations, Cooperatives and other type of companies does not achieve 1% of all companies established in any given year.
Most Limited Liability Companies have individuals as partners, and 2-partner limited liability companies are the most common ones (Table 1.11). The presence of other companies as stockholders in new companies occurs at 6% of all new companies at most. In the latter case, the most frequent situation is the creation of a company by large business groups (holding companies) to manage a specific business of the group. (SEBRAE-SP, 2004-a)
Nearly all new companies (99%) are micro- and small-sized, according to the number of employees criterion (SEBRAE-SP, 2004-a)1. Nearly 80% of those new companies operate on the trade and service sectors. Their presence is significant on activities with low capital and technology requirements, focusing mainly on companies intended to meet the people’s basic needs, such as food, clothing, construction, furniture, personal services etc. Those companies are mostly family-owned, and their management is distinguished by this trait (BEDÊ, 2004). In addition, part of the entrepreneurs does not separate company finances from personal ones, using the company’s cash resources to pay for personal expenses and personal resources to pay for company expenses (SEBRAE-SP, 2004).
II.2 CORPORATE FINANCING FOR MICRO-,SMALL- AND MEDIUM-SIZED COMPANIES:A DIAGNOSIS
Brazil has a major deficiency on its corporate financing system. Francisco and Kumar (2005), based on the World Bank Investment Climate Survey2 (WBICS) database,
1 Micro-company: a trade or services company with up to 9 employees, or an industrial company with 19
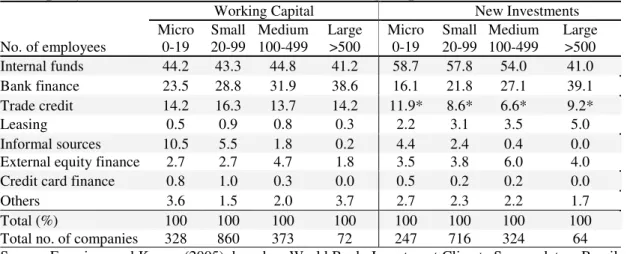
show that Brazilian companies intensely use internal resources as a financing source (Table II-1).
Table II-1
Company Size and Sources of Finance: Working Capital and New Investments
Working Capital New Investments
Micro Small Medium Large Micro Small Medium Large No. of employees 0-19 20-99 100-499 >500 0-19 20-99 100-499 >500 Internal funds 44.2 43.3 44.8 41.2 58.7 57.8 54.0 41.0 Bank finance 23.5 28.8 31.9 38.6 16.1 21.8 27.1 39.1 Trade credit 14.2 16.3 13.7 14.2 11.9* 8.6* 6.6* 9.2* Leasing 0.5 0.9 0.8 0.3 2.2 3.1 3.5 5.0 Informal sources 10.5 5.5 1.8 0.2 4.4 2.4 0.4 0.0 External equity finance 2.7 2.7 4.7 1.8 3.5 3.8 6.0 4.0 Credit card finance 0.8 1.0 0.3 0.0 0.5 0.2 0.2 0.0 Others 3.6 1.5 2.0 3.7 2.7 2.3 2.2 1.7 Total (%) 100 100 100 100 100 100 100 100 Total no. of companies 328 860 373 72 247 716 324 64 Source: Francisco and Kumar (2005), based on World Bank, Investment Climate Survey data – Brazil, 2003.
The ratio of internal funds is more pronounced for fixed capital finance (55% for all companies) than for working capital finance (45% of all companies). The importance of internal funds is more pronounced for micro, small, and medium companies than for large companies. Both the overall reliance on internal funds as a source of finance and the greater use of such source of funds for small and medium companies may be an indirect evidence of financing constraints.
Bank finance is the most widely used external source. Reliance on bank finance is greater for larger companies. Other important external funds are trade credit, and informal sources (specially for working capital finance for micro companies). On the other hand, equity finance plays a minor role as a source of finance for Brazilian companies.
The WBICS also gauged the credit constraint existing for Brazilian companies, asking entrepreneurs about access to bank loans. Such profile is summarized on Table II-2. The proportion of companies that do not have a bank loan is high even among large companies (companies with more than 500 employees). The proportion of companies that have a bank loan increases with size, ranging from 27.1% for micro companies to 58.9% for large companies. For those companies who do not have a bank loan, the vast majority did not even apply for it. The proportion of those who applied and were rejected is larger for small companies.
Table II-2
Access to Credit and Credit Constraints
Constrained companies correspond to (i) companies that did not apply even though they had demand for a Bank loan, and (ii) companies that had a loan application rejected. Other reasons include: application procedures, collateral requirements, interest rates, corruption, expectations of rejection.
Company Size
Micro Small Medium Large
Total no. of companies 329 860 374 73
Have a bank loan 27.1 31.9 43.9 58.9
Do not have a bank loan 72.9 68.1 56.1 41.1
Total 100 100 100 100
Do not have a loan
Rejected 12.9 10.2 8.6 6.7
Did not apply 87.1 89.8 91.4 93.3
Total 100 100 100 100
Did not apply
No need 39.2 44.5 51 53.6
Other reasons2 60.8 55.5 49 46.4
Total 100 100 100 100
Total of companies constrained 47.7 40.7 29.7 20.5
Application was rejected 9.4 7.0 4.8 2.7
Did not apply 38.3 33.7 24.9 17.8
III. THE CONSOLIDATION OF THE BRAZILIAN PRIVATE EQUITY AND VENTURE CAPITAL INDUSTRY
This section presents a quick overview on the Brazilian Private Equity and Venture Capital (PE/VC) industry. It relies on the 1st Census of Private Equity & Venture Capital in Brazil © database, which was made available by Fundação Getúlio Vargas’ PE/VC
Research Center (GVcepe). The database contains information on the structure, investment cycle, governance and remuneration of the universe of 71 firms that have offices in Brazil3 and manage PE/VC, Mezzanine and PIPE investments.
In December, 2004, the Brazilian PE/VC industry included 71 PE/VC managing firms, with a total of 97 investment vehicles, including six firms dedicated to Private Investments in Public Equity (PIPE). The total amount of commitments to Brazil was US$ 5.58 billion. Commitments rose significantly between 1999 and 2000 (from US$3.71 to US$4.95 billion). Between 2000 and 2004 the amount remained relatively stable, at close to US$5 billion.
Chart 1 reveals fundraising activity between 2000 and 2004. It shows the amount raised each year and the number of vehicles that received commitments in the same year. Figures range between US$230.00 million and US$1,258 million, while the number of fundraising vehicles ranges from 14 to 28. This indicates that fundraising activity is highly volatile. Throughout 2000, there was a significant (US$1.26 billion) increase to funds committed to Brazil. This amount was raised by 19 investment vehicles, and almost entirely by 18 typical PE/VC vehicles. On the other hand, 2003 was a meager year: 14 vehicles raised a mere US$230.00 million. Amounts raised between 2001 and 2003 were modest and averaged US$274.50 million/year. In 2004, activity resumed, with US$762.00 million raised.
While funds raised by PIPE vehicles represented less than 10% between 2000 and 2002, they grew to 30% and 40% in 2003 and 2004, respectively. The good fundraising performance in 2004 may have been influenced by several exits that took place in the stock exchanges. Six out of the eight IPOs that took place in BOVESPA in 2004 were PE/VC backed.4
3 For a complete analysis of the PE/VC industry, readers can refer to the book: Carvalho, Antonio G., Ribeiro,
Leonardo L. and Furtado, Cláudio V. 1st Census of Private Equity and Venture Capital in Brazil. FGV
Editors, Rio de Janeiro, 2006. Information available at www.cepe.fgvsp.br/english.
4 Natura, Gol, ALL, DASA, CPFL, TAM, Grendene and Porto Seguro. Natura received investments from
Chart 1
PE/VC Fundraising in Brazil
The bars depict the total amount raised annually by new and existing PE/VC and PIPE. The line shows the number of vehicles that were accepting new commitments each year. The figures include the full commitments of Latin American vehicles that did not have a diversification policy limiting the amount invested in a given country (i.e. Brazil).
Funds raised (US$ MI) number of fundraising vehicles Copyright © Censo Brasileiro de PE/VC
Chart 2 shows investments made by managing organizations between 1999 and 2004. On average, only about 30 organizations were actively investing each year. Total invested amount ranges from US$555 to 370 million.
A clearer picture of the industry’s investments arises when we separate PIPE organizations from typical PE/VC ones. The amount invested by typical organizations drops consistently throughout the period, from US$ 456 to US$ 253 million, while PIPEs’ investments rise, with a twofold increase in 1999-2004, from US$ 99 to US$ 199 million.
1258
323 270
230
762 16
24
14
28
19
2000 2001 2002 2003 2004
Chart 2
Investment Activity Investments made annually and number of managing firms responsible for them.
Invested Capital Number of Firms Responsible for the Investments
Copyright © Censo Brasileiro de PE/VC
As a result of PE/VC investments, in December of 2004, 82 out of the 97 PE/VC vehicles5 had an aggregated portfolio of 306 different firms (or 306 invested firms).6 Out of
the remaining vehicles, 14 had not yet begun their investment cycles and only one did not report this information. Because some invested firms received capital from more than one PE/VC vehicle, these 306 firms comprise a total of 357 deals.7 Table III-1 describes the data and reveals that 264 firms have only one PE/VC shareholder, while a syndicate of PE/VC investors financed 42.
5 Figure includes PIPEs.
6 To prevent double counting, managers were asked at a section of the questionnaire to provide information
on firms where they acted as independent investors or leading joint investors.
7 The number of deals per vehicle is the number of firms in which the vehicle made capital injections. As the
number of co-investments in a single company is other than 0, the aggregate number of portfolio firms is different from the aggregate number of deals.
555
485
385 370 402
452
30 32 34 32 31
20
1999 2000 2001 2002 2003 2004
Table III-1
PE/VC Deals in the Industry’s Portfolio
Deals in portfolio as December, 2004, classified as syndications and independent investments. Sixteen vehicles, managed by 15 managing organizations, were not considered because they did not have firms in their portfolios.
Investment type Number of
Deals Percentage
Independent investment 264 73.9
Syndication in which managing firm acted
as the leading co-investor 42 11.8
Syndication in which managing firm acted
as co-investor 51 14.3
Total 357 100.0
Copyright © Censo Brasileiro de PE/VC
Table 2 shows how these invested firms are geographically distributed (since the census did not ask the amount invested in each firm, the distribution is merely numerical). Unsurprisingly, the Southeast congregates most portfolio firms, with 64% of the total, followed by the South, with 27%, Northeast, with 5% and Central-West, with 3%. Only one investment has been made in the North.
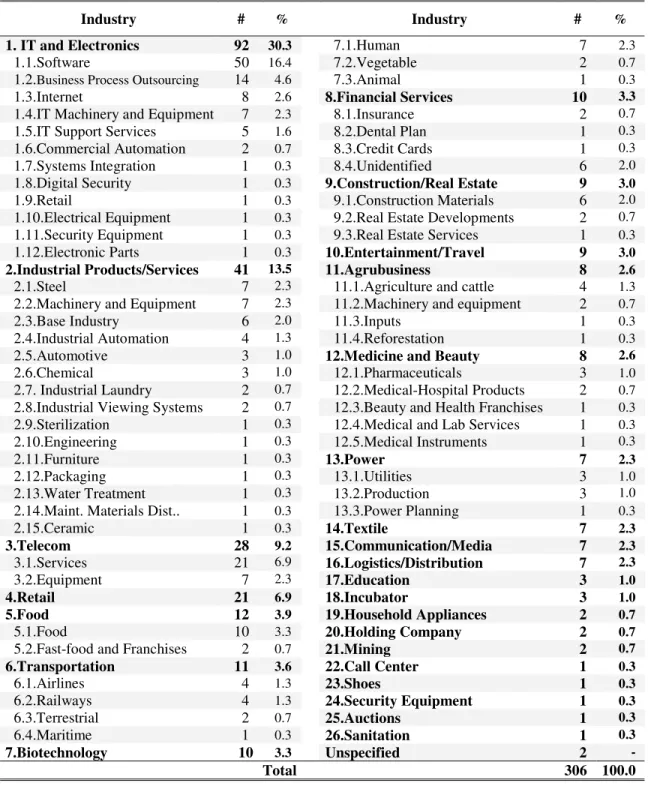
The portfolio is diversified across many industries. Table III-2 shows this distribution. As in other countries, technology industries comprise the majority of the portfolio: IT and Electronics (30% of the total number of firms), Telecom (9%), Biotech (3%), Medicine and Beauty (2%), etc. Still, there are also investments in less technology-intensive industries such as: Industrial Products and Services (13%), Retail (7%), Food (4%), Entertainment and Travel (4%), Transportation (3%), Textile (3%), Construction and Real Estate (3%), to name a few.
Table III-2
Portfolio Companies and Economic Sectors
Portfolio firms according to their principal economic sector as December, 2004. For firms operating in more than one sector, only the main sector was considered.
Industry # % Industry # %
1. IT and Electronics 92 30.3 7.1.Human 7 2.3
1.1.Software 50 16.4 7.2.Vegetable 2 0.7
1.2.Business Process Outsourcing 14 4.6 7.3.Animal 1 0.3
1.3.Internet 8 2.6 8.Financial Services 10 3.3 1.4.IT Machinery and Equipment 7 2.3 8.1.Insurance 2 0.7
1.5.IT Support Services 5 1.6 8.2.Dental Plan 1 0.3
1.6.Commercial Automation 2 0.7 8.3.Credit Cards 1 0.3
1.7.Systems Integration 1 0.3 8.4.Unidentified 6 2.0
1.8.Digital Security 1 0.3 9.Construction/Real Estate 9 3.0 1.9.Retail 1 0.3 9.1.Construction Materials 6 2.0
1.10.Electrical Equipment 1 0.3 9.2.Real Estate Developments 2 0.7
1.11.Security Equipment 1 0.3 9.3.Real Estate Services 1 0.3
1.12.Electronic Parts 1 0.3 10.Entertainment/Travel 9 3.0
2.Industrial Products/Services 41 13.5 11.Agrubusiness 8 2.6 2.1.Steel 7 2.3 11.1.Agriculture and cattle 4 1.3
2.2.Machinery and Equipment 7 2.3 11.2.Machinery and equipment 2 0.7
2.3.Base Industry 6 2.0 11.3.Inputs 1 0.3
2.4.Industrial Automation 4 1.3 11.4.Reforestation 1 0.3
2.5.Automotive 3 1.0 12.Medicine and Beauty 8 2.6 2.6.Chemical 3 1.0 12.1.Pharmaceuticals 3 1.0
2.7. Industrial Laundry 2 0.7 12.2.Medical-Hospital Products 2 0.7
2.8.Industrial Viewing Systems 2 0.7 12.3.Beauty and Health Franchises 1 0.3
2.9.Sterilization 1 0.3 12.4.Medical and Lab Services 1 0.3
2.10.Engineering 1 0.3 12.5.Medical Instruments 1 0.3
2.11.Furniture 1 0.3 13.Power 7 2.3
2.12.Packaging 1 0.3 13.1.Utilities 3 1.0
2.13.Water Treatment 1 0.3 13.2.Production 3 1.0
2.14.Maint. Materials Dist.. 1 0.3 13.3.Power Planning 1 0.3
2.15.Ceramic 1 0.3 14.Textile 7 2.3
3.Telecom 28 9.2 15.Communication/Media 7 2.3
3.1.Services 21 6.9 16.Logistics/Distribution 7 2.3
3.2.Equipment 7 2.3 17.Education 3 1.0
4.Retail 21 6.9 18.Incubator 3 1.0
5.Food 12 3.9 19.Household Appliances 2 0.7
5.1.Food 10 3.3 20.Holding Company 2 0.7
5.2.Fast-food and Franchises 2 0.7 21.Mining 2 0.7
6.Transportation 11 3.6 22.Call Center 1 0.3
6.1.Airlines 4 1.3 23.Shoes 1 0.3
6.2.Railways 4 1.3 24.Security Equipment 1 0.3
6.3.Terrestrial 2 0.7 25.Auctions 1 0.3
6.4.Maritime 1 0.3 26.Sanitation 1 0.3
7.Biotechnology 10 3.3 Unspecified 2 -
Total 306 100.0
Table III-3 shows the development stage at which firms received their first PE/VC investment. Two thirds of the aggregate portfolio can be considered as typical venture capital investments (204 out of 306 firms). Thirty-six (11.8%) of these are classified as seed capital while 74 (24.2%) are start-ups and 96 (31.4%) were aimed at the expansion of an existing business.
There are 102 (33.3%) typical Private Equity investments. Forty-two (13.7%) of these took place when the invested firm was at a later stage of its development. Other firm-maturity stages, such as acquisition finance, bridge finance, turnaround, mezzanine and management buy-out/buy-in comprise less than 10% of the number of investments. Finally, PIPEs (investment in publicly quoted firms) include 43 firms (14.1%).
Table III-3
Stages of Investments in Portfolio Firms
Distribution of the portfolio firms, in December, 2004, according to their stage at the time of the first investment. Stages are defined as follows: Seed capital: Small investment done at a pre-operational stage to develop an idea for a
project or to research markets and file patents. Start-up: Investment in a firm at during the first years of operations,
when it still does not market products/services. At this stage, firms are already hiring staff and have carried out all the studies required to implement their business plans. Expansion: Investment that is usually used as working capital for
the expansion of a firm that already markets its products/services. The financing may also be intended for the expansion of new and existing plants or the distribution network. Investments in marketing are also considered. Later stage: Firms at this stage have already reached relatively stable growth rates and positive cash flows. Acquisition Finance: Investment to finance the acquisition of a third firm. This category includes mezzanine, which combines debt and equity. Management buyout/in: Funding the acquisition of a company by a team of internal or external managers. Bridge finance: Investment to bring a company to the stock market within one year. May also include the restructuring of significant shareholders’ positions. Turnaround: Funding provided to a firm in operational and/or financial trouble. PIPE: Investment in low-liquidity shares of publicly traded firms.
Stage Number of
Firms Percentage
Venture Capital 204 66.7
Seed capital 36 11.8
Start-Up 72 23.5
Expansion 96 31.4
Private Equity 102 33.3
Later stage 42 13.7
Acquisition finance 5 1.6
Management buyout/in 3 1.0
Bridge finance 1 0.3
Turnaround 6 2.0
Mezzanine 2 0.6
PIPEs 43 14.1
The relatively low number of firms that received seed capital indicates that, despite the fact that there is some managerial experience in doing deals in this early stage of business development, there is still much room of gains from funding startups. In fact, there were virtually no investment vehicles exclusively dedicated to funding firms at this stage.
In Brazil, the government has taken steps to promote the creation and venture financing of SMEs. On the hand, there are 283 business incubators in Brazil (ANPROTEC, 2004). Most of the 2,114 incubated companies are technology driven. In fact, nearly 60% of the working area at those incubators is used by companies in the following sectors: IT and software (25%), Electric and Electronics (14%), Internet (11%), Biotech (5%) and Telecom (4%). Almost 3.000 companies have already left the incubation program (graduated) or still benefit of it indirectly (associated).
On the other hand, the government has started to invest in PE/VC vehicles as a
Limited Partner, specially in those vehicles directed to typical venture and seed deals.
Finally, Table II-4 shows the industry’s exit history. It is important to understand that the number of deals differs from the number of firms: firm with two PE/VC investors are treated as two deals. The years 2001 and 2002 experienced a large number of write-offs, quite possibly due to the investments generated by the large number of new commitments in 2000 (q.v. Chart 1). The year 2004 marks the beginning of the first IPO divestment cycle and may, therefore, be taken as the beginning of the industry’s mature stage, as it demonstrates the ability to carry out a complete PE/VC cycle in the image of more developed economies.
Table III-4 Exits
Number of exits performed annually by each exit route. Full exit means the sale of all shares pertaining to
the PE/VC vehicle or a complete liquidation of all assets of a given portfolio company. Where exit took place by means of several partial exits, the last transaction is regarded as a full exit and all prior ones as partial exits. IPO: initial public offering. Trade-sale means the sale of all the stock to one strategic buyer,
generally an industrial group interested in incorporating the firm either vertically or horizontally.
Secondary sale means the sale of the shares to another temporary investor. Buyback means the repurchase
of stock by the business owner or entrepreneur. Write-off/down means full liquidation of the firm’s asset
and implies termination of operations. Secondary market sale means the sale of publicly-traded stock.
Does not include PIPEs.
Year Exit Mechanism
1999 2000 2001 2002 2003 2004
Full Exits
- - - 2
IPO
- - - (6.5)
4 13 8 6 6 15
Trade-sale
(57.1) (39.4) (21.6) (24.0) (27.3) (48.4)
- 16 1 1 4 2
Secondary-sale
- (48.5) (27.0) (4.0) (18.2) (6.5)
3 1 8 3 9 8
Buyback
(42.9) (3.0) (21.6) (12.0) (40.9) (25.8)
- 3 20 15 3 4
Write-off/down
- (9.1) (54.1) (60.0) (13.6) (12.9)
Total 7 33 37 25 22 31
Partial Exits
- - - 7
IPO
- - - (63.6)
1 2 4 3 1 2
Secondary-sale
(100.0) (66.7) (66.6) (60.0) (50.0) (18.2)
- 1 2 2 1 2
Buyback/Amortization
- (33.3) (33.3) (40.0) (50.0) (18.2)
Total 1 3 6 5 2 11
GRAND TOTAL 8 36 43 30 24 42
Table III-5
Bovespa Listing: Issuers and PE/VC Investors
IPOs in the stock markets between 2004 and 2005. Natura received investment from the BNDESPar in the form of convertible debt. While TAM was already quoted in the stock exchanges, its free float was no more than 1%. Consequently, its 2004 stock issue may be seen as an IPO. Figures in parentheses indicate percentage of the total. Based on BOVESPA data and IPO prospectuses.
Year Firm Volume US$ M PE/VC Investors
Banco Nossa Caixa 419
Cosan 350
Energias do Brazil 354
Localiza 108 CSFB Private Equity
OHL Brazil 212
Renar Maçãs 6
Submarino 176 GP Invest.; Warburg Dillon; TH Lee Putnam; Santander; JP Morgan and Flatiron TAM 225 CSFB and Bassini, Playfair and Wright
2005
UOL 267 Latintech
Total 2005 2.117
Total PE/VC Invested Firms 776
ALL 189 GP Invest; CSFB; Electra and GEF
CPFL 287 Bradespar
DASA 158 Pátria; JP Morgan and Flatiron
Gol 283 AIG Capital Partners
Grendene 216
Natura 243 BNDESPar
2004
Porto Seguro 136 -
Total 2004 1.512
Total PE/VC Invested Firms 1.160
Copyright © Censo Brasileiro de PE/VC
IV. THEORGANIZATIONANDSUSTAINABILITYOFTHEBRAZILIANPE/VC INDUSTRY
IV.1 THE PLAYERS IN THE PE/VCINDUSTRY IN BRAZIL
IV.1.1 MANAGING ORGANIZATIONS
IV.1.1.1ROOTS AND CONFIGURATION
As seen in Table IV-1, both numerically and in terms of committed capital, the industry is mostly made up of independent organizations or captives of financial institutions. Table IV-1 also shows that the Government plays a role as a direct PE/VC, which is relatively limited since BNDESPar’s commitments amount to under 3% of the industry’s capital. However, as will be discussed further, the number of firms in BNDESPar’s portfolio by December, 2004, was more than 10% of the industry’s aggregate portfolio firms. It is also noteworthy that the public sector plays a significant role as an investor (LP) in several investment vehicles.
Table IV-1
Managing Firms’ Affiliation
Distribution of managing firms with offices in Brazil by affiliation and committed capital amount in December, 2004. Figures in parentheses stand for percentage of the total. Figures reported in Reais were converted into U.S. Dollars at the World Bank’s average annual rate. Does not include commitments of three small-sized vehicles/organizations that did not provide these data.
Affiliation organizations Number of Commitments in US$ billion
45 2.99
Independent organizations
(63.4) (53.4)
20 2.11
Captives of financial institutions
(28.2) (37.9)
4 0.33
Industrial concerns (Corporate ventures)
(5.6) (6.0)
2 0.15
Public sector
(2.8) (2.7)
71 5.58
Total
(100.0) (100.0)
The overwhelming majority of PE/VC managing firms that have offices in Brazil — both numerically and in terms of committed capital — are domestic. The 53 domestic organizations (75%) manage US$3.54 bi (63% of committed capital). The United States appear as the second most frequently mentioned source of funds: 10 organizations (14%), managing US$1.76 bi (32% of committed capital). Therefore, Brazil and the United States are the sources of funds for organizations that answer for 95% of all the PE/VC committed capital in Brazil.
Chart 3 depicts the early history of managing firms’ operations. This analysis is imperfect, as it omits institutions that terminated operations before the survey. However, it provides a good historic view of the formation of Brazil’s PE/VC. Note that: a) PE/VC activity in Brazil dates back to the early 1980s — long before the American PE/VC model became an international standard; b) the PE/VC cycle in Brazil starts in earnest after the mid-1990s and picks up momentum after the country’s economic stabilization, begun in 1994; c) entry of organizations was interrupted in 1998, probably due to anticipation of the foreign-exchange regime changes i.e. devaluation in early 1999 and the Russian crisis of 1998; d) the great expansion experienced 1999-2001 is substantially related to cheaper domestic assets in U.S. Dollar terms and to the New Economy’s speculative bubble. The expansion period climaxed in 2000, when 14 organizations entered the market; e) Since 2002, the entry rate has been stable, with about four new managing firms per year.
Chart 3
Start of Activities in Brazil
Distribution of managing firms with offices in Brazil by year when they commenced operations in Brazil. Does not include organizations that were terminated or left the country before December, 2004.
Copyright © Censo Brasileiro de PE/VC
and one was undecided, while the other eight stated that they intended to resume activities in the future. The 55 active organizations answer for about 78% of committed capital. Adding the eight inactive organizations that plan to resume activities, we conclude that 63 out of 71 organizations present in 2004 (responsible for 89% of committed capital) intend to remain in the industry. This low (11%) abandonment rate suggests that the industry remains attractive for investment.
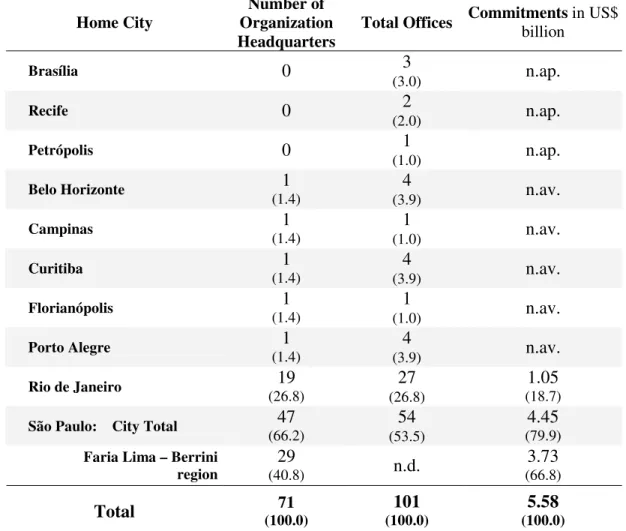
The 71 PE/VC managing firms present in Brazil have offices in ten cities, as depicted in the following table (Table IV-2). Organizational headquarters are significantly concentrated in São Paulo: 47 organizations (66%), with US$4.45 billion in commitments (80% of total commitments). This suggests the establishment of a PE/VC cluster. An even clearer indication of concentration is the fact that the region comprised by avenues Faria Lima and Berrini houses 29 managing organizations, with US$3.73 billion in commitments (67% of committed capital). Rio de Janeiro is the second most important center, with 19 organizations (27%) and 19% of the committed capital.
Table IV-2
Geographic Presence of PE/VC Management Firms
Regional distribution of PE/VC managing firms’ offices and committed capital amounts by year-end, 2004. Figures in parentheses are percentages of the total. Amounts reported in Reais were converted into U.S. Dollars at the World Bank’s average annual rate. Some figures were omitted to prevent identification of confidential information (n.av. means not available, n.ap. means not applicable). Total committed capital includes
undisclosed amounts. Total offices includes headquarters and secondary offices. Firms with ZIP codes beginning with 045 or 0145 have been grouped into the region comprised by avenues Faria Lima and Berrini. ZIP codes beginning with 013 belong to the Av. Paulista region. Due to its structure BNDESPar was treated as two distinct organizations. Companies with separate PE/VC and PIPE departments were also counted twice. Does not include commitments of three small-sized vehicles/organizations that did not provide these data.
Home City
Number of Organization Headquarters
Total Offices Commitments billion in US$
3
Brasília 0
(3.0) n.ap. 2
Recife 0
(2.0) n.ap. 1
Petrópolis 0
(1.0) n.ap.
1 4
Belo Horizonte
(1.4) (3.9) n.av.
1 1
Campinas
(1.4) (1.0) n.av.
1 4
Curitiba
(1.4) (3.9) n.av.
1 1
Florianópolis
(1.4) (1.0) n.av.
1 4
Porto Alegre
(1.4) (3.9) n.av.
19 27 1.05
Rio de Janeiro
(26.8) (26.8) (18.7)
47 54 4.45
São Paulo: City Total
(66.2) (53.5) (79.9)
29 3.73
Faria Lima – Berrini
region (40.8) n.d. (66.8)
71 101 5.58
Total (100.0) (100.0) (100.0)
Copyright © Censo Brasileiro de PE/VC
Table IV-3
Capital Concentration across Managing Firms
Managing firms grouped by size as measured by committed capital amounts by year-end, 2004. Amounts in parentheses are percentages of the industry’s total commitment. Amounts reported in Reais were converted into U.S. Dollars at the World Bank’s average annual rate.
Organization groups
by size Commitments US$ billion in
Average Commitment
in US$ million
2.56
5 largest
(45.9) 513
3.61
10 largest
(64.7) 361
4.25
15 largest
(76.2) 283
1.33
Remaining 55
(23.8) 26
5.58 Total
(100.0) 85
Copyright © Censo Brasileiro de PE/VC
IV.1.1.2HUMAN RESOURCES AT MANAGING ORGANIZATIONS
The PE/VC industry is notoriously modest in terms of the number of practitioners employed directly by managing organizations. In December, 2004, the 71 managing firms had 498 employees, 233 of which were in managing positions and 265 acted as a supporting staff. Managers are those with decision-making power in at least one stage of the PE/VC cycle (fundraising, deal origination, monitoring, exiting, etc.). Support staff includes analysts, controllers, interns, assistants, etc., operating under management oversight. The industry’s parsimony is clearly indicated by the fact that there is, on average, less than one staff employee per manager.
PE/VC managers are highly skilled and experienced. Approximately 3.5% have PhDs degrees. Those with master’s, MBA or LLM1 degrees add up to 55%. A total of over 73% have at least some post-graduate work.
As regards their professional background, Table III-4 shows that a large share of managers (36%) come from the financial industry. On the other hand, executives from non-financial companies, whose experience is usually more consistent with the preparation and implementation of business strategies (CEOs, entrepreneurs, consultants and business angels), are more than half the total number of managers. Only 9.5% come from other fields (civil servants, academics, lawyers, etc.).
Based on interviews with managers and a survey of their résumés (usually available from managing organizations’ websites), all those that stated that their most relevant prior experience was in government either are or have been with BNDES. Seven of these were then employed at six organizations other than BNDESPar itself. There was an apparent positive externality from the actions of BNDES, producing managers for private-sector PE/VC organizations.
The fact that lawyers are a minor share of the manager population reinforces the perception that managing organizations prefer to retain the services of specialized firms over internalizing activities such as agreement preparation, due-diligence procedures, litigation, etc.
Table IV-4
Managers’ Professional Background
Distribution of managers by previous experience most relevant to their current PE/VC activities.
Previous Experience Number of
Managers
Valid Percentage
Financial Industry / Auditor 83 36.4
CEO / non-financial area Office 47 20.6
Consultant 44 19.3
Entrepreneur 29 12.7
Government 16 7.0
Lawyer 5 2.2
Business Angel 2 0.9
Academia 2 0.9
Unspecified 5 -
Total 233 100.0
Copyright © Censo Brasileiro de PE/VC
1LLM, from the Latin
Although there are managers with sound experience in the area (9% of managers have more than 17 years’ experience in the industry), most (74%) have been in the industry for less than 8 years. This reflects the great cycle of entries and growth the PE/VC industry experienced in the 1990s. Interviews revealed that some managers have amassed PE/VC experience abroad and others included their experience as angel investors. As a consequence, the experience managers have had may not be directly correlated with the entry of managing organizations into the Brazilian PE/VC market.
IV.1.2 INVESTMENT VEHICLES
PE/VC managing organizations’ activities consist in managing one or more investment vehicles. These vehicles can be structured in various ways. In December, 2004, the 71 managing organizations present in Brazil were responsible for a total of 101 investment vehicles. We were able to get information on almost all of them: 97 vehicles.2
Until 1994, holding companies were the most appropriate vehicles for typical PE/VC investments in Brazil. Under Brazilian law, holding companies may exercise management powers, be it by appointing managers or by taking part in the controlled firms’ governing bodies (board of administration, audit committee, etc.). On the other hand, when they invest through a holding company, PE/VC investors become shareholders and, therefore, are subject to the laws and regulations applicable to corporations. As a result, the classic divide between investors and managers, with the latter’s clearly fiduciary role, is absent. As PE/VC vehicles, holding companies have some shortcomings when compared with LPs, including: 1) taxes on capital gains realized with investment write-offs are owed by the holding company itself, which means that all investors pay at the same tax rate: 34%; 2) they are not established for a limited period of time; 3) they have trouble appropriating tax credits; and 4) they must be publicly traded companies in order to receive investments from foreign investors, with the ensuing costs of a public corporation.
Due to the lack of appropriate vehicles for PE/VC investments in Brazil, the Comissão de Valores Mobiliários (CVM), who regulate the Brazilian stock market, put in place structures closer to LPs through Instruction CVM 209 of 1994 (which created the
FMIEE — Fundos Mútuos de Investimentos em Empresas Emergentes) and Instruction
CVM 391 of 2003 (which created the FIP — Fundos de Investimento em Participações).
they permit differentiated taxation for quota holders: all the gains produced by the funds are accounted for as capital gains, and taxes are levied when the investors redeem their quotas and pay the taxes owed for their share, at the applicable tax rate. Furthermore, in the event of reinvestment, the taxes are automatically postponed; 3) they can be set up for limited periods of time; 4) they are more flexible as regards tax credit appropriations; 5) it is easier for them to collect management fees; and 6) they benefit from a simples process when the time comes to liquidate investments. Their main disadvantage lies in the required managerial transparency, which is often undesirable (for example, by being forced to disclose information the managers deem strategic).
An FMIEE (CVM 209) is managed by a natural or legal entity with CVM clearance to manage securities portfolios. Fund management and governance are determined by each fund’s peculiar regulations, as approved by simple majority at quota holders’ meeting with one vote per quota. FMIEE life spans are limited to a period of ten years, and may be extended once for another five years. Unlike as limited partnerships in the U.S., FMIEE quotas, once paid in, can be admitted into stock exchange or OTC trades upon CVM approval. The number of investors is limited to 35 at most. Each investor must underwrite an amount not under R$400 thousand.
An FMIEE’s investing policy must be formally established by regulation and meet certain minimum CVM requirements such as: 1) investments must be in securities (shares, debentures, warrants) issued by an entity set up as a corporation; 2) target firms must have annual sales under R$100 million, must not be members of corporate groups with consolidated equity in excess of R$200 million, and their partners and managers must not include fund managers with a stake in excess of 10% of the capital stock.
Instruction CVM 391, which created fundos de investmentos em participações (FIP)
is another significant landmark for the PE/VC industry in Brazil. As compared to FMIEEs, FIPs: 1) remove the constraints as regards the size of invested firms, which can also be either close or publicly traded; 2) regulate managers’ involvement in invested firms’ decision-making process; 3) adopt a fund governance model that incorporates investment and technical committees and consultative boards; 4) regulate investment and divestment decision-making processes; 5) require transparency towards quotaholders; and 6) mandate that investment- and quota-valuation accounting rules be set under fund regulations. Contractual freedom for the parties (managers and quotaholders) and automatic registration of FIPs with CVM lend undeniable flexibility to this new PE/VC investment vehicle in Brazil.
PE/VC managers may also establish investment vehicles under the terms of
include fundos de ações (“stock funds”) used as PE/VC vehicles. These funds must have
67% of their portfolios in securities tradable in stock exchanges or OTC (particularly well-suited for PIPE and mezzanine investments). Investing decisions follow the guidelines of a policy set by quotaholders’ meeting, and the manager is charged with executing deals in securities on behalf of the fund. According to CVM 409, funds may be either close or open, and, in the latter case, are intended only for eligible investors and must file their quotas with the CVM in advance. Instruction CVM 409 also stated that funds established under
CVM 302 had until December 31st, 2004, to comply with the new regulation (CVM 409). As the survey took place in late 2004, some vehicles were still structured according to the terms of CVM 302.
Table IV-5 groups vehicles by legal structure. Note that LPs have a relatively important weight in the industry. Although they are only 29 out of 97 vehicles (30%), they concentrate 62% of the entire committed capital in Brazil. On the other hand, holding companies, albeit relatively numerous, answer for less than 10% of the capital. Out of the 20 existing holding companies only two are traded in stock exchanges.3
Funds established under CVM instructions are the most frequently found: they comprehend 44 vehicles and US$1.29 billion (23.1% of the industry’s total commitment). Twenty-one are FMIEEs, with US$170 million in commitments (3% of the capital); 11 are FIPs with US$620 million in commitments (11.2% of the capital) and 12 are vehicles set up under Instructions CVM 302 and 409, with US$500 million in commitments (8.9% of the
capital). Only two CVM funds are traded in stock exchanges.4
PIPE vehicles are aligned with the instructions CVM. Out of six existing PIPEs,
Table IV-5
Investment Vehicles’ Legal Structure
Distribution of investment vehicles according to legal structure of choice. Figures in parentheses are percentages of the total. Amounts reported in Reais were converted into U.S. Dollars at the World Bank’s average annual rate.
Legal Structure Number of
vehicles
Commitments in US$ billion
29 3.45
Limited Partnership
(29.9) (61.9)
21 0.17
FMIEE (CVM 209)
(21.6) (3.0)
11 0.62
FIP (CVM 391)
(11.3) (11.2)
12 0.50
CVM 302 and 409
(12.4) (8.9)
20 0.52
Holding companya
(20.6) (9.4)
2 0.31
Non-financial company division
(2.1) (5.5)
2 0.01
Other
(2.1) (0.1)
97 5.58
Total
(100.0) (100.0)
Copyright © Censo Brasileiro de PE/VC IV.1.3 FUNDS INVESTORS
Given their low liquidity, high risk and high expected return, PE/VC vehicles are particularly appealing to investors with great wealth and a lengthy investment horizon — wealthy individual investors, institutional investors (insurance companies and pension funds), trusts and endowments, corporations, bank holdings, multilateral institutions, etc. Given the importance of PE/VC for creating firms, generating jobs and investing in technology and innovation, several countries have been regarding PE/VC as a means to leverage economic growth. As a result, PE/VC investors often include development agencies, multilateral institutions, state-owned banks, etc.
Upon analysis of the roll of investors, certain details are noteworthy: 1) only 37 vehicles include capital injections from their managers. As there are 45 managing organizations, some managers have not invested in their own vehicles; 2) Public sector funds amount to only 7.2% of commitments, but are spread across 27 vehicles. This denotes the public sector’s concern with fostering the PE/VC industry; and 3) there is also little investment from official institutions, at 3% diluted among 19 vehicles, which also shows their concern with encouraging the PE/VC industry.
Table III-6 categorizes the sources of funds as domestic or international. Note, first, that more than 50% of the committed capital in the Brazilian PE/VC industry comes from foreign sources: out of US$4.29 billion with determined sources, US$2.54 billion (62%) belong to international investors.
Among domestic investors, the most important are institutional, mother
organizations, public sector, partners at organizations and individuals not related to the organization.
Table IV-6
PE/VC Investors, Categorized
Distribution of committed capital by year-end, 2004, by investor class. Amounts reported in Reais were converted into U.S. Dollars at the World Bank’s average annual rate. Number of vehicles means the number of vehicles with at
least one investor in this class. International official institutions mean multilateral institutions and foreign government
institutions. Other includes investor classes with aggregate commitments under US$60 million: domestic banks,
domestic privately-owned firms, domestic PE/VC managing organizations, domestic pension funds, NGOs and holding companies.
Class Number of
Vehicles
Commitments in US$
billion Percentage Valid
Institutional investors 39 0.96 22.4
Mother organizations 23 0.61 14.2
Individuals not related to the organization 33 0.41 9.6
Trusts and endowments 7 0.35 8.2
International investment funds 12 0.34 7.9
Government and state-owned companies 27 0.31 7.2
International PE/VC organizations 8 0.28 6.5
International banks 15 0.26 6.1
International privately-owned companies 14 0.23 5.4
Managing organization partners 37 0.19 4.4
International official institutions 19 0.13 3.0
Other - 0.22 5.1
Unreported - 1.29 -
The main international investors include: trusts and endowments, investment funds,
institutional investors, PE/VC organizations, individuals not related to the organization, banks, privately-owned companies, mother organizations, official institutions and partners at organizations.
Table IV-7
PE/VC Investors by Class and Nationality
Distribution of committed capital by year-end, 2004, by investor class and nationality. Amounts reported in Reais were converted into U.S. Dollars at the World Bank’s average annual rate. Number of vehicles means the number of vehicles with at least one investor in this class. Other includes: domestic banks, domestic privately-owned
companies and domestic PE/VC managing organizations.
Class Number of
Vehicles
Commitments in
US$ billion Percentage Valid
Domestic
Institutional investors 26 0.63 36.0
Mother organizations 13 0.40 22.9
Government and state-owned companies 27 0.31 17.7
Individuals not related to the organization 22 0.14 8.0
Organization partners 29 0.10 5.7
Other - 0.17 9.7
Total, domestic 1.75 100.0
International
Trusts and endowments 6 0.35 13.8
Investment funds 9 0.34 13.4
Institutional investors 14 0.33 13.0
PE/VC organizations 8 0.28 11.0
Individuals not related to the organization 12 0.27 10.6
Banks 15 0.26 10.2
Privately-owned companies 14 0.23 9.1
Mother organizations 11 0.21 8.3
Official institutions 20 0.13 5.1
Organization partners 10 0.09 3.5
Other - 0.05 2.0
Total, international - 2.54 100.0
Unreported 1.29
GRAND TOTAL 5.58
IV.2 THE CYCLE OF PE/VC IN BRAZIL
IV.2.1 INVESTMENT ORIGINATION AND SELECTION
Once fundraising is complete, the investment origination and selection process begins. Three means are used to this end: prospecting by the managers themselves, third party appointments and spontaneous candidacy (investment proposals entrepreneurs submit directly to managers). Table 2.19 provides the aggregate number of proposals received5 in 2004, as well as details on the investment selection process (proposal analysis, due diligence, investment). In all, 3,598 proposals were received and 840 (23%) were analyzed.
Only 140 (17% of those analyzed) moved on to the due diligence stage. Finally, 35 out of these 140 became investments (25% of those that underwent due diligence). These 35 investments divide into six deals from spontaneous candidacies, 16 third party appointments and 13 manager prospects. Table III-8 confirms the PE/VC industry’s notorious estimate that, out of 100 projects received by managers, only one gets PE/VC injection. These figures show that the selection process is quite strict in Brazil and that considerable funds and resources go into selecting investments in PE/VC assets.
Table IV-8
Project Selection: Number of Proposals and Approval Rate, by Stage Number of proposals (e.g. business plans) received, number of proposals thoroughly analyzed, number of proposals undergoing due diligence and number of investments done in 2004 for which information is available
on the means of submission. Figures in parentheses are percentages of proposals that moved from one stage to the next. Does not include PIPE deals or managers that did not pursue investments (inactive). Disregards deals that involved cross investment by a manager in another organization with transfer of portfolio firms from the former to the latter. One organization that carried out analyses for another to invest was excluded to prevent double counting.
Stage 1 2 3 4
Means of Submission
Proposals received
Proposals
analyzed Due Diligences
Investments Made
2,297 353 29 6
Spontaneous
(15.4) (8.2) (20.7)
1,301 310 78 16
Referrals
(23.8) (25.2) (20.5)
177 33 13
Prospecting
(18.6) (39.4)
3,598 840 140 35
Total
(28.3) (16.7) (25.0)
Copyright © Censo Brasileiro de PE/VC
There is an even clearer difference when measured by the share of projects that make it to due diligence. Out of 353 spontaneous candidacy projects that were analyzed, only 29 (8.2%) moved on to due diligence. Out of 310 referrals analyzed, 78 (25.2%)
underwent due diligence. Also in 2004, 177 investment opportunities were detected by
manager prospecting; 33 of these (18.6%) moved on to due diligence.
IV.2.2 INVESTMENT STRUCTURING
preventing them from going to work for competitors or establishing a competing firm for a certain period of time. The main purpose of this last clause is to prevent competitors from using strategic information.
For almost 90% of managing organizations, the presence of a shareholder agreement is a requirement for investment. Respondents are so firm about this that 77% agreed in full with the affirmative, and a mere 7% disagreed. (Table IV-9)
PE/VC practitioners in Brazil also feel strongly about preventing competitors from using strategic information: 82% of respondents agreed with the statement “in order for us to invest, it is essential that the firm’s main executives agree to non-competition clauses”.
More than half (55%) fully agreed with the statement. Only 5% disagreed.
Opposite to what one might expect, acquiring control is not a fundamental point for the most PE/VC practitioners in Brazil. Only 28% of respondents agreed with the statement “in order for us to invest, it is essential that we have the ability to acquire control” (only
9% agree in full). Disagreement is far stronger (49%), and 41% fully disagree.
Table IV-9
Investment Structure Conditions (percentage)
Only the 56 organizations that responded to the statements were considered. PIPEs not included. All figures are percentages.
Statement disagree Fully Partially disagree Neutral Partially agree Fully agree
We do not invest ...
... in the absence of a previous agreement over the basic terms and conditions of the shareholders’ agreement
3.6 3.6 3.6 12.5 76.8
For us to invest, it is essential that...
... the firm’s main executives agree
to non-competing clauses 3.6 1.8 12.5 26.8 55.4 ... we have the ability to acquire
control 41.1 7.1 23.2 19.6 8.9
Copyright © Censo Brasileiro de PE/VC
The level of investment vehicles’ ownership of firms in their portfolios enables a more in-depth assessment of the control topic. Ownership level was divided into five