FUNDAÇÃO GETULIO VARGAS
ESCOLA DE ADMINISTRAÇÃO DE EMPRESAS DE SÃO PAULO
GPPlab – Laboratório de Gestão e Políticas Públicas
REFORMA GERENCIAL 20 + 20
Os 20 anos da reforma Bresser e os desafios para o futuro.
Tema/ Artigo Autor
Introdução Cibele Franzese
Importancia de la gestion pública para la democracia de
América Latina y el Caribe Maria Fernanda Trigo
A agenda federal para a gestão pública no período 1995-2015 Fernando Luiz Abrucio
O choque de gestão no Estado de Minas Gerais Alketa Peci
A experiência das Organizações Sociais nos governos locais Cibele Franzese
Implementação das Organizações Sociais Humberto Falcão Martins
A experiência das Organizações Sociais no município do Rio de Janeiro
Flavio Alcoforado
Contratualização de resultados e desempenho no setor público: a experiência do Contrato Programa
Priscilla Perdicaris
Improving performance from the Center of Government: the management model of Pernambuco, Brazil
Mariano Lafuente
A importância das experiências de Minas Gerais e Pernambuco Regina Pacheco Gestão por Resultados: experiências e desafios em municípios
brasileiros
Priscilla Perdicaris e Cassiane Jaroszewski
Gestão da qualidade da educação no Brasil: a agenda esquecida Carolina Nogueira Dias
O Sistema de alta direção no Chile Daniel Barros
Gestão para Resultados em Niterói Marilia Ortiz
IMPORTANCIA DE LA GESTION PÚBLICA PARA LA DEMOCRACIA DE AMÉRICA LATINA Y EL CARIBE
Maria Fernanda Trigo1
I. Resumen ejecutivo
Los ciudadanos hoy en día están más y mejor informados y son mucho más exigentes en cuanto al funcionamiento de las instituciones públicas, tienen expectativas más altas de sus gobiernos y demandan la provisión de servicios de calidad de manera transparente, efectiva y oportuna. Por esta razón, uno de los mayores desafíos que enfrentan los gobiernos de la región es la falta de confianza de los ciudadanos en las instituciones públicas. Es por eso que la gestión pública efectiva representa una necesidad imperativa para abordar el desafío mencionado. En este contexto, el concepto de gobierno abierto llega en buena hora para atender estas demandas ciudadanas. Con el objetivo de profundizar la democracia en las Américas, la OEA, a través de distintos programas, promueve los principios de gobierno abierto para que las instituciones públicas de la región sean cada vez más transparentes, efectivas y cuenten con mecanismos de participación ciudadana.
II. Introducción
La gestion publica efectiva es un elemento esencial para el fortalecimiento de la democracia en la región tal como se reconoce en la Carta Democrática Interamericana de la OEA firmada el 9 de septiembre de 2001 en Lima, Peru por todos los representantes de los Estados miembros de la OEA. En esta Carta se señala que “son componentes fundamentales del ejercicio de la democracia la transparencia de las actividades gubernamentales, la probidad, la responsabilidad de los gobiernos en la gestion publica, el respeto por los derechos sociales y la libertad de expresión y de prensa.”2
1 Directora del Departamento para la Gestion Publica Efectiva - Organización de los Estados Americanos (OEA)
La democracia electoral se ha afianzado en nuestro hemisferio en estas últimas décadas. Hoy en día vemos que prácticamente todos los países de la región cuentan con elecciones libres, justas y periódicas. América es un continente donde se ha instalado la democracia como sistema de gobierno. La celebración periódica de elecciones es el medio a través del cual se expresa y legitima la voluntad popular. Este mecanismo democrático se ha afianzado como el único medio legítimo de acceso al poder.
Hemos tenido importantes avances también en el campo económico y social, con economías que han crecido a tasas importantes gracias a los precios de las materias primas y programas sociales que se han instalado en nuestros países y que han contribuido a dinamizar las economías en la región a principios del siglo XXI. Asimismo, estos avances han tenido impacto en las demandas y expectativas ciudadanas en la última década.
Por otra parte, hubo una reducción de la pobreza importante de 15.8% del 2002 al 2012.3 También hubo progreso en la reducción de la desigualdad, que, entre 2002 y 2013 cayó aproximadamente 10%. Sin embargo, las Américas sigue siendo el continente de mayor desigualdad en el mundo, pero el avance ha sido importante. Nunca en la historia reciente de la región ha existido una red tan robusta de protección social y economías tan integradas al mercado mundial.
La prosperidad económica de los últimos años, las reformas estructurales y la implementación de los programas sociales orientados a combatir la pobreza y expandir los derechos a todos los ciudadanos y ciudadanas han contribuido al surgimiento de una clase media empoderada. Según el Banco Mundial, durante la última década más de 50 millones de ciudadanos y ciudadanas en la región entraron a la clase media. En 2010, 150 millones conformaban la clase media en América Latina y el Caribe, lo que equivale a un 35% de la población en la región – un verdadero logro considerando que dicho porcentaje históricamente no rebasaba el 20%. Esto significa un segmento de la sociedad con acceso a servicios y oportunidades que han contribuido a mejorar su calidad de vida y que hoy exige al aparato estatal, con voz y voto, ya sea en las
3
calles, en las redes sociales o a través de interacción directa con sus gobernantes electos, mantener y mejorar su calidad de vida.
Por otra parte, el acceso de los ciudadanos a las tecnologías de la información y la comunicación (TICs), a través de los teléfonos móviles y el internet, ha hecho que esta población sea mucho más activa hoy. Según el informe de Latinobarometro de 2013, 85% de los sudamericanos y 84% de los centroamericanos contaban ya con teléfonos móviles; y según el informe de Internet World Statistics, en 2015, 53.9% de la población de América Latina y el Caribe tiene acceso al internet. Estos datos muestran la integración masiva de la tecnología a la vida cotidiana de los ciudadanos en nuestra región.
Además contamos con ciudadanos críticos, empoderados, que manifiestan su descontento en las calles y a través de los medios sociales. Lo hemos visto en las protestas ciudadanas en Brasil y Chile el 2014, cuando hubieron manifestantes en las calles exigiendo mejoras en la provisión de servicios de transporte y educación. En nuestra región, 60% de los ciudadanos están dispuestos a salir a protestar para exigir sus derechos, trabajo, educación, salud, vivienda, seguridad ciudadana.4
Asimismo, los ciudadanos de hoy demandan mayor participación. Se está dando una evolución de la relación Estado – ciudadano donde hay una mayor implicación de la ciudadanía en las funciones del Estado y una comunicación de doble vía entre el gobierno y el ciudadano. El ciudadano ya no se conforma con solo recibir y ver la información, quiere opinar, participar e incidir en todo el ciclo de políticas públicas y en la toma de decisiones.
Por todo esto, es que hoy en día uno de los mayores desafíos para los gobiernos está en el ejercicio de la democracia. Un Estado que funcione, una “democracia que entrega” y que pueda atender y responder de manera transparente, eficiente y efectiva las demandas ciudadanas es un elemento esencial para el fortalecimiento de la legitimidad de origen de los gobiernos
democráticamente electos – sean cual sean su orientación político-ideológica o sus objetivos nacionales estratégicos.
II- La satisfacción con la democracia está vinculada con la gestion pública efectiva La legitimidad juega un rol definitivo en el estudio de la cultura política y es clave para la estabilidad y calidad democrática en tanto captura la relación entre los ciudadanos y las instituciones estatales. Entendemos por legitimidad política el apoyo ciudadano al sistema político el cual se manifiesta concretamente en participación ciudadana no solo en procesos electorales sino también en todo el ciclo de políticas públicas.
La participación ciudadana, la confianza en las instituciones y la credibilidad en estas son tres pilares básicos que sustentan la gestión pública y por consecuente, la sustentabilidad democrática.
En los últimos años varios países de la región vienen confrontando el problema de la falta de confianza y credibilidad de los ciudadanos en las instituciones públicas, lo cual tiene una repercusión directa en la democracia como forma de gobierno. El promedio de aprobación de los Gobiernos en América Latina y el Caribe va en descenso y está en 47% el 2015 comparado al 60% en el 2009.
En nuestra región, la satisfacción con la democracia está estrechamente vinculada al desempeño del Gobierno. Según el último informe de Latinobarometro, solo el 37% de los ciudadanos está satisfecho con la democracia en América Latina y el Caribe. Esto se debe en gran parte en cómo los ciudadanos evalúan e interactúan con el gobierno. Específicamente, se basa en la habilidad del Gobierno para solucionar los problemas concretos de sus ciudadanos, en la provisión de servicios públicos de calidad y en atender de manera transparente y efectiva las demandas ciudadanas.
Estado, ya sea por temas de educación, salud o transporte, provoca demostraciones y movilizaciones importantes, los ciudadanos salen a las calles a demandar y exigir al Gobierno respuestas rápidas y efectivas.
Esta situación tiene su origen, en gran parte, en la baja capacidad de los gobiernos para implementar políticas, programas y proyectos de manera efectiva. Estos “déficits de capacidad” se manifiestan en: la falta de conocimiento y prácticas de herramientas de gestión modernas y eficientes; estructuras organizacionales, procesos y procedimientos ineficientes e inadecuados; el déficit tecnológico en las entidades públicas; el bajo nivel de transparencia en las decisiones del gobierno; el frágil sistema de rendición de cuentas y acceso a la información pública; la poca participación de la ciudadanía y de la sociedad civil en la toma de decisiones, entre otras.
En el campo de la gestión pública, la diversificación productiva, la especialización funcional, la apertura de las economías, la fragmentación social y el surgimiento de actores transnacionales han vuelto más compleja la tarea de gobernar. La apertura de las economías a flujos transnacionales de idea, bienes y personas ha reducido el margen de maniobra de los gobiernos para diseñar e implementar políticas autónomas. Los ciudadanos hoy están mejor informados gracias al uso de las TICs y de las redes sociales como herramientas de movilización y fiscalización. La inclusión de grupos sociales antes marginados, y el reconocimiento de nuevas identidades han fragmentado las demandas ciudadanas en un mosaico de solicitudes diferenciadas por cada comunidad.
En el campo de la participación ciudadana, la restauración de la democracia y la fatiga política de las reformas estructurales ha elevado la presión social sobre el Estado y disparado las demandas ciudadanas a los gobiernos de turno. Como se mencionó anteriormente, la relación gobierno-ciudadano está cambiando, los ciudadanos quieren participar en la identificación del problema y de su diagnóstico, involucrarse en el co-diseño de políticas públicas y en la selección de sus instrumentos y colaborar directamente en la entrega de los servicios públicos en sus comunidades.
Los gobiernos se desempeñan hoy en un entorno complejo con múltiples actores donde existe una combinación de desconfianza, mayor participación, empoderamiento ciudadano, demanda de inclusión.
Es en este nuevo contexto que los gestores públicos, los servidores civiles y los ciudadanos son llamados a colaborar para construir la democracia del futuro con base en un gobierno abierto, es decir un gobierno transparente, efectivo, colaborativo y participativo.
III – Gobierno abierto: nuevo paradigma de la gestion pública
El concepto del Gobierno Abierto llego en buena hora justamente para atender estas demandas ciudadanas, y los Gobiernos de América Latina se han dado cuenta que deben adaptarse a esta realidad para volverse:
1. Gobiernos más abiertos: transparentar la gestion pública, rendición de cuentas, abrir los datos públicos a los ciudadanos.
2. Gobiernos más colaborativos: hacia la gobernanza colaborativa, interacción con más actores, alianzas público-privadas en provisión de servicios públicos en salud o educación
3. Gobiernos más efectivos: del manejo de procesos al mejoramiento de la entrega de servicios de calidad
La promoción de los principios de transparencia, rendición de cuentas, efectividad, colaboración y participación ciudadana fortalece los sistemas democráticos, incrementa los niveles de confianza de la ciudadanía en las instituciones políticas, potencia la participación y el compromiso cívico, mejora la calidad y efectividad de los gobiernos y sus administraciones públicas bajo principios de equidad, transparencia e integridad.
El Gobierno abierto trasciende a una nueva forma de gobernar, en la cual debe haber un permanente intercambio entre gobierno y ciudadanía y en el cual el Internet y las TICs en general, cumplen un rol fundamental. En este contexto, se necesitan marcos institucionales y bases legales adecuadas, sistemas de gestion más sofisticados y, sobre todo, un profundo cambio en la cultura de las organizaciones públicas.
Para que esta participación ciudadana sea efectiva, hay que proporcionar la información necesaria, de ahí la importancia del acceso a la información pública y de los datos abiertos que no solo contribuyen a informar, motivar y a hacer efectiva la participación ciudadana sino que también ayuda a su vez a generar actividades económicas y proveer servicios sociales que contribuyen a la sociedad.
El Gobierno abierto plantea la necesidad de poner a disposición de los ciudadanos toda la información y datos públicos que no están sujetos a reservas de tipo reglamentario o de seguridad, con el propósito de que los ciudadanos puedan ejercer su derecho de acceso a la información pública, realizar el control a la gestión de las entidades públicas, así como ejercer una participación ciudadana informada.
Hablar de transparencia no solo se refiere a establecer una barrera contra la corrupción y los abusos de poder, aspecto que sin duda consiguen en buena medida los proyectos de apertura de datos, sino del derecho de todo ciudadano al acceso a la información pública.
información pública los ciudadanos van a poder contar con los elementos suficientes que les permitan tomar decisiones adecuadas para sus propias vidas.
El Acceso a la Información y los datos abiertos han ido evolucionando de un estado en el que se limitaba la información a aspectos generales sobre la gestión de los recursos públicos, hacia un otorgamiento de información específica y útil para facilitar la toma de decisiones por parte de los ciudadanos en materia de educación, salud, seguridad, actividades económicas y políticas, entre otras.
Lo que determina si una política de transparencia es efectiva o no, tiene que ver con la forma en que la información se relaciona con la manera en que la gente realmente toma decisiones. No es solamente disponer información, sino también proporcionar información útil en el lugar correcto, en el contexto adecuado y en el momento oportuno.
El Acceso a la Información y los datos abiertos tiene varias dimensiones que benefician a la administración pública como por ejemplo reduce las posibilidades de corrupción, facilita la participación ciudadana, legitima las decisiones del gobierno, permite corregir errores y evaluar la gestión pública, entre otros.
Gracias al acceso a la información y a los datos abiertos, los ciudadanos de las Américas cuentan con información que afecta su vida cotidiana como por ejemplo el estado de las carreteras, rutas y tráfico en la ciudad; georreferenciación de situaciones conflictivas (seguridad y violencia); seguimiento de la prestación de servicios, ubicación de las mejores escuelas, cantidad de centros de salud por sectores, entre otros
mandato; o la Comisión Nacional para la Defensa de los Usuarios de los Servicios Financieros de México que desarrolló una iniciativa para proveer información accesible al ciudadano sobre los servicios financieros de la vida diaria.
IV. ¿Qué hace la OEA para promover la Gestión Pública Efectiva?
El Departamento para la Gestión Pública Efectiva de la OEA tiene la misión de contribuir a que las instituciones públicas de la región sean cada vez más transparentes, efectivas y cuenten con mecanismos de participación ciudadana. Para llevar adelante esta misión, se cuenta con diversos programas y proyectos orientados a mejorar las capacidades de los funcionarios públicos en las Américas, proveer metodologías y herramientas, facilitar espacios de dialogo e intercambio y a generar conocimiento sobre experiencias de gestion publica efectiva en la región.
Entre estos programas, cabe destacar los siguientes:
- El Mecanismo de Cooperación Interamericana para la Gestión Publica Efectiva (MECIGEP) que, desde su lanzamiento el 2013, ha contado con la participación de 14 países contribuyendo en temas de servicio civil, gobierno abierto, datos abiertos y que ha producido 6 informes con recomendaciones en temas como políticas salariales, modelos de gestion de servicios públicos, sistemas de gestion de personal, gobierno abierto, políticas de portales de transparencia y datos abiertos y modelo de empleo público integral.
- El Programa de agentes de cambio en Gobierno abierto que reúne a jóvenes líderes de la región provenientes de distintos sectores de la sociedad y que desarrollan en conjunto proyectos de gobierno abierto para luego ser implementados en sus comunidades, ciudades y/o países. En la primera generación se reunieron a 24 jóvenes provenientes de 15 países y que desarrollaron proyectos en áreas como justicia abierta, periodismo abierto, monitoreo en la construcción de obras públicas, seguridad ciudadana, laboratorios de innovación.
- El Concurso de cortos audiovisuales con el objetivo de resaltar la importancia del Acceso a la Información Pública para los ciudadanos y cómo este derecho afecta a su vida cotidiana, por ejemplo, acceso a la información sobre las becas de educación disponibles, información sobre el gasto y avance en las obras públicas y/o los procesos de contratación de proveedores del Estado.
- El Campus virtual que provee cursos en gestión pública, como el de uso de las redes sociales o estrategias de gobierno abierto, y que ha capacitado a más de 15000 funcionarios públicos.
- El Programa de Universalización de la Identidad Civil en las Americas (PUICA) que ha apoyado a los registros civiles en sistemas de registro hospitalario, campañas de identidad, interoperabilidad, seguridad de bases de datos y reconstrucción de registros dañados o perdidos por conflictos. Este apoyo ha resultado en la entrega de más de 19 millones de certificados o registros de nacimiento expedidos en 19 Estados miembros de la OEA.
V - Conclusiones
Nuestra región cuenta con una comunidad activa de emprendedores, desarrolladores, ciudadanos que impulsan los avances hacia gobiernos más abiertos. Sin embargo, la transparencia, la apertura de datos y el uso de las tics no bastan, aún hay muchos retos de reforma de la estructura de la administración pública, de la capacitación de funcionarios públicos y del cambio cultural necesario para poder adecuarla a las exigencias de una democracia participativa y colaborativa.
Conscientes de estos desafíos, varios países de la región han comenzado a incorporar sistemas que buscan la eficiencia y eficacia de la gestión; sistemas que proveen herramientas de administración sistemáticas y transparentes, que permiten dirigir y evaluar el desempeño institucional de las entidades públicas en términos de calidad y satisfacción social en la prestación de los servicios.
La gestión pública no es solo un conjunto de estándares, normas, indicadores y padrones de implementación, si no que estos deben estar conectados a principios tales como la legitimidad, responsabilidad, sensibilidad, equidad, eficiencia, efectividad, integridad, legalidad, entre otros.
Además, la gestion pública para ser efectiva requiere de voluntad política y de un compromiso con la democracia y la gobernabilidad democrática. Es por esto, que el fortalecimiento institucional y la modernización de las instituciones, con un enfoque en resultados concretos y poniendo al ciudadano al centro, es primordial para cualquier gobierno de la región.
Asimismo, es esencial promover la innovación y creatividad para ser efectivo y eficiente, pensar en soluciones integrales, e incentivar la cooperación entre instituciones. De igual manera, se debe aprovechar el uso de las TICs, para la apertura de datos e informar sobre lo que hacen de manera a ser más transparentes y rendir cuentas.
los sectores de la sociedad. La confianza del ciudadano se la gana día a día mediante la información y los servicios que se le provee.
Ciertamente, y aunque el progreso ha sido gigante aún hay un enorme camino por recorrer en la región para potenciar y procurar nivelar el desempeño en materia de gobierno abierto que contribuya a abordar los actuales desafíos tales como reducir las distintas brechas digitales y generar igualdad de oportunidades de acceso y participación. Debemos evitar que la tecnología agudice las diferencias existentes y más bien que contribuya a reducirlas.
Este avance hacia una gestion pública efectiva tiene que ver con cultura, valores, compromiso y responsabilidad cívica, lo cual se sustenta en la generación de nuevas prácticas e innovaciones de carácter democrático vinculadas a la construcción de espacios de encuentro, interacción y trabajo conjunto entre autoridades, funcionarios públicos y ciudadanos.
Este es un rol que viene cumpliendo la OEA, como foro político del hemisferio y punto de encuentro de todos los gobiernos, que se abre a participación de todos los actores sociales para tratar los temas esenciales en favor de la profundización de la democracia en nuestra región.
IMPROVING PERFORMANCE FROM THE CENTER OF GOVERNMENT: THE
MANAGEMENT MODEL OF PERNAMBUCO, BRAZIL1
Martin Alessandro, Mariano Lafuente e Ray Shostack 2
In 2007, the government of the state of Pernambuco, Brazil, introduced a management model aimed at enhancing performance and service delivery. A new institution at the Center of Government, the Secretariat of Planning and Management (SEPLAG), was created to develop and run the model, and was endowed with important technical capacities and political empowerment. The Pernambuco experience presents a range of integrated innovative features, as well as adopting data-driven or “Stat” reviews. Of particular note is the integration of planning, budgeting, monitoring and intervention, and the direct personal involvement of the Governor himself in leading the model.
Based on a case study of the model, this note describes its main characteristics, the context of its implementation, and the opportunities for improvement, offering insights for other national and subnational governments seeking to strengthen delivery of their priority initiatives through data-driven approaches. Rigorous impact evaluations of the effects of the model have not been conducted, but in certain policy areas, such as citizen security, there are indications that the introduction of the model has been relevant in improving outcomes.
State governments in Brazil are responsible for several key policy areas. Approximately 30% of all government expenditures are executed by state governments, including over 80% of all expenditures in citizen security and over 35% of expenditures in public education and health (Afonso et al., 2012). In this context, the state governments’ capacity to deliver becomes
1This note is based on a case study of the management model of Pernambuco conducted during 2013-2014, published by the Inter-American Development Bank: Alessandro, M., M. Lafuente and R. Shostak, (2014). “Leading from the Center:
Pernambuco’s Management Model”. IDB-TN-638. http://publications.iadb.org/handle/11319/6435
2 Martín Alessandro is a Consultant at the Institutional Capacity of the State Division at the IDB; Mariano Lafuente is a Senior State Modernization Specialist at the Institutional Capacity of the State Division at the IDB; Ray Shostak is the former Head of
critically important to provide high quality services for citizens and to achieve positive societal outcomes. The innovations introduced by the management model of the state of Pernambuco constitute an example of how these capacities can be enhanced, producing improved outcomes for and with citizens.
Pernambuco is the seventh most populous state in Brazil, with over nine million people as of 2013. Most of the states that in recent years have led public management innovations in Brazil (such as Minas Gerais; see Busjeet, 2012, in this series) are located in the Southeast, the country’s most developed region. Pernambuco, on the contrary, is a Northeastern state, and ranks only nineteenth out of 27 states in terms of the Human Development Index3. Moreover, Northeastern states have traditionally been regarded as “legendary for their clientelistic ways of governing” (Tendler, 1997:10), with resulting low capacities in their public administrations. Thus, the innovations in Pernambuco took place in a context that, a priori, would seem less favorable for such reforms.
1. Overview of the management model
The Governor that took office in 2007 and his senior leadership team faced, in the early months of their administration, three main challenges. First, the Governor had to deal with the complex managerial tradition of leading a government with more than 60 senior officials (30 cabinet secretaries and 36 directors of state companies) who reported directly to him. Second, the Governor’s team realized that, despite the existence of a government program presented during the campaign, the initiatives of the different line Secretariats needed a more cohesive strategic orientation. And third, the leadership team came into office with the perception that the state government was not doing enough to deliver services on time and on budget, and that in certain key policy areas (such as economic development, citizen security, health, and education) results were lagging behind both country and international performance.
The Governor commissioned a trusted team of eight advisors, who had experience with performance management tools from their backgrounds in the public and private sectors, to develop a new management model for the state government. The new approach would have to: (i) enhance the Governor’s capacity to hold managers accountable; (ii) improve the strategic direction and cohesion of the administration; and (iii) deliver results to the citizens. The “Integrated Management Model” was established during 2007, and later formalized through a law in 2009 by the state’s Legislative Assembly.
The model introduced several innovations in the management of state government, including enhancing the integration between their definition of the strategic priorities, the allocation of budgetary resources to achieve them, the monitoring of delivery, and the intervention when performance is off track to produce adjustments and corrections. The model is highly data-driven, and uses, as part of its operation, many of the features of the “Stat” models: regular and structured meetings between the Governor and the Secretariats and managers; use of performance data to track progress and decide corrections; and follow-up reviews in subsequent meetings (see Behn, 2014; Hatry and Davies, 2011; Thornburgh, Kingsley, and Rando, 2010). Nonetheless, as it will be discussed in the final section of this note, refreshing some of these components and routines may be important to make the most of the data-driven meetings (see Moynihan and Kroll, 2014, on good practices in this regard).
To develop and run the model, the Center of Government (CoG) 4 was strengthened. In particular, a new unit, the Secretariat of Planning and Management (SEPLAG) was established. This reform separated the more traditional tasks of public administration (such as procurement and human resource management), which were placed at the Secretariat of Administration, from the management of the model, which became SEPLAG’s sole responsibility. In this role, SEPLAG leads the strategic planning of the government priorities; the formulation of the budget; the monitoring of performance; and the intervention to improve it. These functions, housed under the same “roof”, are highly integrated.
4
The Center of Government refers to the institutions of direct support to the Chief Executive that lead certain key
SEPLAG combines two factors that are critical for the effectiveness of CoG institutions (see Alessandro, Lafuente and Santiso, 2013a): political empowerment and technical capacities. SEPLAG can speak and act on behalf of the Governor, and the sector Secretariats are aware of this. But it cannot rely simply on the authority granted by the Governor; it also needs to show the sectors that its work can add value in improving both management and performance. In this regard, SEPLAG has developed significant technical capacities. In 2010, it created a new cadre for planning, management and budget analysts. As of 2014, there are approximately 100 permanent analysts working at SEPLAG, all of whom have been recruited through a competitive process. These analysts also receive continuous training through a core curriculum that has been tailored to each individual’s existing knowledge and to his or her specific needs for the position, totaling 60 hours of courses per year. Thus, SEPLAG’s staff have the skills to be a credible and useful partner for the line Secretariats.
The following sections delve in more detail into how the government of Pernambuco plans its priorities and allocates resources; how it monitors and improves performance; what have been the model’s impacts; what opportunities for improvement remain and what insights can be extracted for other governments; and what can be done to favor the sustainability of the model.
2. Strategic management: planning and budgeting the priorities
In 2011, at the beginning of the Governor’s second term in office, the structure of the seminars was modified, in order to maximize the contributions of citizens. In the morning session, participants divided up in different rooms to discuss issues in separate policy areas (education, health, infrastructure, social development, economic development, and security) in meetings chaired by the respective Secretaries. In the afternoon, the Secretaries presented a summary of the discussions and agreements to a plenary session, chaired by the Governor. New debates occurred then. Attendance at the seminars increased from 5,207 participants in 2007 to 13,489 in 2011; the proposals submitted by citizens had a tenfold increase, from 2,600 to 26,147. SEPLAG estimates that approximately half of the government’s priority goals originated at the Seminars.
From these inputs, SEPLAG drafted a proposal of priority goals and submitted it to the Governor. In final consultations with the line Secretaries and other senior officials from the Center of Government, the Governor made the final decisions about the “Strategy Maps” that define priority goals to be achieved during his term in office. Thus, planning involved a double movement: after receiving the “outside-in” input from civil society, a “top-down” moment defined the priorities as proposed by SEPLAG and validated and agreed by the Governor and the Secretaries.
The development of Strategy Maps is an important aspect of the model. The 2008-2011 Strategy Map included 10 Strategic Objectives; the 2012-2015 Map had 12 (see Graph 1). Each Strategic Objective has its own Strategy Map, outlining the “priority goals” to be achieved. The 2012– 2015 Strategy Maps included 750 priority goals. By mid-2014, only 349 of them were still being monitored, because the others had already been achieved, or were modified or cancelled. These goals refer mostly to processes and outputs of the government’s work, such as the completion of infrastructure projects. In three policy areas (citizen security, health, and education), the goals also incorporate societal outcomes (lethal and violent crime rates; avoidable mortality rates; and student performance, respectively5), but most of them refer to specific activities of the
government’s work (i.e., building a hospital in the municipality of Barreiros).
5
Graph 1. 2012-2015 Strategy Map of the state of Pernambuco.
Source: adapted from Alessandro, Lafuente and Shostak (2014).
Each Strategic Objective may involve multiple Secretariats, but the individual priority goals within each objective are usually the responsibility of a single one. In fact, each priority goal is
Vision of the Future:
Pernambuco, a better place to live and work
Premisses and priority foci:
values thatguide all of the
government’s
work
12 Strategic Objectives: they include the 3 Pacts (health, education, and citizen
security) and 9 others (in the areas of water and sanitation;
housing and mobility; citizenship; economic development; infrastructure; rural
tied to a budget code, which allows the priority goals to have a direct correspondence in government’s budget. In other words: the budget is highly aligned to the plan. Graph 2 shows how each of the elements in the Strategy Map is mirrored in the budget, using the example of the Health Strategic Objective for the priority goal of building a hospital in the municipality of Barreiros. The priority goals, reflected in each of the budget’s sub-actions, are the key pieces of the model: they are intensively monitored through the routines that will be described in the next section.
Source: adapted from Alessandro, Lafuente and Shostak (2014).
The Pernambuco approach to modeling and aligning budget to priorities is also well developed. This alignment is possible because Pernambuco uses a program budgeting framework, with allocations reflecting product lines rather than input categories. In addition, the formulation of the priorities and of the budget, led by SEPLAG, takes into account likely fiscal scenarios
Strategy Map of the Health
Strategic Objective Annual Budget Law (LOA)
Strategic Objective: Expanding the supply and quality of public
health services
Perspective: A Better Life for All Pernambucans
Result: Expanding the coverage of health
services
Product: Building
health units’
equipment
Activity (Priority Goal): Building and equipping a hospital
in Barreiros
Sub-Function Function
Program
Action (Code: 4102)
(mainly, the availability of resources) for the following years, as well as data from previous years to estimate costs and execution time for the different projects. An internally developed financial management system (eFisco) feeds all the relevant data into a low-cost business intelligence application (Qlikview) that enables extracting and combining all this information in an accessible way. The 349 priorities being monitored as of mid-2014 represented approximately 12% of the state’s overall budget (not including personnel costs of the staff working on those goals, but only investment and direct transfers).
The alignment of the budget to the strategy map during program implementation occurs at the performance monitoring meetings, described in the next section. The decisions taken in these meetings regarding the priority goals (such as extending their deadline, cancelling them, or allocating more resources to them) are translated into budget re-allocations.
3. Monitoring and improving performance
Progress made in the priority goals is intensively monitored by the respective Secretariats and by SEPLAG. Each week, the Governor chairs monitoring meetings with the relevant Secretariats for two strategic objectives, covering all 12 of them in a six-week period6. At these data-driven meetings, the progress is analyzed, explanations are provided by the responsible managers, potential options for resolving barriers to performance are discussed, and adjustments are decided and documented. Between the meetings, the Governor and SEPLAG can access an online control panel to track progress in real time. The control panel displays each priority goal and the progress made; the name of the manager responsible for the project; any observations made at the meetings (explaining, for example, reasons for any delays); information about modifications or “re-negotiations” of the goal; its budget execution; and pictures showing the work done, as a way of verification (see Box 1 regarding the issue of data validity). SEPLAG’s staff uploads the data onto the control panel, and the Secretariats can only access such data for consultation.
The agenda for the monitoring meetings with the Governor is based on an analysis of progress on the priority goals. SEPLAG selects the goals that appear to be off track, and invites the specific managers for those areas to attend the meeting. Participants sit around a U-shaped table, facing a screen (see Image 1). The screen projects the results achieved for the priority targets, with visual supports (maps, pictures) when needed. When the data show delays in the delivery of the goals, the officials explain why, specifying the problems that are affecting their agency’s performance. Deliberations among participants ensue, and when obstacles have been clearly identified, decisions on how to unblock them are taken, including which officials are responsible for the needed actions and a deadline for their completion. These decisions are reflected in the minutes of the meeting, prepared by SEPLAG’s staff at that same time and projected on the screen, so Box 1. Data validity for performance monitoring in Pernambuco
Ensuring the quality of the data is critical for any data-driven management model. In the early stages of the implementation of the Pernambuco model, 14 school principals had presented implausible figures of student absenteeism for their schools. In the subsequent monitoring meeting, the Governor pressed them on these figures, and they finally admitted to have doctored the numbers. The Governor immediately fired those school principals, to send a clear signal that no attempts to game the system would be tolerated. Since then, monitoring meetings have rarely been so confrontational, and the managers have realized that is preferable to raise problems early on instead of trying to doctor the figures.
Nonetheless, SEPLAG conducts certain reliability checks. The data is introduced to the control panel by SEPLAG’s analysts, not by the sectors. The Project Management Office, which tracks the most important infrastructure projects (see below in this section), meets with external actors (such as the contractors or auditing firms) to review the information provided by the sectors. In addition, pictures of the completion of the works are incorporated to the control panel. And by monitoring both the physical and the financial execution of the projects, SEPLAG can detect any inconsistencies between them that may suggest inaccuracies in the data, prompting further inquiries.
“Gaming” may be more severe when meeting the targets is tied to financial incentives for the sectors (Bevan and Hood, 2006). In Pernambuco, the Secretariats have no budgetary incentives to meet their targets, although the compensation of frontline staff (such as police officers and teachers) varies depending on the achievement of the targets.
that the agreements are clear to all participants. In 2013, a total of 1,150 decisions were adopted at the meetings.
Most of the decisions taken at the meetings refer to specific, detailed actions to correct problems presented by the participants. For example, in a meeting for the Health strategic objective, participants discussed the reasons behind the insufficient progress made in achieving a certain priority goal (the number of mammograms being completed); the problem was that the Secretariat of Health was not receiving the resources on time from the Secretariat of Finance, responsible for the cash flow. After Finance agreed to speed up the disbursement process, the goal could be achieved. Moreover, the recurrence of certain problems has led SEPLAG proactively to seek to address them more generally. Two recurring problems for achieving goals related to public works in different strategic objectives were delays in expropriations and in granting environmental permits. After identifying these obstacles, SEPLAG set up two committees to work with the state’s attorney general and with the state’s environmental agency, respectively. These committees hold monthly meetings with these agencies to monitor the timely resolution of problems in these two areas, which impact the achievement of goals throughout the administration. Nevertheless, many of the decisions taken at the meetings involve granting more resources for projects that present delays, which may not help to change behaviors and culture, and which may be feasible only during good fiscal times7.
The Governor’s and SEPLAG’s monitoring only focuses on the priority goals; each Secretariat is responsible for monitoring all the other activities within their portfolios. Most of the approximately 7,000 “sub-actions” in the government’s budget are excluded from this monitoring system (although some Secretariats have replicated a similar format for their own internal monitoring). But for the goals that are being centrally being monitored (349 as of mid-2014), there are three different systems and routines in place:
(i) Nine of the 12 Strategic Objectives are reviewed every six weeks, at the meetings already described that are chaired by the Governor.
(ii) In the other three Strategic Objectives (education, health, and citizen security) the government has established “Performance Pacts” which focus not only on processes and outputs, but also on outcomes. These areas have more frequent monitoring meetings: weekly for citizen security (“Pact for Life”), co-chaired by the Secretaries of Security and of SEPLAG, and monthly for education (“Pact for Education”) and health (“Pact for Health”), chaired by the respective Secretaries8.
(iii) Finally, within the different strategic objectives, the most important infrastructure projects (those with a budget of approximately over US$4.5 million and over 6 months of execution; there were 76 of these projects as of mid-2014) are tracked by a specific unit within SEPLAG, the Project Management Office (Escritório de Gestão de Projetos, or EGP), which conducts weekly monitoring meetings with the managers in charge of the projects and tracks a more detailed sequence of steps within each project9. The EGP uses the methodology of the Project Management Institute (PMI), adopted by several Brazilian states (Lucrécia, 2014).
For the three Pacts, SEPLAG’s involvement in unblocking obstacles that affect performance goes beyond the monitoring meetings. For each Pact, a Performance Management Center has been established at the three Secretariats, staffed by eight to ten of SEPLAG’s analysts. These analysts collect information, monitor the planned activities, prepare the monitoring meetings, and oversee the delivery of the agreements made at the meetings. They also provide support to the Secretariats in the implementation of the model, especially in ensuring that it is understood by the regional managers and even by frontline staff in schools or hospitals. They act as advisors to the Secretariats, providing management tools and analytical capabilities, and assisting in raising performance when the goals are not being met. For example, in education, they worked the Secretariat to detect the schools with critically low performance, and assisted the regional
8The Pact for Life was established in 2007, and the other two Pacts in 2011. SEPLAG’s original intention was to extend the Pac t model to all priority areas, but budgetary constraints have limited this possibility. As of writing this article, SEPLAG planned to double its workforce (from 100 to 200 analysts) in order to extend the Pact model.
managers and the school principals in the implementation of management techniques to improve their performance.
4. What has been the impact of the model?
As described in the previous section, the Pernambuco management model has focused more (but not entirely) on optimizing the government’s internal processes, in order to enable outputs to be produced effectively and efficiently, than on connecting these government activities to societal outcomes. All stakeholders interviewed for the study that is the basis of this paper, from inside and outside of the state government, agreed that since 2007 the government of Pernambuco has been better able to complete its projects on time and on budget, and consider that the model has been the key factor behind these improvements (complemented with favorable political, economic and fiscal factors). The government credits the model for the completion of major public works in the state (Cruz, 2012). However, there is no available data, either from previous projects or from non-priority projects, to serve as a counterfactual in order to actually measure the effect of the model on the government’s capacity to produce outputs.
Furthermore, the actual effect of the government’s actions on outcomes has generally not been measured through more rigorous instances of impact evaluation. The model has focused on monitoring rather than on evaluation, and SEPLAG has only conducted a few of these studies10; this is certainly a challenge ahead. Nonetheless, the evolution of the outcome indicators in the longest-running of the three pacts, the Pact for Life, suggests that there may actually be a connection between enhanced outputs and improved outcomes, at least in this policy area. Graph 3 shows that the homicide rate in Pernambuco has declined by almost 30% since the introduction
10SEPLAG’s analysts have received training in impact evaluation methodologies and conducted
of the Pact (2007-2012), while it has remained fairly constant at the national level and has increased by almost 80% in the average of the other Northeastern states. In education and health the improvements have been very modest, largely following the national trends, although in these areas the introduction of the Pacts was too recent to produce a useful time series.
Graph 3. Homicides per 100,000 inhabitants
Source: authors’ calculation based on data from the Anuário Brasileiro de Segurança Pública, yearly editions 2006-2013. Available at http://www.forumseguranca.org.br/, consulted on July 3rd, 2014.
Producing more rigorous measurements of the impact of the model on outcomes would be feasible. For example, in education, SEPLAG applies the performance Pact to the schools ran by the state government, but not to the municipal or the private schools. By tracking the evolution of students’ performance in standardized tests in comparable11 state and municipal and private
11 A variety of other factors that also influence the performance of students could systematically differ between these types of schools. But there are impact evaluation methods that aim to hold these factors constant: for example, schools could be matched according to a set of criteria (i.e., the socio-economic characteristics of their students) so that the comparisons would hold these differences constant, capturing only the effect of the Pact.
Pact for Life
10 15 20 25 30 35 40 45 50 55
2005 2006 2007 2008 2009 2010 2011 2012
Pernambuco Northeast Brazil
schools, it would be possible to estimate the effect of the Pact on student achievement. A similar comparison could be applied in the health sector between state and municipal health centers.
Of course, even then it would not be possible to know what are the different effects of the specific elements of the model (the collecting of data, the monitoring meetings, or the support provided by SEPLAG’s analysts). Maybe only one or some of them are producing the positive effects. But as there are differences in how the model itself is implemented (between the “basic” model, the EGP, and the Pacts), these variations could be used to assess the impact of specific elements of the model (see Besharov, 2009, on the use of “planned variation experiments”). This is a first lesson that can be extracted by other governments seeking to establish a data-driven management model: take advantage of the data already being collected, and of the variations in the implementation of the model, to better measure what is working and what is not. The next section describes other insights from this case.
5. Opportunities for improvement and insights for other governments
Pernambuco has made great progress in developing a culture of management for results, but there are still opportunities to improve the model. Moreover, these ideas can benefit other governments seeking to improve performance in their administrations:
a) In terms of engaging with citizens. Citizens are co-producers of many of the outcomes of interest for government (crime reduction, student achievement, health outcomes, among many others). Thus, it would be worth exploring a more systematic and continuous engagement with society, going beyond the regional seminars every four years. More periodic meetings and the use of online tools can help the government as a form of “community monitoring”, collecting the citizens’ view of how things are going in the priority projects and adapting the strategy according to this feedback.
incorporate value-for-money analyses in the formulation of the priority goals and the allocation of budgetary resources.
c) In terms of the monitoring meetings. These are a key component of the model, and one of the drivers of the improvements achieved by the state. The Governor’s personal involvement has been a clear signal to all managers that the meetings are highly relevant. Refreshing some of the meetings’ dynamics would reinforce a collective problem-solving approach, ensuring that participants are open to discuss problems and focus on seeking solutions to them. This approach (instead of a “defensive” one in which participants concentrate on justifying insufficient results) is the main value added by “Stat” meetings in terms of improving performance.
d) In terms of the roles of the Center of Government and of the sectors. SEPLAG has taken a leading role in formulating the priority goals, trying to find the right balance between its central steering role and the sectoral expertise located in the line Secretariats. By enhancing the capacities for planning and monitoring at the sectoral level, SEPLAG could be relieved from certain responsibilities that it had to assume at the earlier stages of the model due to the lack of expertise in these methodologies at the Secretariats.
e) In terms of the articulation with local service providers, including municipalities. Municipalities are critical for achieving many of the state government’s objectives, such as raising educational and health standards throughout the state. Extending the model to the municipalities, or involving them in the state’s management model, could positively contribute to achieving the goals.
6. Open questions about institutionalization and sustainability
The Pernambuco management model has been heavily influenced by the leadership style of the senior team that developed it. It remains to be seen whether the Governor that takes office in 2015 decides to continue, reform or abandon the management model described in this article12.
12 Actually, in April 2014 Governor Campos resigned as Governor of Pernambuco in order to run for President. But his successor for the remaining term was his Deputy Governor, who kept SEPLAG’s
There are, however, a number of factors that favor a continuation of the model, even if modified to fit the management style of the next Governor:
a) Most actors in the state credit the model for achieving results, and for the political success of the Governor.
b) The daily operation of the model involves not only the senior leadership of the state’s government, but managers and frontline staff; there may be sedimentation of the new practices throughout the civil service.
c) SEPLAG’s own analysts could be a strong force for the continuation of a data-driven management model.
d) SEPLAG has worked on the documentation of the processes and routines that form the model, and they have been disseminated inside and outside of Pernambuco.
References
Alessandro, M., M. Lafuente, and C. Santiso. 2013a. “The Center of Government: a Literature Review”. IBD-TN-563. Washington, DC: Inter-American Development Bank.
http://publications.iadb.org/handle/11319/5988
Alessandro, M., M. Lafuente, and C. Santiso. 2013b. “Strengthening the Center of Government in Latin America and the Caribbean.” IBD-TN-591. Washington, DC: Inter-American Development Bank. http://publications.iadb.org/handle/11319/6003
Alessandro, M., M. Lafuente and R. Shostak. 2014. “Leading from the Center: Pernambuco’s Management Model”. IBD-TN-638. Washington, DC: Inter-American Development Bank.
http://publications.iadb.org/handle/11319/6435
Afonso, J., et al. 2012. “Reflections on Two Decades of Social Spending Decentralization.” In G. Brosio and J. P. Jiménez (Eds.). Decentralization and Reform in Latin America. Improving Intergovernmental Relations. Cheltenham, United Kingdom: Edward Elgar-United Nations. Behn, R. 2006. “The Varieties of CitiStat.” 2006. Public Administration Review 66(3): 332–40. Bevan, G. and C. Hood. 2006. “What ’ s measured is what matters: Targets and gaming in the English public health care system”. Public Administration, 84(3):517-538.
Besharov, D. 2009. “Presidential address: From the Great Society to continuous improvement government: Shifting from ´does it work?´ to ´what would make it better?´”. Journal of Policy Analysis and Management, 28(2):199-220.
Busjeet, G. 2012. “The State Results-Based Management System of Minas Gerais, Brazil”. The Nuts & Bolts of M&E Systems, No18. PREM Notes, The World Bank.
Cruz, Mauricio. 2012. “Transformando a Gestão Pública em Pernambuco”. SEDMG-Instituto Gestão, Governo do Estado de Pernambuco.
Governo do Estado de Pernambuco. 2014. “Pacto pela Vida. Balanço 2013”. Available in:
http://www.slideshare.net/fullscreen/redacaojornaldocommercio/balano-ppv-2013/1 (consulted
Hatry, H. and E. Davies. 2011. “A Guide to Data-Driven Performance Reviews.” IBM Center for the Business of Government, Improving Performance Series.
Lucrécia, C. 2014. “Escritório de Gestão. Mais controle e parceria no monitoramento”. Revista Gestão Pública PE, 5. Available in: http://www2.seplag.pe.gov.br/web/seplag/instituto-revista Moynihan, D. and A. Kroll. 2014. “Performance Management Routines that Work? An Early Assessment of the GPRA Modernization Act”. La Follette School of Public Affairs, Working Paper No. 2014-005.
Tendler, J. 1997. Good Government in the Tropics. Baltimore, MD: The Johns Hopkins University Press.
CONTRATUALIZAÇÃO DE RESULTADOS E DESEMPENHO NO SETOR PÚBLICO: A experiência do Contrato Programa nos hospitais da Administração Direta no Estado de São
Paulo.
Priscilla Reinisch Perdicaris
A contratação de resultados tem sido cada vez mais utilizada por órgãos governamentais como um meio de aperfeiçoar aspectos relacionados à coordenação, à prestação de contas e, de uma maneira geral, à melhoria na prestação de serviços públicos. Este mecanismo vem sendo utilizado mais recentemente por órgãos governamentais para gerir resultados em seus próprios departamentos e instituições, como uma maneira de atingir metas previamente estabelecidas junto ao núcleo estratégico de governo (Di Pietro, 1996). Na área de saúde, ganharam notoriedade os contratos de gestão firmados entre a Secretaria de Saúde do Estado de São Paulo com as Organizações Sociais de Saúde (OSS), para o gerenciamento de hospitais. Porém, outra experiência mais recente de contratualização em São Paulo, junto aos hospitais da Administração Direta (AD), vem também colhendo bons resultados, o chamado Contrato Programa. Este artigo trata, portanto, da implantação de contratos de gestão em hospitais da administração direta no Estado de São Paulo e seu impacto nos indicadores das instituições.
A contratualização é o componente formal de uma parceria que implica uma relação firmada entre organizações governamentais e uma terceira entidade, seja ela governamental ou privada, com ou sem fins lucrativos, para o fornecimento de produtos ou a prestação de serviços (Skyle, 2009, p. 137); (Smith, 2005). Também conhecida por “contratos de gestão” ou “contratos de resultados” é na prática, a concessão de maior autonomia de gestão a entidades descentralizadas em troca do comprometimento da organização em atingir determinados resultados. Desta forma, o controle do Estado deixa de ser exercido apenas da maneira burocrática tradicional, ou seja, pelo cumprimento de normas e procedimentos, e passa a orientar-se prioritariamente à avaliação de resultados, um dos principais conceitos da Nova Gestão Pública (NGP).
inovadores, como a criação das Organizações Sociais (OS) e as Agências Executivas (AE). Tais organizações descentralizadas seriam responsáveis pela prestação de serviços, enquanto que a função de planejamento caberia ao Estado, fortalecendo seu papel estratégico. A relação entre o núcleo estratégico e as organizações descentralizadas se daria através de compromissos com
resultados, concedendo maior autonomia executiva às organizações (Pacheco, 2006).
O Governo Federal teve adesão limitada ao modelo de organizações descentralizadas, porém as propostas passaram a ser adotadas por alguns Estados e capitais. Em São Paulo, um dos casos mais marcantes de contratualização é o desenvolvido no sistema de saúde pública estadual, que vem sendo implementado de forma ininterrupta por mais de uma década junto às unidades de saúde gerenciadas por Organizações Sociais de Saúde (OSS). A contratualização começou como uma forma de controlar e direcionar o serviço público prestado pelas OSS, regulamentadas no Estado de São Paulo em 1998, que passaram a ser contratadas para administrar hospitais públicos estaduais recém-construídos.
O caso de contratualização com as OSS e os sucessivos estudos comparativos entre a eficiência dos hospitais geridos por OSS e AD serviram de inspiração para que a Secretaria Estadual de Saúde de São Paulo (SES/SP) iniciasse, ao final de 2008, a contratação de resultados em algumas de suas unidades da Administração Direta, através do mecanismo denominado Contrato Programa (CP). Mais recentemente, a SES/SP ampliou o CP para todas as unidades hospitalares. O Contrato Programa é um instrumento formal, registrado em cartório, que estabelece metas de produção, qualidade e eficiência para os hospitais públicos. As metas são estabelecidas entre as equipes da SES/SP juntamente com os dirigentes do hospital e são acompanhadas pela CSS (Coordenadoria de Serviços de Saúde), em reuniões periódicas de avaliação de desempenho ou nas visitas aos hospitais. As reuniões, que podem ser mensais ou trimestrais, dependendo da evolução da gestão do hospital, reúnem as equipes de gestores do hospital e da CSS para discutir os indicadores e as ações necessárias para o alcance das metas.
contratualização, como o fato de ser um contrato em áreas internas à organização – ao contrário das OSS que são com parceiros externos –, não ser previsto mecanismos de punição, a prestação de contas se dar em reuniões de acompanhamento, não apenas em relatórios, entre outros. Ainda, o incentivo financeiro obtido, de 1% do orçamento, só poderá ser utilizado em investimentos na instituição (como reformas ou treinamentos). Este valor não pode ser revertido em remuneração financeira aos funcionários ou dirigentes, mas o diretor de cada unidade tem autonomia para gastar o recurso como achar mais adequado, desde que siga as regras de licitação do Estado. Normalmente parte desses bônus são revertidos em benefícios para a equipe, como reforma dos refeitórios, troca de computadores, aquisição de máquina de café, capacitação ou outros.
Até o momento, os estudos que comparam o desempenho de hospitais estaduais sob contrato de gestão focam no modelo institucional, testando se os hospitais administrados por OSS são mais eficientes que os da Administração Direta. Tais pesquisas mostram que há diferença de desempenho entre hospitais OSS e AD, sendo que as OSS apresentaram melhores resultados. Porém, existem claras limitações a esses estudos, já que comparam hospitais muito diferentes entre si, inseridos em contextos institucionais distintos. Este estudo pretende ir além da discussão sobre gestão pública versus privada, buscando entender a melhoria de desempenho a partir do contrato de gestão. Portanto, não é objeto deste artigo a discussão das vantagens e desvantagens do modelo de OSS em relação à Administração Direta, mas sim entender se há maneiras de melhorar os resultados dos hospitais, dado o contexto político-institucional da Administração Direta.
As principais questões de pesquisa estão descritas abaixo:
1. Há diferença entre os indicadores dos hospitais contratualizados e não contratualizados da AD?
2. A variável “Contrato Programa” pode explicar variações nos indicadores de impacto? 3. Há diferença de eficiência relativa entre os hospitais com e sem Contrato Programa?
período estudado, em relação aos hospitais não contratualizados. Serão avaliados os indicadores de processo e resultado, antes e depois da inclusão do hospital no Contrato Programa.
Já na segunda fase, é feita uma análise de regressão, com o objetivo de buscar entender quais variáveis são significantes para explicar a taxa de mortalidade (variável dependente), através do método multivariado de mínimos quadrados. Para a variável de tratamento foi utilizada a existência ou não do Contrato Programa (variável binária) e como variáveis de controle o número de leitos, taxa de ocupação e média de permanência.
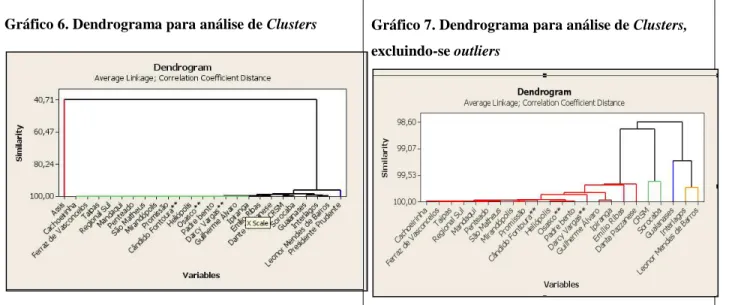
Um terceiro momento consiste na análise da eficiência relativa dos hospitais. Para tanto é feito um agrupamento dos hospitais com características semelhantes, utilizando-se a metodologia de clusters, com os dados de perfil de internação dos hospitais, tornando a amostra o mais compatível possível. O objetivo é avaliar quais hospitais encontram-se próximos da fronteira de eficiência, utilizando-se a metodologia DEA (Data Envelopment Analysis), buscando entender se os hospitais contratualizados são mais eficientes em comparação ao restante da amostra.
A amostra do estudo consiste nos hospitais gerais da Administração Direta gerenciados pela SES/SP, contratualizados e não contratualizados. A CSS coordena 38 unidades hospitalares de saúde. Destes, 25 são considerados hospitais gerais, sendo que 14 foram contratualizados entre dezembro de 2008 e março de 2010. Portanto, a amostra consiste de 25 hospitais gerais, sendo 14 contratualizados. O recorte temporal é do período 2007-2011. A base de dados deste estudo foi construída com informações do Ministério de Saúde, disponível online no DATASUS, e informações do NIH (Núcleo de Informações Hospitalares), disponibilizadas pela equipe da CSS.
1. Análise Horizontal
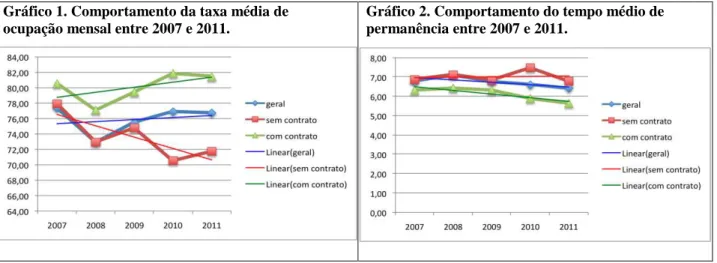
Para se analisar cada variável apresentada utilizam-se os Gráficos 1 a 7. Dessa forma é possível entender como os indicadores variaram no período 2007 a 2011, observando-se um padrão de comportamento dos grupos com e sem contrato.
Gráfico 1. Comportamento da taxa média de ocupação mensal entre 2007 e 2011.
Gráfico 2. Comportamento do tempo médio de permanência entre 2007 e 2011.
Fonte: Elaborado pela autora.
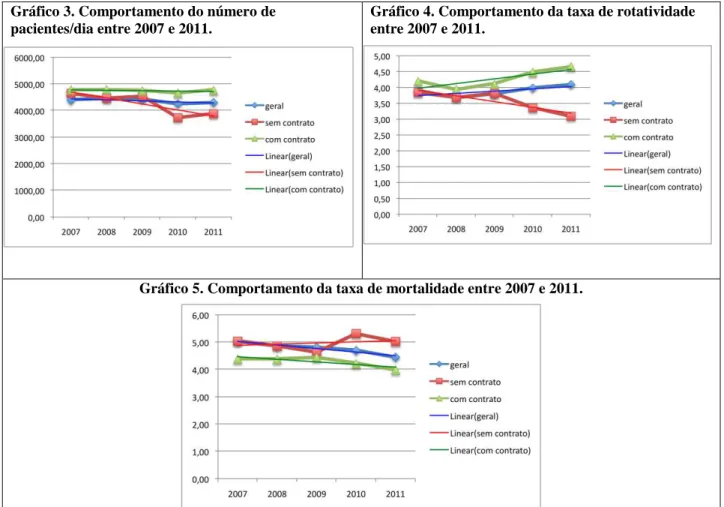
Gráfico 3. Comportamento do número de pacientes/dia entre 2007 e 2011.
Gráfico 4. Comportamento da taxa de rotatividade entre 2007 e 2011.
Gráfico 5. Comportamento da taxa de mortalidade entre 2007 e 2011.
Fonte: Elaborado pela autora.
Quadro 1. Variação de desempenho nos grupos com e sem contrato
Indicador Sem Contrato Com Contrato Sentido
Taxa de ocupação mensal média -7.91% 1.10%
Tempo médio de permanência -1.18% -10.65%
Pacientes/dia -16.51% -0.27%
Taxa de rotatividade -19.45% 11.27%
Taxa de mortalidade -0.17% -9.10% Fonte: Elaborado pela autora.
O Quadro 1 resume a variação de desempenho nos dois grupos. Pode-se observar que todas as variáveis tiveram maior variação de desempenho nos grupos contratualizados. As maiores variações de desempenho entre os dois grupos dizem respeito à taxa de rotatividade, com um decréscimo de quase 20% nos hospitais sem contrato, e um acréscimo de mais de 11% nos hospitais contratualizados, além de uma redução de quase 10% na taxa de mortalidade nos hospitais que aderiram ao CP, enquanto se manteve estável nos demais hospitais. Houve ainda um decréscimo de mais de 10% no tempo médio de permanência nos hospitais contratualizados, enquanto que nos demais se manteve praticamente estável.
2. Análise de Regressão
O principal objetivo desta fase é testar, através de uma análise econométrica, se a variável de tratamento Contrato Programa (CP) é significativa para explicar variações no resultado de impacto, representado pela taxa de mortalidade. Os demais indicadores são variáveis de controle (número de leitos, taxa de ocupação, tempo médio de permanência e índice de rotatividade).
Taxa de Mortalidadeit = b0 + b1 Número de Leitosit + b2 Taxa de Ocupaçãoit + b4Tempo
Médio de Permanênciait + b5 Índice de Rotatividadeit + b4 Contrato Programait +e
O modelo que apresentou resultados mais consistentes foi o seguinte:
Taxa de Mortalidade = 5,14 +0,01 Número de Leitos– 0,03 Taxa de Ocupação + 0,42 Tempo