HESSD
3, 499–527, 2006Salt intrusion in multi-channel
estuaries
A. D. Nguyen and H. H. G. Savenije
Title Page
Abstract Introduction
Conclusions References
Tables Figures
◭ ◮
◭ ◮
Back Close
Full Screen / Esc
Printer-friendly Version
Interactive Discussion
Hydrol. Earth Syst. Sci. Discuss., 3, 499–527, 2006 www.hydrol-earth-syst-sci-discuss.net/3/499/2006/ © Author(s) 2006. This work is licensed
under a Creative Commons License.
Hydrology and Earth System Sciences Discussions
Papers published inHydrology and Earth System Sciences Discussionsare under
open-access review for the journalHydrology and Earth System Sciences
Salt intrusion in multi-channel estuaries:
a case study in the Mekong Delta, Vietnam
A. D. Nguyen1,2and H. H. G. Savenije1,2
1
Department of Management and Institutions, UNESCO-IHE Institute for Water Education, 7 Westvest, P.O. Box 3015, 2601 DA Delft, The Netherlands
2
Department of Water Management, Faculty of Civil Engineering and Applied Geosciences, Delft University of Technology, Stevinweg 1, P.O. Box 5048, 2600 GA Delft, The Netherlands
Received: 6 December 2005 – Accepted: 6 February 2006 – Published: 13 April 2006
Correspondence to: A. D. Nguyen (d.nguyen@unesco-ihe.org)
HESSD
3, 499–527, 2006Salt intrusion in multi-channel
estuaries
A. D. Nguyen and H. H. G. Savenije
Title Page
Abstract Introduction
Conclusions References
Tables Figures
◭ ◮
◭ ◮
Back Close
Full Screen / Esc
Printer-friendly Version
Interactive Discussion Abstract
There is a well-tested theory for the computation of salt intrusion in alluvial estuaries that is fully analytical and predictable, in the sense that it has well-tested analytical equations to predict the mixing behaviour of the estuary based on measurable quanti-ties, such as channel topography, river discharge and tidal characteristics. This theory
5
has been described in a range of publications (Savenije, 1986, 1989, 1993) and a re-cent book (Savenije, 2005). This theory applies to single-channel topographies and es-tuaries that demonstrate moderate tidal damping. The Mekong delta is a multi-channel estuary where the tide is damped due to a relatively strong river discharge (in the
or-der of 2000 m3/s), even during the dry season. As a result the Mekong is a strongly
10
riverine estuary. This paper aims to test if the theory can be applied to such a riverine multi-channel estuary, and to see if possible adjustments or generalisations need to be made. The paper presents salt intrusion measurements that were done by moving boat in 2005, to which the salt intrusion model was calibrated. The theory was expanded to cater for tidal damping. Subsequently the model was validated with observations
15
made at fixed locations over the years 1998 and 1999. Finally it was tested whether the Mekong calibration fits the overall predictive equations derived in other estuaries. The test was successful and led to a slight adjustment of the predictive equation to cater for estuaries that experience a sloping bottom.
1 Introduction 20
The recent book on Salt Intrusion and Tides in Alluvial Estuaries (Savenije, 2005) presents a comprehensive theory for the modelling of steady state and unsteady state salt intrusion in alluvial estuaries. It is based on the analysis of some 17 estuaries world-wide on the basis of which a general predictive theory has been developed that is claimed to be predictive, meaning that it can be applied to predict the salinity
dis-25
tribution in any alluvial estuary provided some basic information on topography, tide
HESSD
3, 499–527, 2006Salt intrusion in multi-channel
estuaries
A. D. Nguyen and H. H. G. Savenije
Title Page
Abstract Introduction
Conclusions References
Tables Figures
◭ ◮
◭ ◮
Back Close
Full Screen / Esc
Printer-friendly Version
Interactive Discussion
and river discharge is known. Limitations of the theory are that it has been derived for single channel estuaries and for estuaries where the tide experiences only modest damping or amplification. The Mekong Delta is an alluvial estuary that consists of many branches and that transports a large amount of fresh water to the sea, even during the
dry season (in the order of 2000 m3/s), as a result of which the tide is strongly damped
5
and the branches of the delta are rather prolonged. This gives the Mekong estuary a clearly riverine character, putting it at the fringe of applicability of this theory.
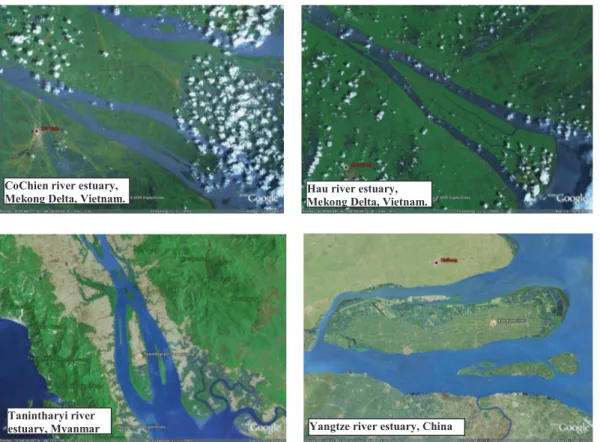
Looking at other branched alluvial estuaries in the world, it appears that they have similar characteristics: (i) If an estuary is divided into two branches by an island, the
branches are of almost equal length. (ii) There are no large differences between the
10
branches in area, width and depth. Examples of branched estuaries are the Loire estuary in France, the Tanintharyi estuary in Myanmar, the Hau and CoChien branches of the Mekong Delta in Vietnam, the Dhamra estuary in India and the Yangtze river estuary in China (see Fig. 1)
The question now is: does the method of Savenije (2005) apply to these estuaries
15
as well, or is there a need to extend the theory so that it can be applied to branched estuaries as well. In this paper, we shall demonstrate that the method is indeed ap-plicable to branched estuaries but that a certain procedure needs to be followed. We also present some refinements to the method for estuaries that experience strong tidal damping or that have a prominent bottom slope.
20
2 Summary of the method
Savenije (2005) demonstrated that the steady state salt balance equations for High Water Slack (HWS), Low Water Slack (LWS) and Tidal Average (TA) could be written as:
Si −Sf =ci
∂Si
∂x (1)
25
HESSD
3, 499–527, 2006Salt intrusion in multi-channel
estuaries
A. D. Nguyen and H. H. G. Savenije
Title Page
Abstract Introduction
Conclusions References
Tables Figures
◭ ◮
◭ ◮
Back Close
Full Screen / Esc
Printer-friendly Version
Interactive Discussion
Wherei=1,2,3 indicating the three different states: HWS, LWS and TA.Si is the steady
state salinity,Sf is the fresh water salinity. The coefficientci is an x-dependent coeffi
-cient defined by:
ci =
A Qf
Di (2)
WhereDi (L2T
−1
) is the dispersion coefficient for each state i, Qf (L3T
−1
) is the river
5
discharge, which is negative since the positive x-axis points upstream, andA(L2) is the
tidal averaged cross-sectional area.
The relationship between the salinity and the dispersion coefficient, based on
previ-ous work by Van der Burgh (1972) is defined by:
Di
Di0
=
S
Si0
K
(3)
10
WhereK (–) is the Van der Burgh’s coefficient, andDi0(LT
−2
) andSi0(ML
−3
) are the
boundary conditions at the river mouth (x=0) for the HWS, LWS or TA conditions. The
values ofK andDi0can be obtained through calibration. The relation for the dispersion,
as a function ofx, is:
Di
Di0
=1−βiexpx
a
−1 (4)
15
Where:
βi =−
K aQf Di0A0
= K a
αi0A0
and αi0=−
Di0
Qf
WhereA0(L
2
) is the tidal average cross-sectional area at the estuary mouth anda(L)
is the cross-sectional area convergence length.
HESSD
3, 499–527, 2006Salt intrusion in multi-channel
estuaries
A. D. Nguyen and H. H. G. Savenije
Title Page
Abstract Introduction
Conclusions References
Tables Figures
◭ ◮
◭ ◮
Back Close
Full Screen / Esc
Printer-friendly Version
Interactive Discussion
As a result, the longitudinal variation of the salinity can be computed by the following equation:
Si −Sf
Si0−Sf
=
D
i
Di0
K1
(5)
The salt intrusion curve derived for the TA situation, which represents for the TA longi-tudinal variation of the salinity, can be used for LWS and HWS as well, by shifting the
5
curve upstream or downstream over half the tidal excursionE.
Finally:
Li =aln
1
βi +
1
(6)
WhereLi (L) is the salt intrusion length.
Condition for the derivation is that the cross-sectional area follows an exponential
10
function, which is presented in the next section.
Because the method has been applied in 17 different estuaries all over the world,
particularly for the HWS situations, it was possible to derive two predictive equations
for K andD0HW S(Savenije 1993). These relations were generalised and improved by
Savenije (2005) into:
15
D0HW S =1400h
a q
NR(υE) (7)
and
K =0.2×10⁻³
E
H
0.65E C2
0.39
(1−δb)−2.0
b
a
0.58 E a A′
0
!0.14
(8)
Where A′0 (L2) is the cross-sectional area at the estuary mouth, b (L) is the width
convergence length;E (L) is the tidal excursion. H (L) is the tidal range, h(L) is the
20
HESSD
3, 499–527, 2006Salt intrusion in multi-channel
estuaries
A. D. Nguyen and H. H. G. Savenije
Title Page
Abstract Introduction
Conclusions References
Tables Figures
◭ ◮
◭ ◮
Back Close
Full Screen / Esc
Printer-friendly Version
Interactive Discussion
constant tidal average depth along the estuary, NR (–) is the Estuarine Richardson
number given by: NR=∆ρρghQfT
A0E0υ2 0
,T (T) is the tidal period,υ (LT−1) is the tidal velocity
amplitude. In ideal estuaries, the tidal range, the tidal velocity amplitude, the tidal excursion and the depth are constant along the estuary, while the convergent lengths
of the width and the cross-sectional area are equal: b=a. In estuaries where there
5
is a certain degree of damping or amplification, the ratio of H/E is still constant, but
values ofE and υ vary along the estuary. Finally if a6=b there is a bottom slope and
the depth is not constant. In the Mekong estuary branches these situations apply, and subsequently procedures need to be developed to deal with such situations.
The assumption made in Eq. (1) to arrive at the steady state equation for
conserva-10
tion of mass, requires that in the estuary an equilibrium condition is reached between, on the one hand, advective salt transport through the downstream flushing of salt by the fresh water discharge, and on the other hand, the full range of mixing processes. Savenije (2005) proposed an expression derived for the system response time as a function of the steady state salinity distribution in order to investigate how quickly an
15
estuary system adjusts to a new situation. If the time required for the system to adjust is not too long in relation to the variation of the boundary conditions, then a steady state model may be used. The expression reads:
Ts ≈ −
1
QfS L/2
L
Z
L/2
ASdx (9)
Where:Ts (T) is the system response time, which represents the time required for the
20
system to adjust itself from one steady state to another.
HESSD
3, 499–527, 2006Salt intrusion in multi-channel
estuaries
A. D. Nguyen and H. H. G. Savenije
Title Page
Abstract Introduction
Conclusions References
Tables Figures
◭ ◮
◭ ◮
Back Close
Full Screen / Esc
Printer-friendly Version
Interactive Discussion 3 The Mekong Delta in Vietnam
3.1 Overview
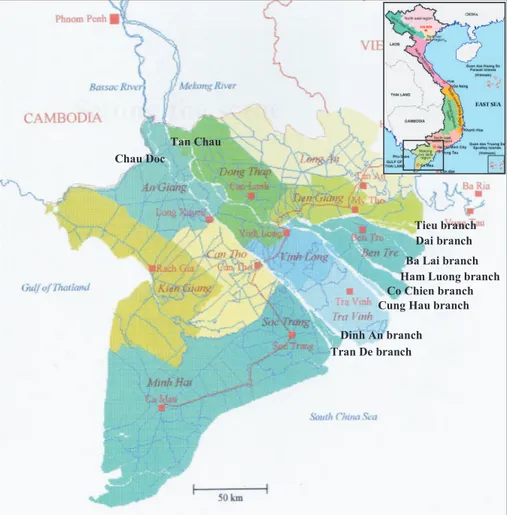
The Mekong river when it enters Vietnam splits into two branches, the Bassac (known as Hau river in Vietnam) and the Mekong (known as Tien river in Vietnam). The two branches form the Mekong delta. The Hau river is the first branch of the Mekong.
5
When the Hau approaches the sea, it splits into two branches: Tran De and Dinh An. The Tien river is the second branch of the Mekong river system. At Vinh Long, the Tien separates into two river branches: Co Chien and My Tho. At a distance of 30 km from the South China Sea, the Co Chien River again splits into two estuary branches, Co Chien and Cung Hau (see Fig. 2). Although there are more estuary branches: Tieu,
10
Dai, Ba Lai and Ham Luong, this paper concentrates on these four estuary branches: Tran De, Dinh An, Cung Hau and Co Chien.
Tides in the South China Sea are predominantly semi-diurnal. Each day the tide has two crests and two troughs, the height of each crest and trough varies from day to day over a period of 15 days. The amplitude can be up to 3 m, while the phase lag between
15
two troughs is half the tidal period. When one trough decreases down, the other trough increases gradually from day to day, and vice versa (Nguyen and Nguyen, 1999).
As a typical delta, the Mekong delta is affected by both river floods and the tide. In the
past (before 1980), every year during the dry season, agricultural areas in the Mekong
delta were affected by salinity, amounting to 1.7–2.1 million ha out of 3.5 million ha. In
20
the 1980’s and 1990’s, a number of salinity control projects were implemented, leading to closure dams and sluice gates in the navigation canals connecting the branches of
the delta. Nowadays, salinity affects only 0.8 million ha every year. However, the fresh
water intakes along the estuary branches are usually affected by high salinity (Nguyen
and Nguyen, 1999). Every year, these intakes have to be closed for considerable
25
periods of time (from some weeks to one or two months) to prevent salt intrusion.
HESSD
3, 499–527, 2006Salt intrusion in multi-channel
estuaries
A. D. Nguyen and H. H. G. Savenije
Title Page
Abstract Introduction
Conclusions References
Tables Figures
◭ ◮
◭ ◮
Back Close
Full Screen / Esc
Printer-friendly Version
Interactive Discussion
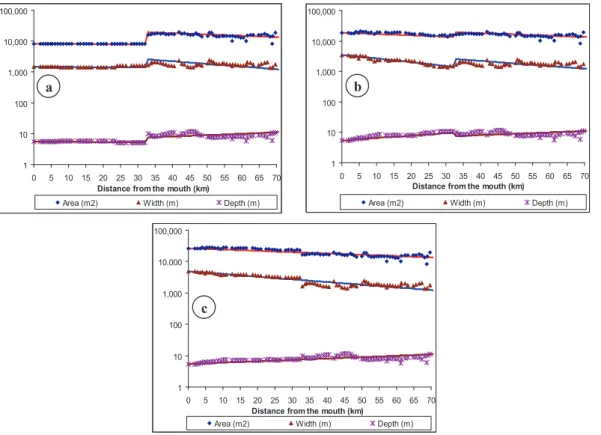
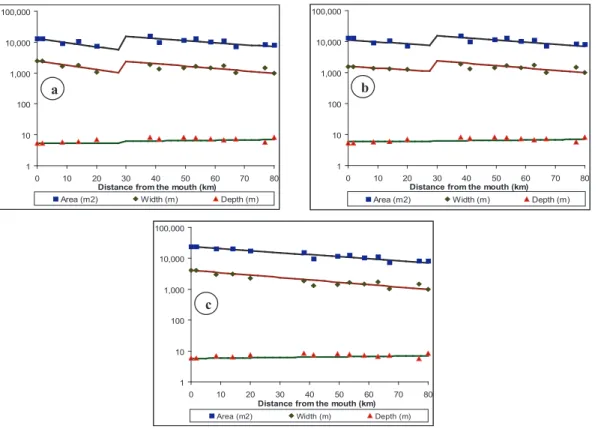
3.2 The shape of the Mekong Delta estuaries
The estuary branches Dinh An, Tran De, Co Chien and Cung Hau have the charac-teristics that we mentioned in the Introduction. We shall investigate if it is possible to combine two branches into one single branch, which would not only simplify the com-putation, but could also enhance the overall performance of the model. Moreover since
5
the estuary system functions as an entity, it could very well be that the description of a branched estuary as one single branch is more in agreement with the physical laws that guide the formation of ebb and flood channels than a separate treatment.
The estuarine characteristics of the Tran De – Dinh An system and the Co Chien – Cung Hau system correspond very well with the exponential functions that follow from
10
the concept of ideal estuaries:
A=A0ln
−x
a
(10)
B=B0ln
−x
b
(11)
and
h=h0ln
x d
(12)
15
Where A (L2), B (L) and h (L) are the area, width and depth at the location x (km)
from the mouth, respectively. A0(L
2
),B0(L) andh0(L) are the area, width and at the
mouth. Finally,a(L),b(L) andd(L) are the area, width and depth convergence length,
respectively. It follows thatd=(a−b)/ab. It can be seen very clearly in Fig. 3, Fig. 4 and
Table 1 that the combined estuary indeed behaves as a single estuary with a regular
20
topography according to Eqs. (10–12).
HESSD
3, 499–527, 2006Salt intrusion in multi-channel
estuaries
A. D. Nguyen and H. H. G. Savenije
Title Page
Abstract Introduction
Conclusions References
Tables Figures
◭ ◮
◭ ◮
Back Close
Full Screen / Esc
Printer-friendly Version
Interactive Discussion 4 Data sets of the Mekong Delta estuaries
Salinity data of the Mekong Delta using in this paper consists of two sets: (i) The first set is from field measurements carried out by the authors during the dry season of 2005 and (ii) the second set is from data of a network of fixed stations.
The authors carried out field measurements on the Hau river in the dry season of
5
2005, using the “moving boat” method described by Savenije (1992). The method can be summarized as follows: A single observer in a small outboard driven boat travels with the tidal wave and measure the entire salt intrusion curve at LWS, and after finishing the LWS measurement, the observer returns to the estuary mouth and repeat the measurement for HWS. The first and second measurements were carried
10
out at the moment of LWS and HWS on 8 April and 9 April during spring tides in the Tran De and Dinh An branches. The third and fourth measurements in the Hau river were conducted on 21 May in Tran De and on 22 May in Dinh An. The field measurements in the Co Chien and Cung Hau estuary branches were carried out on 21 and 22 April at the moments of LWS and HWS during spring tide.
15
The second data set is obtained from the network of fixed stations near intakes and quays, which measure salinity values during the dry season at hourly intervals.
During these measurements, we could manage to measure vertical salinity distri-bution at several points in the Dinh An, Tran De, Co Chien and Cung Hau branches. It appeared that these branches lie in the category of partially-mixed and well-mixed
20
estuaries corresponding to classification of Dyer (1997, chapter 2).
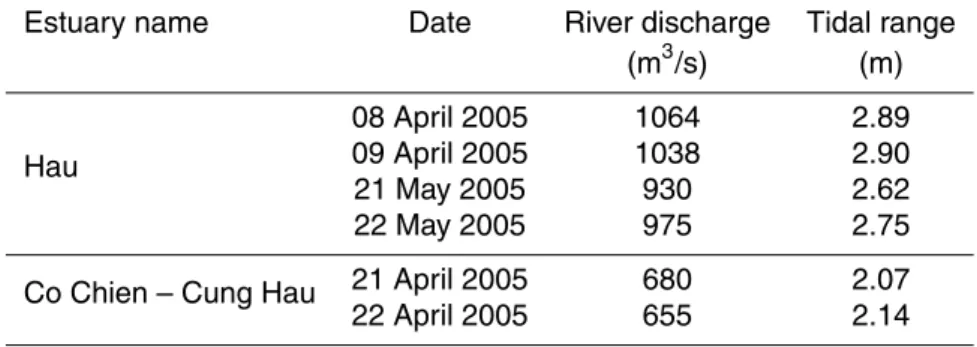
River discharge and tidal data during the 2005’s field measurements provided by the Vietnamese National Hydrometeorology Services can be briefly presented in Table 2. One can see that within two successive days river discharge and tidal range variations are small, and therefore salinity variations are supposed to be small as well.
25
HESSD
3, 499–527, 2006Salt intrusion in multi-channel
estuaries
A. D. Nguyen and H. H. G. Savenije
Title Page
Abstract Introduction
Conclusions References
Tables Figures
◭ ◮
◭ ◮
Back Close
Full Screen / Esc
Printer-friendly Version
Interactive Discussion 5 Salinity computation for the Mekong Delta estuaries
In this section, two approaches shall be used to compute the salinity distribution in the Mekong Delta estuaries.
The first approach considers every single branch as an individual estuary and the Savenije’s method (2005) is used to determine the longitudinal salinity distribution.
5
Because of the similarities between the estuary branches, the second approach con-siders the combination of two estuary branches as a single estuary. Once again, the Savenije’s method is applied under some modifications. Comparing to the first
ap-proach, the second approach offers the better results, therefore it is further validated.
Finally, based on calibrated and validated results of the second approach, a predictive
10
model for the Mekong Delta estuaries is proposed.
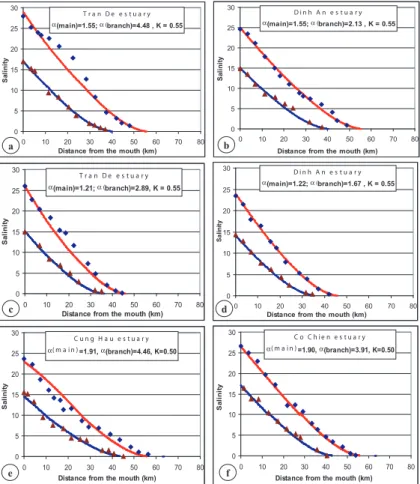
5.1 Approach 1: Analysis of individual branches
The first approach considers every single branch as an individual estuary (i.e. Tran De, Dinh An, Cung Hau, Co Chien). The channel topography of each estuary is shown in Table 1. Using Eqs. (4) and (5), we can compute the longitudinal variation of the salinity
15
in every individual estuary. The calibrated results, based on measurement data of 8, 9, 21, 22 April and 21, 22 May, 2005, are presented in Fig. 5.
We can see from Fig. 5 that the Savenije’s method can be used to describe the salinity distribution in the Hau river and the Co Chien-Cung Hau river. The measured data in the Dinh An estuary branch can be considered to be the best measured data
20
out of four branches as the results of series of boat buoys that gave the authors a clear
view for HWS and LWS moments. We can recognise that the mixing coefficient values
of branches (α (branch) in Fig. 5), are always larger than these values of the main
rivers (α (main) in Fig. 5). It is understandable that since the river discharge is split
over two branches, while the tidal range remains the same,αis bigger in the individual
25
branches than in the main channel.
We can also notice that the mixing coefficient values for the main river channels are
HESSD
3, 499–527, 2006Salt intrusion in multi-channel
estuaries
A. D. Nguyen and H. H. G. Savenije
Title Page
Abstract Introduction
Conclusions References
Tables Figures
◭ ◮
◭ ◮
Back Close
Full Screen / Esc
Printer-friendly Version
Interactive Discussion
more or less the same in all there cases: 1.55 and 1.55 for Tran De and Dinh An on 8 and 9 April; 1.21 and 1.22 for Tran De and Dinh An on 21 and 22 May; and 1.91 and 1.90 for Cung Hau and Co Chien on 21 and 22 April, 2005. It tells us that the estuary system seems to function as an entity.
One other thing we can obtain from the measurement data is that the tidal
ex-5
cursion, which represents the distance that a water particle travels between LWS and HWS, does not appear to be constant. The tidal excursion in the Hau and the Co Chien – Cung Hau branches corresponds very well to the exponential function, i.e. E=E0ln −xe
where E (L) is the tidal excursion at the location x (km) from the
mouth,E0 (L) is the tidal excursion at the mouth and e(L) is the tidal excursion
con-10
vergence length. This could be because of characteristics of branch estuaries and because of the considerable large discharge even during dry seasons.
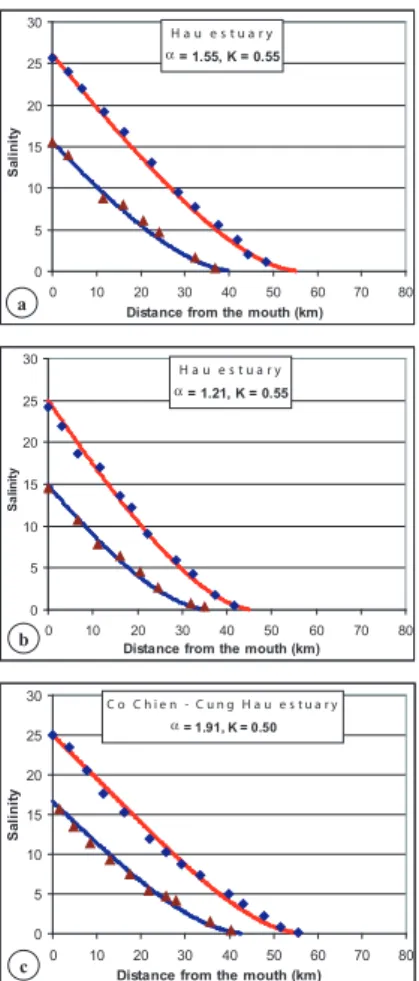
5.2 Approach 2: Combination of two branches into a single estuary
With the consideration from Sect. 5.1 that the estuary system seems to function as an entity, the second approach considers the combination of two branches as a single
15
estuary. The combination of the Dinh An and Tran De branches is named “Combined Hau estuary” and the combination of the Co Chien and Cung Hau branches is named “Combined Co Chien-Cung Hau estuary”. The channel topography of the combined estuaries is shown in Table 1. The salinity of one combined estuary is taken as a weighted mean between the cross-sectional areas of the branches. Using Eqs. (4) and
20
(5), we can compute the longitudinal variation of the salinity in every combined estuary. The calibrated results for the combined estuaries are presented in Fig. 6.
One can see that the method can produce very good results when being applied to the second approach. The overall performance of the model is better than that of the first approach. This underlines the assumption that the estuary system functions as an
25
entity.
For both approaches, theK values of 0.55 and 0.50 for the Hau and the
HESSD
3, 499–527, 2006Salt intrusion in multi-channel
estuaries
A. D. Nguyen and H. H. G. Savenije
Title Page
Abstract Introduction
Conclusions References
Tables Figures
◭ ◮
◭ ◮
Back Close
Full Screen / Esc
Printer-friendly Version
Interactive Discussion
The K values imply that the Hau and Co Chien estuaries are in the balance of tide
driven mixing and density driven mixing mechanisms. In the Hau estuary, it seems that the density driven mixing mechanism plays a slightly bigger role because of the large fresh discharge.
5.3 Validation of Approach 2
5
As we mentioned in Sect. 4, in the Mekong delta, there is a network of fixed stations near intakes and quays, which measure salinity values during the dry season at hourly intervals. Unfortunately, this information is not ideal since it does not permit the di-rect derivation of the longitudinal distribution of the maximum and minimum salinity (i.e. salinity at LWS and HWS), partly because they are often not located near the main
10
current (sometimes even within a canal opening or intake), and partly because of the timing. However, we shall use these maximum and minimum daily values as indicators for the HWS and LWS salinity, to validate the model.
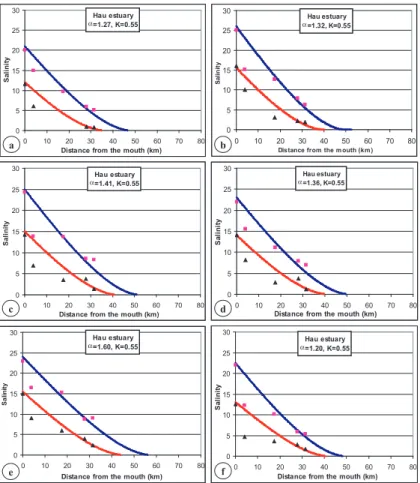
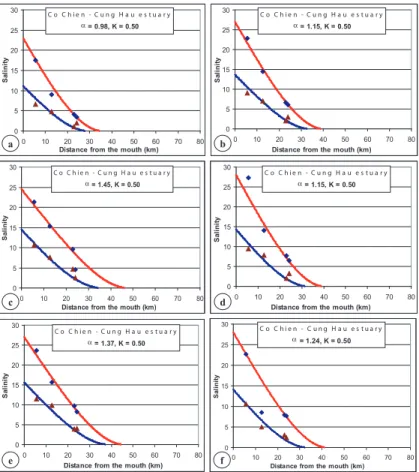
The validated results are presented in Fig. 7 (for the combined Hau estuary) and Fig. 8 (for the combined Co Chien – Cung Hau estuary).
15
Generally, the model performs reasonably well, especially at HWS moments. At several stations, e.g. TraKha (4 km from the Dinh An mouth) and Hung My (12.7 km from the Co Chien mouth), the salinity values are too small and inaccurate. This is to be expected since these stations are located in the mouth of a canal or close to the river banks.
20
5.4 Predictive model
Based on calibrated and validated results of the second approach (see Sects. 5.2 and 5.3), we can use Eqs. (7) and (8) to turn the salinity model of the Mekong Delta into a
predictive model. The values ofK, obtained from calibration, are 0.55 and 0.50 for the
Hau and the CoChien-CungHau respectively, which compare fairly well with predicted
25
values of 0.42 and 0.45, which are computed by Eq. (8). Similarly, the values ofD0HW S
HESSD
3, 499–527, 2006Salt intrusion in multi-channel
estuaries
A. D. Nguyen and H. H. G. Savenije
Title Page
Abstract Introduction
Conclusions References
Tables Figures
◭ ◮
◭ ◮
Back Close
Full Screen / Esc
Printer-friendly Version
Interactive Discussion
for the Hau estuary and the Co Chien – Cung Hau estuary should be compared to
Eq. (7). We notice that the calibrated values ofD0HW S for the measurement described
in Figs. 7 and 8 fit Eq. (7) well (see Fig. 9) if we use b (i.e. the width convergence
length) instead ofa (i.e. the area convergence length) and if the average depth over
the salinity intrusion length is taken instead of the depth at the estuary mouth.
5
For the Hau estuary and the Co Chien-Cung Hau estuary, the predictive equation then reads:
D0HW S =1400h
b q
NR(υ0E0) (13)
In Fig. 10, these results are plotted together with the estuaries presented by Savenije (2005). What we observe in Fig. 10 is that the salt intrusion lengths at HWS of the Hau
10
and the Co Chien-Cung Hau computed by the modified predictive model using Eq. (13) and Eq. (6) (blue triangles) plot very well within the set. To permit a good comparison, the intrusion lengths in the other estuaries have also been computed using Eq. (13).
6 Discussion
One thing we have to bear in mind is that the method presented in the Sect. 5 is
15
applied for a steady state salinity distribution. Estuaries require a certain time to adjust to changes in order to reach the steady state equilibrium. Savenije (2005) found that
the system response times for different estuaries are in order of magnitude of days to
months. From Eq. (9), we could compute the system response time for the Mekong estuaries. The computed system response times for the Hau estuary on 8 April, 2005
20
and 21 May, 2005 and the Co Chien-Cung Hau estuary on 21 April, 2005 are 7 days, 18 days and 3 days, respectively. These values indicate that the estuary system adjusts itself rather quickly to a new situation, and doesn’t lag far behind an equilibrium state during the dry season. Therefore, we can use the steady state method to compute salinity distribution in the Mekong estuaries.
25
HESSD
3, 499–527, 2006Salt intrusion in multi-channel
estuaries
A. D. Nguyen and H. H. G. Savenije
Title Page
Abstract Introduction
Conclusions References
Tables Figures
◭ ◮
◭ ◮
Back Close
Full Screen / Esc
Printer-friendly Version
Interactive Discussion
As we mentioned in Sect. 5.3, in the Mekong delta there is a network of fixed stations along the banks, which measure salinity values during the dry season. These stations provide hourly salinity values. Unfortunately, these values are not very adequate for the HWS-LWS method. For validation, we took the maximum and minimum daily values of the salinity at these stations and we assumed that these values are more or less close
5
to HWS and LWS values in the same day. This assumption is rather weak because the stations are generally not located near the centre of the stream but rather in the lee, near intakes and canals.
The Van der Burgh’s coefficient,K, has been taken from the calibrated process from
field data in 2005. These values compare fairly well with the predictive Eq. (8). We
10
should realise that the predictive equation forK is still rather weak and may have to
be improved in the future. Therefore, the calibratedK values for the Hau and the Co
Chien – Cung Hau estuaries are considered to be the most reliable ones.
There are several limitations in this study. Firstly, there is lack of updated topographi-cal data of the Mekong Delta. The data used in this paper are obtained from the survey
15
of 1991, when the biggest measurement campaign so far was carried out under the sponsorship of the Finnish government. Although later, the Mekong Committee devel-oped a topographical database of the lower Mekong Delta, however this database is essentially composed of the data of 1991 with only minor modification and updates. As we know, the Mekong Delta is morphologically active and the topography is changing
20
due to high sediment transport capacity of the river. As a result, we expect modifica-tions in the delta topography. As a result, there still is room for improvement of the salinity model through topographical data.
Secondly, there is sensitivity of the predictive model to a number of parameters that
have a certain degree of uncertainty. These are the mean estuary depthh, the river
25
dischargeQf and the tidal excursion E0. The estuary depth has a high impact on the
predictive Eq. (13) for the dispersion at the estuary mouth (to the power 3/2). There is uncertainty in the determination of the average depth over the cross-section, particu-larly when (for instance in the Dinh An) there is a shallow part and a deep part, and
HESSD
3, 499–527, 2006Salt intrusion in multi-channel
estuaries
A. D. Nguyen and H. H. G. Savenije
Title Page
Abstract Introduction
Conclusions References
Tables Figures
◭ ◮
◭ ◮
Back Close
Full Screen / Esc
Printer-friendly Version
Interactive Discussion
when the estuary depth is not constant (there is a slight bottom slope). Similarly, there
is an effect of a possible error in the river discharge. From existing hydrodynamic
mod-els, we derived a discharge ratio between the Hau and the Tien rivers of 53/47 of the total discharge. From updated computations (Southern Institute for Water Resources Research, Vietnam, unpublished), this ratio has been changed to 55/45 or even 60/40
5
as a result of the construction of inland canals and channel networks, which convey water from the Hau to the Tien river. If we take the values of 60/40, we get slighter more satisfactory results. However, compared to the influence of the average depth (power 3/2), the influence of the discharge is much less (power 1/2). Considering that the discharge can have an error in the order of 10% and the average depth in the order
10
of 10% or more, the average depth seems to be the most important factor. Of course the average depth can also be estimated indirectly, e.g. through the analytical relations for tidal damping and wave propagation presented by Savenije (2005, 2001), Savenije and Veling (2005), but this will require additional observations of tidal damping, wave propagation and longitudinal salinity distributions. Additional field measurements are
15
scheduled for the dry season of 2006 to improve the situation. These measurements shall be carried out on the same day for 2 branches (i.e. Dinh An and Tran De, Cung Hau and Co Chien).
7 Conclusion
In this paper, the theory for the computation of salt intrusion in single alluvial estuaries
20
described by Savenije (2005) is for the first time applied to a multi-channel estuary, the Mekong delta, Vietnam. The Mekong Delta is a riverine multi-channel estuary with increasing depth in upstream direction and damped tidal excursion. Although the theory has not been developed for this situation, it is well applicable under some modifications. These modifications are that the average depth over the branch is used
25
in the predictive model in stead of the depth at the estuary mouth, and that the width convergence length is used instead of the area convergence length.
HESSD
3, 499–527, 2006Salt intrusion in multi-channel
estuaries
A. D. Nguyen and H. H. G. Savenije
Title Page
Abstract Introduction
Conclusions References
Tables Figures
◭ ◮
◭ ◮
Back Close
Full Screen / Esc
Printer-friendly Version
Interactive Discussion
In view of the similar hydraulic, topographical and salinity characteristics of the branched estuaries in the Mekong, it has been assumed that the multi-channel es-tuarine system functions as an entity and that two branches can be combined into a single estuary branch. This procedure has been successfully applied and tested in the Dinh An and Tran De branches (the combined estuary named the Hau estuary) and
5
the Co Chien and Cung Hau branches (the combined estuary named the Co Chien-Cung Hau estuary).
Based on salinity measurements during the dry season of April and May 2005, an analytical model has been developed to compute the longitudinal salinity distribution (at HWS and LWS) for the combined estuaries, e.g. the Hau estuary and the Co
Chien-10
Cung Hau estuary. The model has also been validated by data of the dry seasons in 1998 and 1999. The overall results of salinity computation indicate that the assump-tion of combined branches is acceptable and that the simplified method can produce satisfactory results for a complex system such as the Mekong delta.
Acknowledgements. The authors would like to acknowledge the Southern Institute for Water
15
Resources Research (SIWRR), Ho Chi Minh City, Vietnam for their enthusiastic supports during the data collection period and the field measurement campaign. We are particularly grateful to Le Sam, Tang Duc Thang and Nguyen Van Sang (SIWRR), who have kindly provided the database of the Mekong Delta salinity, topography and hydrology.
References 20
Dyer, K. R.: Estuaries, A Physical Introduction, second ed., John Wiley, London, 195 pp, 1997. Nguyen, A. N. and Nguyen, V. L.: Salt water intrusion disaster in Vietnam, UNDP Project No
VIE/97/002, HCM City, Vietnam (in Vietnamese and English), 1999.
Savenije, H. H. G.: A one-dimensional model for salinity intrusion in alluvial estuaries, J. Hy-drol., 85, 87–109, 1986.
25
Savenije, H. H. G.: Salt intrusion model for high-water slack, low-water slack and mean tide on spreadsheet, J. Hydrol., 107, 9–18, 1989.
HESSD
3, 499–527, 2006Salt intrusion in multi-channel
estuaries
A. D. Nguyen and H. H. G. Savenije
Title Page
Abstract Introduction
Conclusions References
Tables Figures
◭ ◮
◭ ◮
Back Close
Full Screen / Esc
Printer-friendly Version
Interactive Discussion
Savenije, H. H. G.: Rapid Assessment Technique for Salt intrusion in alluvial estuaries, PhD thesis, IHE report series, No. 27, International Institute for Infrastructural, Hydraulic and Environmental Engineering, Delft, The Netherlands, 1992.
Savenije, H. H. G.: Predictive model for salt intrusion in estuaries, J. Hydrol., 148, 203–218, 1993.
5
Savenije, H. H. G.: A simple analytical expression to describe tidal damping and amplification, J. Hydrol., 243, 205–215, 2001.
Savenije, H. H. G.: Salinity and Tides in Alluvial Estuaries, Elsevier, Amsterdam, 197pp, 2005. Savenije, H. H. G. and Veling, E. J. M.: Relation between tidal damping and wave celerity in
estuaries, J. Geophys. Res., 110, C04007, 1–10, doi:10.1029/2004JC002278, 2005.
10
Van der Burgh, P.: Ontwikkeling van een methode voor het voorspellen van zoutverdelingen in estuaria, kanalen en zeeen, Rijkwaterstaat Rapport 10-72 (in Dutch), 1972.
HESSD
3, 499–527, 2006Salt intrusion in multi-channel
estuaries
A. D. Nguyen and H. H. G. Savenije
Title Page
Abstract Introduction
Conclusions References
Tables Figures
◭ ◮
◭ ◮
Back Close
Full Screen / Esc
Printer-friendly Version
Interactive Discussion
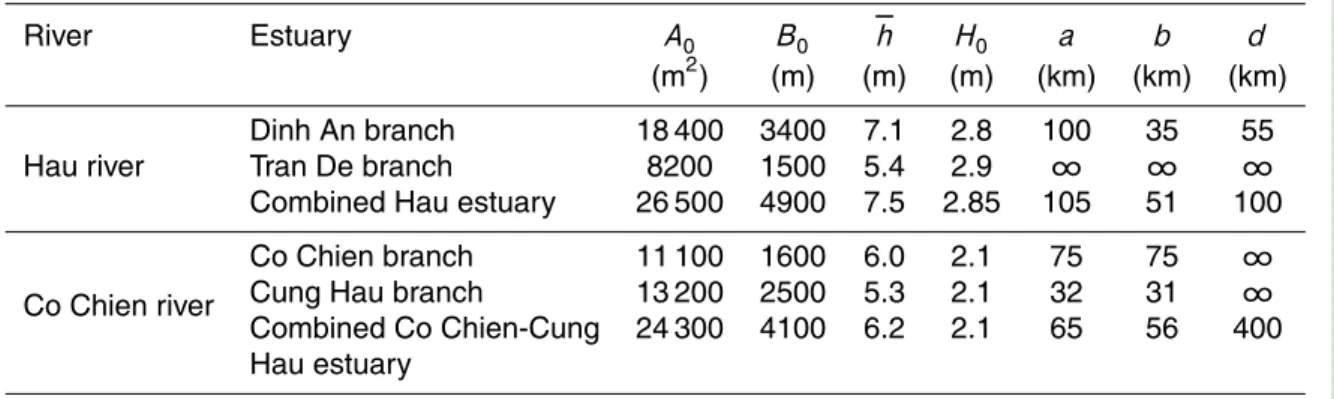
Table 1.Estuarine characteristics of 4 branches in the Mekong Delta.
River Estuary A0 B0 h H0 a b d
(m2) (m) (m) (m) (km) (km) (km)
Dinh An branch 18 400 3400 7.1 2.8 100 35 55
Hau river Tran De branch 8200 1500 5.4 2.9 ∞ ∞ ∞
Combined Hau estuary 26 500 4900 7.5 2.85 105 51 100
Co Chien branch 11 100 1600 6.0 2.1 75 75 ∞
Cung Hau branch 13 200 2500 5.3 2.1 32 31 ∞
Co Chien river
Combined Co Chien-Cung 24 300 4100 6.2 2.1 65 56 400
Hau estuary
Note: The values for the width, depth and cross-sectional area were measured at Mean Sea
Level (MSL).H0is the tidal range at the mouth.
HESSD
3, 499–527, 2006Salt intrusion in multi-channel
estuaries
A. D. Nguyen and H. H. G. Savenije
Title Page
Abstract Introduction
Conclusions References
Tables Figures
◭ ◮
◭ ◮
Back Close
Full Screen / Esc
Printer-friendly Version
Interactive Discussion
Table 2.River discharge and tidal range data in the Mekong estuaries.
Estuary name Date River discharge Tidal range
(m3/s) (m)
08 April 2005 1064 2.89
09 April 2005 1038 2.90
Hau
21 May 2005 930 2.62
22 May 2005 975 2.75
21 April 2005 680 2.07
Co Chien – Cung Hau
22 April 2005 655 2.14
HESSD
3, 499–527, 2006Salt intrusion in multi-channel
estuaries
A. D. Nguyen and H. H. G. Savenije
Title Page
Abstract Introduction
Conclusions References
Tables Figures
◭ ◮
◭ ◮
Back Close
Full Screen / Esc
Printer-friendly Version
Interactive Discussion
CoChien river estuary, Mekong Delta, Vietnam.
Tanintharyi river
estuary, Myanmar Yangtze river estuary, China Hau river estuary,
Mekong Delta, Vietnam.
Fig. 1.Some examples of branched estuaries (source: Google Earth).
HESSD
3, 499–527, 2006Salt intrusion in multi-channel
estuaries
A. D. Nguyen and H. H. G. Savenije
Title Page
Abstract Introduction
Conclusions References
Tables Figures
◭ ◮
◭ ◮
Back Close
Full Screen / Esc
Printer-friendly Version
Interactive Discussion Tran De branch Dinh An branch
Cung Hau branch Co Chien branch Ham Luong branch Chau Doc
Tan Chau
Tieu branch Dai branch Ba Lai branch
Fig. 2.The Mekong delta.
HESSD
3, 499–527, 2006Salt intrusion in multi-channel
estuaries
A. D. Nguyen and H. H. G. Savenije
Title Page
Abstract Introduction
Conclusions References
Tables Figures
◭ ◮
◭ ◮
Back Close
Full Screen / Esc
Printer-friendly Version
Interactive Discussion
1 10 100 1,000 10,000 100,000
0 5 10 15 20 25 30 35 40 45 50 55 60 65 70
Distance from the mouth (km)
Area (m2) Width (m) Depth (m) b
1 10 100 1,000 10,000 100,000
0 5 10 15 20 25 30 35 40 45 50 55 60 65 70
Distance from the mouth (km)
Area (m2) Width (m) Depth (m) c
1 10 100 1,000 10,000 100,000
0 5 10 15 20 25 30 35 40 45 50 55 60 65 70
Distance from the mouth (km)
Area (m2) Width (m) Depth (m) a
Fig. 3. Shape of the individual branches (a)Tran De and(b)Dinh An. (c)Shape of the Hau
(combined Tran De and Dinh An) estuary, showingA(diamonds),B(triangles) andh(crosses).
HESSD
3, 499–527, 2006Salt intrusion in multi-channel
estuaries
A. D. Nguyen and H. H. G. Savenije
Title Page
Abstract Introduction
Conclusions References
Tables Figures
◭ ◮
◭ ◮
Back Close
Full Screen / Esc
Printer-friendly Version
Interactive Discussion
1 10 100 1,000 10,000 100,000
0 10 20 30 40 50 60 70 80
Distance from the mouth (km)
Area (m2) Width (m) Depth (m)
a
1 10 100 1,000 10,000 100,000
0 10 20 30 40 50 60 70 80
Distance from the mouth (km)
Area (m2) Width (m) Depth (m)
b
1 10 100 1,000 10,000 100,000
0 10 20 30 40 50 60 70 80
Distance from the mouth (km)
Area (m2) Width (m) Depth (m) c
Fig. 4. Shape of the individual branches: (a)Cung Hau and(b) Co Chien. (c) Shape of the
Co Chien – Cung Hau (combined Co Chien and Cung Hau) estuary, showingA(squares), B
(diamonds) andh(triangles).
HESSD
3, 499–527, 2006Salt intrusion in multi-channel
estuaries
A. D. Nguyen and H. H. G. Savenije
Title Page Abstract Introduction Conclusions References Tables Figures ◭ ◮ ◭ ◮ Back Close
Full Screen / Esc
Printer-friendly Version
Interactive Discussion
T r a n D e e s t u a r y
α(main)=1.55; α (branch)=4.48 , K = 0.55
0 5 10 15 20 25 30
0 10 20 30 40 50 60 70 80 Distance from the mouth (km)
Sa
lin
ity
D i n h A n e s t u a r y
α(main)=1.55; α (branch)=2.13 , K = 0.55
0 5 10 15 20 25 30
0 10 20 30 40 50 60 70 80 Distance from the mouth (km)
Sa
lin
ity
T r a n D e e s t u a r y α(main)=1.21; α (branch)=2.89, K = 0.55
0 5 10 15 20 25 30
0 10 20 30 40 50 60 70 80 Distance from the mouth (km)
S
al
in
ity
D i n h A n e s t u a r y
α(main)=1.22; α (branch)=1.67 , K = 0.55
0 5 10 15 20 25 30
0 10 20 30 40 50 60 70 80 Distance from the mouth (km)
Sa
lin
ity
C u n g H a u e s t u a r y
α( m a i n )=1.91, α(branch)=4.46, K=0.50
0 5 10 15 20 25 30
0 10 20 30 40 50 60 70 80 Distance from the mouth (km)
S
al
in
ity
C o C h i e n e s t u a r y
α( m a i n )=1.90, α(branch)=3.91, K=0.50
0 5 10 15 20 25 30
0 10 20 30 40 50 60 70 80 Distance from the mouth (km)
S
al
in
ity
a b
c d
e f
Fig. 5.Salinity distribution of individual branches:(a)Tran De on 8 April,(b)Dinh An on 9 April,
(c)Tran De on 21 May, (d)Dinh An on 22 May, (e) Cung Hau on 21 April and(f) Co Chien
on 22 April 2005, showing values of measured HWS (diamonds), measured LWS (triangles), calibrated HWS (red curve) and calibrated LWS (blue curve).
HESSD
3, 499–527, 2006Salt intrusion in multi-channel
estuaries
A. D. Nguyen and H. H. G. Savenije
Title Page
Abstract Introduction
Conclusions References
Tables Figures
◭ ◮
◭ ◮
Back Close
Full Screen / Esc
Printer-friendly Version
Interactive Discussion H a u e s t u a r y
α = 1.55, K = 0.55
0 5 10 15 20 25 30
0 10 20 30 40 50 60 70 80 Distance from the mouth (km)
Sa
lin
ity
H a u e s t u a r y α = 1.21, K = 0.55
0 5 10 15 20 25 30
0 10 20 30 40 50 60 70 80 Distance from the mouth (km)
Sa
lin
ity
C o C h i e n - C u n g H a u e s t u a r y α = 1.91, K = 0.50
0 5 10 15 20 25 30
0 10 20 30 40 50 60 70 80
Distance from the mouth (km)
S
al
in
ity
a
b
c
Fig. 6. Salinity distribution of
(a) The combined Hau estuary
(combination of Tran De and Dinh An branches) on 8 and 9
April, 2005; (b) The combined
Hau estuary on 21 and 22 May,
2005; and (c) The combined
Co Chien – Cung Hau estuary (combination of Cung Hau and Co Chien branches) on 21 and 22 April, 2005, showing values of measured HWS (diamonds), measured LWS (triangles), cali-brated HWS (red curve) and cal-ibrated LWS (blue curve).
HESSD
3, 499–527, 2006Salt intrusion in multi-channel
estuaries
A. D. Nguyen and H. H. G. Savenije
Title Page Abstract Introduction Conclusions References Tables Figures ◭ ◮ ◭ ◮ Back Close
Full Screen / Esc
Printer-friendly Version
Interactive Discussion
Hau estuary
α=1.27, K=0.55
0 5 10 15 20 25 30
0 10 20 30 40 50 60 70 80
Distance from the mouth (km)
Sa
lin
ity
Hau estuary
α=1.32, K=0.55
0 5 10 15 20 25 30
0 10 20 30 40 50 60 70 80
Distance from the mouth (km)
Sa
lin
ity
Hau estuary
α=1.41, K=0.55
0 5 10 15 20 25 30
0 10 20 30 40 50 60 70 80
Distance from the mouth (km)
Sa
lin
ity
Hau estuary
α=1.36, K=0.55
0 5 10 15 20 25 30
0 10 20 30 40 50 60 70 80
Distance from the mouth (km)
S
al
in
ity
Hau estuary
α=1.60, K=0.55
0 5 10 15 20 25 30
0 10 20 30 40 50 60 70 80
Distance from the mouth (km)
Sa
lin
ity
Hau estuary
α=1.20, K=0.55
0 5 10 15 20 25 30
0 10 20 30 40 50 60 70 80
Distance from the mouth (km)
S
al
in
ity
a b
c d
e f
Fig. 7.Validation results of the Hau (combined Tran De and Dinh An) estuary:(a)on 01 March
1998;(b)5 April 1998;(c)7 April 1998;(d)2 March 1999;(e)20 March 1999 and(f)16 April
1999, showing values of measured HWS (diamonds), measured LWS (triangles), calibrated HWS (blue curve) and calibrated LWS (red curve).
HESSD
3, 499–527, 2006Salt intrusion in multi-channel
estuaries
A. D. Nguyen and H. H. G. Savenije
Title Page Abstract Introduction Conclusions References Tables Figures ◭ ◮ ◭ ◮ Back Close
Full Screen / Esc
Printer-friendly Version
Interactive Discussion C o C h i e n - C u n g H a u e s t u a r y
α = 0.98, K = 0.50
0 5 10 15 20 25 30
0 10 20 30 40 50 60 70 80
Distance from the mouth (km)
Sa
lin
ity
C o C h i e n - C u n g H a u e s t u a r y α = 1.15, K = 0.50
0 5 10 15 20 25 30
0 10 20 30 40 50 60 70 80
Distance from the mouth (km)
Sa
lin
ity
C o C h i e n - C u n g H a u e s t u a r y α = 1.45, K = 0.50
0 5 10 15 20 25 30
0 10 20 30 40 50 60 70 80
Distance from the mouth (km)
S
al
in
ity
C o C h i e n - C u n g H a u e s t u a r y α = 1.15, K = 0.50
0 5 10 15 20 25 30
0 10 20 30 40 50 60 70 80
Distance from the mouth (km)
S
al
in
ity
C o C h i e n - C u n g H a u e s t u a r y α = 1.37, K = 0.50
0 5 10 15 20 25 30
0 10 20 30 40 50 60 70 80
Distance from the mouth (km)
S
al
in
ity
C o C h i e n - C u n g H a u e s t u a r y
α = 1.24, K = 0.50
0 5 10 15 20 25 30
0 10 20 30 40 50 60 70 80
Distance from the mouth (km)
Sa
lin
ity
a b
c d
e f
Fig. 8. Validation results of the Co Chien – Cung Hau (combined Cung Hau and Co Chien)
estuary: (a)on 16 March 1998; (b)2 April 1998;(c)15 April 1998; (d)2 March 1999;(e) 21
March 1999 and(f)19 April 1999, showing values of measured HWS (diamonds), measured
LWS (triangles), calibrated HWS (red curve) and calibrated LWS (blue curve).
HESSD
3, 499–527, 2006Salt intrusion in multi-channel
estuaries
A. D. Nguyen and H. H. G. Savenije
Title Page
Abstract Introduction
Conclusions References
Tables Figures
◭ ◮
◭ ◮
Back Close
Full Screen / Esc
Printer-friendly Version
Interactive Discussion 0
500 1000 1500 2000
0 500 1000 1500 2000
D(0) calibrated (m2/s)
D
(0
) c
om
pu
te
d
(m
2/
s)
Hau estuary
Line of perfect agreement Co Chien-Cung Hau estuary
Fig. 9.Empirical relation forDHW S0 for the Hau estuary and the Co Chien-Cung Hau estuary.
HESSD
3, 499–527, 2006Salt intrusion in multi-channel
estuaries
A. D. Nguyen and H. H. G. Savenije
Title Page
Abstract Introduction
Conclusions References
Tables Figures
◭ ◮
◭ ◮
Back Close
Full Screen / Esc
Printer-friendly Version
Interactive Discussion
0 20 40 60 80 100
0 20 40 60 80 100
Measured intrusion length (km)
C
om
pu
te
d
in
tr
us
io
n
le
ng
th
(k
m
)
Other estuaries Perfect agreement Mekong estuaries
Fig. 10.Salt intrusion length at HWS according to the modified predictive model, applied to the
Mekong and other estuaries described by Savenije (2005).