ASIA PACIFIC JOURNAL of MEDICAL TOXICOLOGY APJMT 1;1 www.mums.ac.ir/j-apjmt DECEMBER, 2012
Abstract
Background:Childhood poisoning is a significant international health concern. Very little is known about trends in exposures within schools and preschools. The objectives of this study were to investigate the data recorded by the New Zealand National Poisons Centre (NPC) on these types of exposures over a 21 year period (1989 to 2009) and to determine trends and propose strategies to reduce the exposures.
Methods:Call information regarding human poison exposure at preschools and schools from Jan1st 1989 to Dec 31st 2009 were extracted from the dataset held by the NPC. The number of calls received by the NPC relating to the exposures was plotted against year as totals and then categorized according to gender. The number of calls related to each substance type for each year, and the number of calls related to each age group for each year were quantified.
Results: There were 3632 calls over this period. In every year studied, there were more calls relating to males than females. Household items were responsible for 31% of exposures, followed by plants (20%), industrial items (14%) and therapeutic agents (14%). Almost one quarter of all exposures occurred in the 13 year old age group. Further investigation of this group, showed that the causes of exposures included “splash” incidents (27%), “pengestion” (pen breaking in mouth and releasing contents) (16%), “exploratory” (5%) and “prank” (4%).
Conclusion: Identification of these areas allows recommendations to be made including feedback to teachers about exposure risks, storage and access of science, cleaning and art supplies.
Keywords:Poisoning; Childhood; Adolescent; Poison centre; School
What Can We Learn from 21 Years of School Poisonings
in New Zealand?
RHIANNON BRAUND1,*, BENNY PAN1, LUCY SHIEFFELBIEN2, WAYNE TEMPLE2
10 1
School of Pharmacy, University of Otago, New Zealand 2
National Poisons Centre, University of Otago, New Zealand
*
Correspondence to: Rhiannon Braund , School of Pharmacy, University of Otago, PO Box 56, Dunedin 9054, New Zealand. Tel: +64 3 479 7240, Fax: +64 3 479 7034, E-mail: [email protected]
Received 24 August 2012; Accepted 10 November 2012
Childhood poisoning is a significant international health concern with poisonings in children and adolescents leading to approximately 45000 deaths annually worldwide (1). However, the mortality data does not show the full picture of exposures and the associated morbidity and “near miss” events. Hospitalization data may be more applicable, but this data is not consistently reported and so studies vary in their incidence rates, particularly in New Zealand. One study reported that there were 4880 children hospitalized between 1987 and 1996 in New Zealand (2), although a further study showed that there were 7354 hospitalizations and 91 deaths of children aged 0-12 between 1993 and 1997 (3).
Nevertheless, these data do not show the full picture and frequency of toxic exposures and childhood poisonings that actually occur. The establishment of dedicated poison centres, and their databases have been useful to identify particular trends and more importantly to develop potential strategies for successful primary injury prevention (4).
The New Zealand National Poisons Centre (NPC) is the only poison centre in New Zealand. In 2009 alone, the NPC wwwwwwwwwwwwwwwwwwwwwwwwwww
received 14,747 calls relating to children and adolescents 18 years and under. This national dataset allows for the identification of trends and the development of strategies that can be targeted to reduce the exposure patterns.
Several studies have reported circumstances leading to childhood poisonings at home (5), however, there are few studies investigating the epidemiological aspects of childhood poisoning in schools and preschools. In one study in Texas, during 1998 to 2002; in which exposures of school children (6-19 yrs) were investigated, it was found that males were more likely to be involved in “school” exposures compared to “non-school” exposures (6). Furthermore, it was shown that only 25% of subjects were involved with therapeutic agents and there were an increased proportion of “intentional” exposures at schools (6).
Considering the fact that children spend many hours at schools and preschools, it may be likely that children are exposed to a variety of substances including medications, chemicals and plants. Additionally, caregivers may not be so vigilant; therefore it is important to recognize the ways that poisoning exposures occur.
The aim of this study was to determine the profile of wwwwwwwwwwwwwwwwwwwwwwwwwwww
INTRODUCTION
11 21 Years of School Poisonings in New Zealand
R. Braund et al.
ingestions reported to the NPC in New Zealand originating from schools and preschools during 1989 to 2009. Specifically, identifying the impact of gender, age and agents involved in this type of poisoning and so the development of targeted strategies would be possible.
Inclusion and exclusion criteria
As a standard practice, all available information from calls received by the NPC was entered into an electronic database at the time of call.
For this investigation, call information regarding human poison exposure at preschools and schools from Jan 1st 1989 to Dec 31st 2009 were extracted. The four variables used for analysis were year of exposure, age in years, gender and substance classification (as defined by the NPC recording categories). These categories include agricultural (e.g. pesticide and rodenticide), animal (e.g. spider bite), cosmetic (e.g. nail polish and perfume), fungus (e.g. toadstool), household (e.g. cleaning products), industrial (e.g. sulfuric acid), miscellaneous, plant and therapeutics (e.g. medications). If in any recorded exposure one or more variables were missed, the case was excluded from analysis.
Data analysis
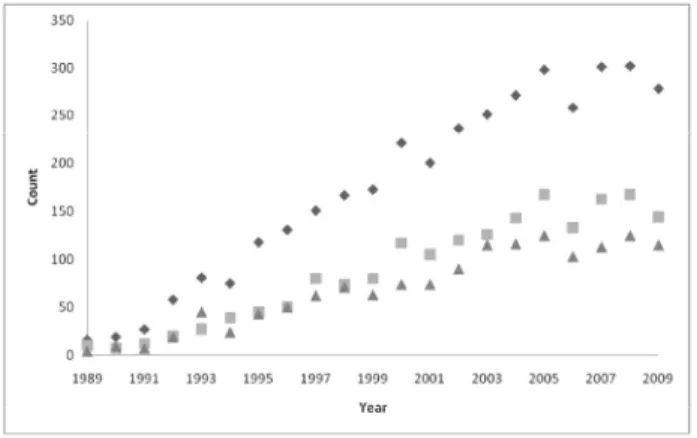
The number of calls received by the NPC relating to the exposures was plotted against year, as totals and then categorized according to gender. The annual number of calls related to each substance type and the annual number of calls related to each age group for each year were quantified. During this study, an over-representation in one age group was identified. A further analysis was conducted on this subset of data to determine the causes of exposure (if available).
The causes of poisonings consisted of the following categories: “exploratory” (intentional inhalation/ingestion, ingestion of plants/insects), “hand to mouth transfer” (i.e. handling substance and then unintentional taking the contaminated hand into mouth), “medicine information enquiry” (a call to the NPC to gather information for research projects etc), “peer pressure” (being encouraged to ingest poisoned substance), “prank” (i.e. chemicals added to drinking bottles and a range of potentially dangerous situations intended as humor), “pengestion” (pen breaking wwwwwwwwwwwwwwwwwwwwwww
in mouth releasing contents), “splash” (i.e. chemicals, aerosol paint being spilled onto skin or face), “therapeutic” (i.e. accidental or intentional overdose), and “unknown” (where the commentary did not provide enough information).
The total number of calls to the NPC related to school and preschool exposures between 1989 and 2009 was 3632 which 3060 of them included all required information (year of exposure, age, gender and substance classification). The number of calls per year ranged from 16 in 1989 to a peak of 302 in 2008 as shown in Figure 1. Figure 1 also shows that in almost every year, there were more calls relating to males than females.
Household agents were responsible for the highest number of reported exposures (n=1139, 31%), followed by plants (20%), industrial (14%) and therapeutic (14%) agents as shown in table 1.
Figure 2 shows the frequency of exposures with respect to age and year. The highest frequency of exposures (733 (24%)) occurred within the 13 year old age group. Considering this over-representation, further analysis was conducted in this category.
Of these 733 exposures, 373 were male, 351 were female wwwwwwwwwwwwwwwwwwwwwwwww
Table 1. Annual distribution (%) of preschool and school exposures among children age 0-18 years reported to New Zealand’s National Poisons Centre by substance category
89 90 91 92 93 94 95 96 97 98 99 00 01 02 03 04 05 06 07 08 09 Total
AGRICULTURAL 6 16 0 12 1 4 6 5 5 2 1 1 2 6 9 5 6 4 4 5 9 5
ANIMAL 0 0 0 0 0 0 0 1 1 1 1 1 2 2 2 1 1 1 1 0 0 1
COSMETIC 6 0 0 3 4 3 1 2 5 3 3 5 5 3 2 3 2 3 2 5 4 3
FUNGUS 0 5 0 2 2 3 3 2 1 4 2 4 4 1 5 2 4 5 4 4 1 3
HOUSEHOLD 38 21 19 22 22 33 26 28 30 28 38 31 28 35 37 31 30 36 30 31 33 31 INDUSTRIAL 6 32 44 24 35 24 28 24 17 21 17 19 12 6 8 11 11 9 13 11 9 14 MISCELLANEOUS 6 0 4 0 2 4 3 5 6 8 6 5 14 10 9 10 10 9 9 7 9 8 PLANT 19 16 33 29 23 23 24 23 24 18 17 22 22 23 18 21 19 14 23 17 19 20 THERAPEUTIC 19 11 0 7 10 7 10 11 12 15 14 13 13 14 10 15 16 19 13 19 15 14 n = 16 19 27 58 81 75 118 131 151 167 173 221 200 236 251 271 298 258 301 302 278 3632
quarter (27%) of cases were splash-related incidents that occurred often in science classes. Following this, the next reason (16%) was termed “pengestion” where the individual was chewing on a pen (included whiteout fluid, ball point pens, glue sticks) which broke and the contents released into their mouth. One-third of the exposures in the exploratory group included therapeutic medications and encompassed situations where students ingested or snorted medications such as aspirin and similar substances.
In 2009, Leather reviewed the risk-taking behaviors in adolescence (7) and found that entering high school brings new exposures such as science class and other practical classes, peer pressure, and others which may help to explain our findings. In this study, some areas for potential further investigations, in particular exposures involving 13 year olds were shown. Moreover, all different types of agents involved in ingestions within the preschool and school settings were identified.
It is important to remember that within New Zealand, children less than five years of age are more susceptible to unintentional ingestions (8), but this population group is represented less in our study, given that many young children may be with caregivers and not at preschools.
There are some limitations to this study. As this is a retrospective study, each individual call may not have all required information. Additionally, as the focus of the NPC is to assist with poison related calls, it might not be the right time for asking or collecting further information. This type of data may also include errors of entry.
The dataset used for this study was smaller than other studies, such as the study by Forrester in which 10000 incidents between 1998 and 2002 were reported (2).
Finally, this study does not consider the severity of the exposures as this information is not collected by the NPC. Additionally, this dataset does not contain information about hospitalizations.
There are a number of poisoning events that might occur at wwwwwwwwwwwwwwwwwwwwwwwwwww
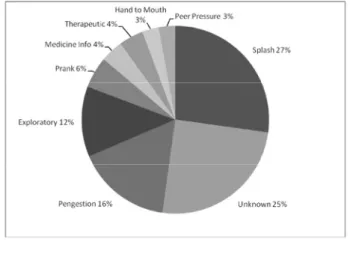
and 9 had no gender specified. 592 subjects had a written commentary associated with the call, which out of these, 27% were splash incidents, 25% were unknown (due to insufficient information), 16% were “pengestion”, 12% “exploratory”, 5% “prank”, 4% “medicine information queries” and “therapeutic ingestions”, 3% “ hand to mouth” and “peer pressure” (Figure 3).
“Exploratory” and “peer pressure” could be further categorized into “therapeutics” and “non-therapeutics”. In the “exploratory” group, 26 cases were related to therapeutic agents and 46 to other agent types. In the “peer pressure” group, 12 cases were related to therapeutics and 5 to other agent types.
This study investigated the trends in poison exposures at schools and preschools over a 21 year period between 1989 and 2009 in New Zealand. Specifically, the number of calls, gender, the substance classification and the exposure count with respect to age were analyzed.
In this study period, there were 3632 calls to the NPC from schools and preschools. The number of calls increased during the study period and reached a peak of 302 in 2008. The increase in exposures after 2000 does not necessarily indicate that there were more total exposures among the population. It may be simply that there were more reported exposures to the NPC following the introduction of a toll-free number in 2001.
Similar to other studies, males were more likely to be involved in these events (6). The types of reported agents consisted of “household” products including detergents, cleaners, glue followed by “plants”, “industrial” materials and “therapeutics”. In contrast to study by Forrester (6), we found fewer “animal” exposures (bites and stings) which could be due to terrain differences between New Zealand and Texas.
With respect to the age, interestingly almost a quarter (24%) of exposures, were in the 13-year old age group. Therefore, all calls regarding 13 year old cases were further analyzed. One quarter of these calls did not have sufficient commentary associated with the record to identify the reason. In records with completed commentary, over a wwwwwwwwwwwwwwwwwwwwwwwwwwwwwww
ASIA PACIFIC JOURNAL of MEDICAL TOXICOLOGY APJMT 1;1 www.mums.ac.ir/j-apjmt DECEMBER, 2012
Figure 2.Number of calls to the NPC at each year grouped by age, bubble
size represents number. Figure 3.Types of exposures for the calls responsible for 13 year age group.
12 DISCUSSION
LIMITATIONS
Funding and Support: The New Zealand Child Injury Prevention Foundation funded of BP studentship.
1. Holder Y, Matzopoulos R, Smith N. Poisons. In: Peden M, Oyegbite K, Ozanne-Smith J, Hyder AA, Branche C, Fazlur-Rahman AKM, et al., editors. World Report on Child Injury Prevention. Geneva: World Health Organization (WHO) press; 2008.
2. Kypri K, Chalmers DJ, Langley JD, Wright CS. Child injury morbidity in New Zealand, 1987-1996. J Paediatr Child Health 2001 Jun; 37(3):227-34.
3. Yates KM. Accidental poisoning in New Zealand. Emerg Med (Fremantle) 2003 Jun; 15(3):244-9.
4. Liebelt EL, DeAngelis CD. Evolving trends and treatment advances in pediatric poisoning. JAMA. 1999 Sep 22-29; 282(12):1113-5.
5. Ozanne-Smith J, Day L, Parsons B, Tibballs J, Dobbin M. Childhood poisoning: access and prevention. J Paediatr Child Health 2001 Jun; 37(3):262-5.
6. Forrester MB. Patterns of exposures at school among children age 6-19 years reported to Texas poison centers, 1998-2002. J Toxicol Environ Health A 2006 Feb; 69(3-4):263-8.
7. Leather NC. Risk-taking behaviour in adolescence: a literature review. J Child Health Care 2009 Sep; 13(3):295-304. 8. Alatini M. Analysis of Unintentional Child Injury Data in
New Zealand: Mortality (2001-2005) and Morbidity (2003-2007). Auckland: Safekids New Zealand; 2009.
13 21 Years of School Poisonings in New Zealand
R. Braund et al.
REFERENCES
schools and preschools. Identification of the implicated substances may enable strategies to be implemented regarding safe storage and handling in these settings.
The authors would like to recommend that (1) educational institutions need to be made aware of these exposure trends in order to reduce unnecessary incidents, (2) all staff are required to be aware of the potential hazards within their institution, while science laboratories are of particular concerns, (3) schools need to be provided with first aid advice regarding exposures, and prevention websites such as www.poisons.co.nz (educational resource), (4) appropriate storage and disposal of potential hazards should be identified, not only for science laboratories, but also for art and cleaning supplies, (5) it is necessary that the NPC considers collecting more exposure data, including a severity rating, and ideally follows up calls to determine outcomes.
We would like to acknowledge The New Zealand Child Injury Prevention Foundation for the funding of BP studentship, Vicky McLeod (research assistant) for her assistance with data accuracy checks and figures, and Yuan (Anny) Fan, Arthur Ho Che Liu and Cindy Yang for assistance with classifications.
Conflict of Interest:None to be declared.