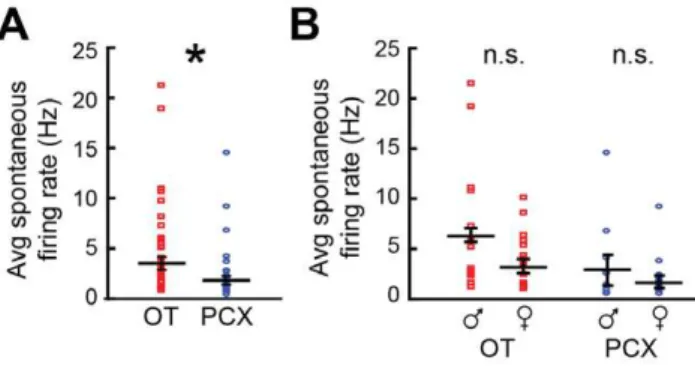
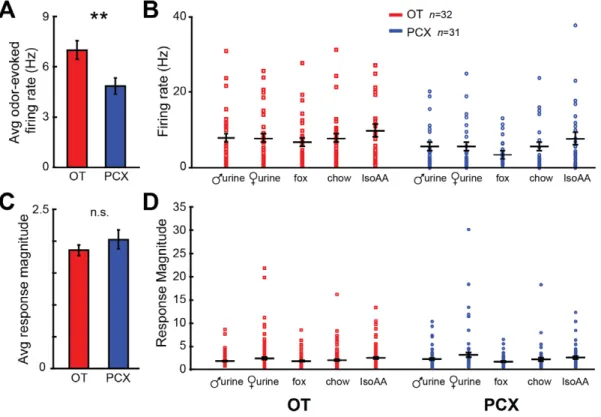
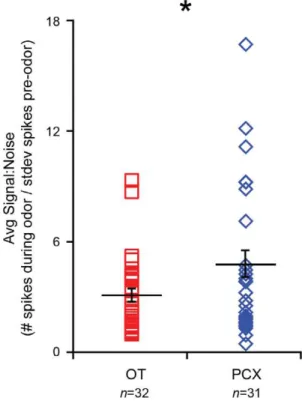
Parallel odor processing by two anatomically distinct olfactory bulb target structures.
Texto
Imagem

Documentos relacionados
The designation multivariate analysis represents a large number of methods and techniques that simultaneously use all variables in the analysis, interpretation and processing of
No presente artigo propomo-nos definir contributos para uma aproximação e estratégia nacional (Whole-of-Government Approach – WoGA) do Estado português na gestão de crises
This risk analysis included all activities that constituted the process, each type of failure that could affect the patient, its severity, the probability of each failure
The statistical analysis of the values at four weeks revealed that the remaining forces deliv- ered by the elastomeric chains were all different from each other; in the Long
The two absolute errors for each participant’s two responses (for Start A and Start B) were averaged to obtain the individual’s mean absolute error for each target in each
The implementation relies on static analysis, using a data flow analysis over a pro- grams call graph, that infers which locks need to be held for each unit of work, that
With the aim of evaluating the SRAP (sequence-related amplified polymorphism) technique for linkage mapping in Pisum sativum L., a F 2 mapping population.. derived from an
The surface roughness of each speci- men (n = 5) was based on the mean value of ive parallel measurements in each time and all data were submitted to two-way repeated measures
