www.the-cryosphere.net/7/1481/2013/ doi:10.5194/tc-7-1481-2013
© Author(s) 2013. CC Attribution 3.0 License.
The Cryosphere
High-resolution provenance of desert dust deposited on Mt. Elbrus,
Caucasus in 2009–2012 using snow pit and firn core records
S. Kutuzov1,2, M. Shahgedanova1, V. Mikhalenko2, P. Ginot3,4, I. Lavrentiev2, and S. Kemp1
1Department of Geography and Environmental Science and Walker Institute for Climate System Research, University of
Reading, Reading, RG6AB, UK
2Laboratory of Glaciology, Institute of Geography, Russian Academy of Science, Moscow, Russia
3IRD/Univ. Grenoble Alpes/CNRS/Univ. Savoie/INPG/IFSTTAR/CNRM, Observatoire des Sciences de l’Univers de
Grenoble (OSUG) UMS222, Grenoble, 38041, France
4Univ. Grenoble Alpes/CNRS, Laboratoire de Glaciologie et Géophysique de l’Environnement (LGGE) UMR5183,
Grenoble, 38041, France
Correspondence to:S. Kutuzov (s.kutuzov@reading.ac.uk)
Received: 26 March 2013 – Published in The Cryosphere Discuss.: 23 April 2013 Revised: 29 July 2013 – Accepted: 11 August 2013 – Published: 24 September 2013
Abstract. The first record of dust deposition events on Mt. Elbrus, Caucasus Mountains derived from a snow pit and a shallow firn core is presented for the 2009–2012 pe-riod. A combination of isotopic analysis, SEVIRI red-green-blue composite imagery, MODIS atmospheric optical depth fields derived using the Deep Blue algorithm, air mass tra-jectories derived using the HYSPLIT model and analyses of meteorological data enabled identification of dust source re-gions with high temporal (hours) and spatial (ca. 20–100 km) resolution. Seventeen dust deposition events were detected; fourteen occurred in March–June, one in February and two in October. Four events originated in the Sahara, predomi-nantly in northeastern Libya and eastern Algeria. Thirteen events originated in the Middle East, in the Syrian Desert and northern Mesopotamia, from a mixture of natural and anthropogenic sources. Dust transportation from Sahara was associated with vigorous Saharan depressions, strong surface winds in the source region and mid-tropospheric southwest-erly flow with daily winds speeds of 20–30 m s−1at 700 hPa
level. Although these events were less frequent than those originating in the Middle East, they resulted in higher dust concentrations in snow. Dust transportation from the Middle East was associated with weaker depressions forming over the source region, high pressure centred over or extending to-wards the Caspian Sea and a weaker southerly or southeast-erly flow towards the Caucasus Mountains with daily wind speeds of 12–18 m s−1 at 700 hPa level. Higher
concentra-tions of nitrates and ammonium characterised dust from the Middle East deposited on Mt. Elbrus in 2009 indicating con-tribution of anthropogenic sources. The modal values of par-ticle size distributions ranged between 1.98 µm and 4.16 µm. Most samples were characterised by modal values of 2.0– 2.8 µm with an average of 2.6 µm and there was no signifi-cant difference between dust from the Sahara and the Middle East.
1 Introduction
located in relative proximity to dust source regions provide an opportunity to assess variability in dust emissions and at-mospheric circulation on regional scale. Transportation of dust from the Sahara to the glaciers in the European Alps is well studied (De Angelis and Gaudichet, 1991; Collaud Coen et al., 2004; Schwikowski et al., 1999, 1995; Sode-mann et al., 2006; Thevenon et al., 2009, 2012; Wagenbach and Geis, 1989). A number of studies examined variability in mineral dust transportation and deposition on glaciers of Central Asia (Dong et al., 2009; Kreutz et al., 2001; Thomp-son et al., 1989; Wake et al., 1994; Yang et al., 2006), Hi-malayas and Tibetan Plateau (Kaspari et al., 2009; Wu et al., 2009, 2013; Xu et al., 2010) and the Altai (Olivier et al. 2003; 2006).
One glacierized region, which is affected by desert dust deposition but has not been studied in this respect, is the Cau-casus Mountains located between the Black and the Caspian Seas (Fig. 1) in proximity to the arid regions of the Middle East and on the track of Saharan depressions (Hannachi et al., 2011). The Caucasus accommodates about 2000 glaciers covering approximately 1600 km2 whose retreat intensified since the 1980s with a combined glaciated area loss of 10 % between 1985 and 2000 (Stokes et al., 2006). While there was research on regional snow chemistry (e.g. Rototaeva et al., 1998; 1999), characteristics of mineral dust and its provenance was studied in relation to a single dust deposi-tion event, which occurred on Mt. Elbrus on 5 May 2009 (Kokkalis et al., 2012; Shahgedanova et al., 2013). Using this deposition event, Shahgedanova et al. (2013) developed a methodology for high temporal (ca. hours) and spatial (ca. 50–100 km) resolution “provenancing” of recent dust de-position events recorded in snow pack and firn and shallow ice cores using satellite products developed specifically for tracking desert dust in the atmosphere, atmospheric trajec-tory modelling and analysis of meteorological data.
The main objective of this paper is to examine a four-year (2009–2012) record of dust deposition events on Mt. Elbrus, northern Caucasus, Russia using snow pit and shallow firn core data. The specific objectives are to (i) date dust deposi-tion events and establish their source regions building on the methodology proposed by Shahgedanova et al. (2013); (ii) characterise meteorological conditions leading to dust depo-sition; (iii) characterise physical and, for part of the record, chemical properties of deposited dust; and (iv) attempt to establish links between physical and chemical properties of dust and its source regions.
Mt. Elbrus presents an ideal location for the examina-tion of dust trapped in snow, firn and glacier ice because its high elevation (5642 m above sea level; a.s.l.; Fig. 1b) en-sures solid precipitation throughout the year and absence of significant seasonal melt above approximately 4600 m a.s.l. (Mikhalenko et al., 2005). Free tropospheric conditions pre-vail over 4000 m in winter and spring and, consequently, these elevations are not reached by local polluted air masses
and aerosol deposition is associated with long-range trans-port.
2 Data and methods 2.1 Collection of samples
Two sets of samples were collected on the Western Plateau on Mt. Elbrus (43◦20′53.9′′N, 42◦25′36.0′′E) at an eleva-tion of 5115 m a.s.l. (Fig. 1b) on 7 September 2009 and on 26 June 2012. For logistical reasons, different methodologies were used to collect samples in 2009 and 2012 predetermin-ing different methods of sample analysis.
In June 2009, twenty three snow samples were collected from a snow pit containing four visible yellow-brown layers of dust. Samples were collected using a pre-cleaned shovel and polyethylene gloves along the depth of the snow pit and included snow with and without dust. The top 10 cm of snow were discarded to avoid potential contamination. Snow with-out visible layers of dust was sampled at 10 cm intervals. The thickness of four dust-containing layers detected in the snow pit was less than 10 cm on all but one occasion and these layers were sampled at different intervals according to their depth. The collected samples were kept frozen in the Whirl-Pak bags and used for analyses for concentration of major water-soluble ions, dust particle size distribution and stable isotopes of oxygen and hydrogen.
In June 2012, a 12 m firn core was extracted at the same location. In this core, thirteen dust layers were visually iden-tified and sections of the core containing dust layers were cut out. The outer layers of the core (approximately 1–2 cm) were removed using a pre-cleaned plastic scoop to avoid con-tamination. The samples were melted and the melt water was filtered using 0.2 µm Millipore isopore membrane filters. The filters were placed in the sterile Petri dishes for transporta-tion. In addition, 111 snow samples were taken from the core at 10 cm intervals for isotopic analysis.
Both the snow pit profile and the shallow core were exam-ined for the occurrence of thin crusts of ice which form on snow surface in late spring–early summer in response to in-creasing insolation and serve as stratigraphic markers allow-ing one to establish in which month or season dust deposition events occurred. Measurements of snow weight and volume in the snow pit and in the core were made alongside the snow pit and shallow core sampling in order to calculate snow and firn density which was calculated by dividing the weight of snow or firn by its volume.
2.2 Isotopic analysis
Fig. 1. (a)Location of study area and(b)snow sample collection and shallow core extraction site (indicated by the black arrow). The highest elevation (the West Elbrus summit) is indicated by the white arrow.
To estimate precision of the measurements and to minimise memory effect associated with continuous measurements, the instrument was calibrated on a regular basis against isotopic standards V-SMOW, GISP and SLAP provided by the International Atomic Energy Agency (IAEA). The esti-mated accuracy was ±0.067 ‰ for oxygen isotope (δ18O)
and ±0.31 ‰ for deuterium (δD). The CERL laboratory working standard SPB was measured repeatedly following analysis of every 5 samples. Theδ18O and δD values were expressed in ‰ units relative to the V-SMOW value.
2.3 Particle size distribution
Two different methods, predetermined by different ways of sampling dust from the snow pit and the shallow core, were used. The snow samples with and without visible dust layers obtained in 2009 were analysed using Coulter Counter Mul-tisizer 3 (CCM) with 300 channels, set up in the class-100 clean room at the Laboratory of Glaciology and Geophysics of the Environment (LGGE), Grenoble, France. The instru-ment was set to detect particles with equivalent spherical di-ameter (Reid et al., 2003) from 1.0 µm to 30.0 µm producing particle counts per 10−3L and numerical frequency
distri-butions as well as total particle mass expressed in parts per billion (ppb). The liquid sample in a covered accuvette was turned three times for dust homogenization, and analysed in the following 30 s to avoid large particles settling. This pro-cedure was used with the same timing for all the samples. However, according to the measured dust size distribution in samples, the number of larger particles (>10 µm) was re-duced so that settling does not affect a large number of parti-cles. Each size distribution represented an average of at least three independent measurements of the same sample. Back-ground distributions were characterised using snow samples,
which did not contain visible dust layers. Particle mass con-centrations (µg kg−1)were obtained from the volume distri-butions using mean particle density of 2.5 g cm−3.
Dust samples obtained from the shallow core in 2012 were analysed using scanning electron microscope (SEM) Cambridge 360 Stereoscan at the Centre for Advanced Mi-croscopy (CfAM), the University of Reading, UK. Sections of filters containing mineral particles were cut out and coated with carbon adhesive layer prior to the analysis. In order to cover the whole size range of dust particles between 0.2 µm and 30 µm, images of each sample were taken at 1000, 5000 and 10 000 magnifications. Scandium software was used for analysis: For every dust sample, over 2000 particles were manually digitised and their geometric characteristics were automatically measured by the software. Manual digitisation was used to avoid the problem of particle overlapping.
The CCM and SEM data were obtained in the format of numerical distribution and had different cut-off points of 1.0 µm and 0.2 µm (predetermined by the pore size of the fil-ters) respectively. Both CCM and SEM measurements were transformed to distributions by volume whereby accumu-lated particles in each diameter bin were converted into ac-cumulated volumes following Ruth et al. (2003). For each individual particle, volume was calculated as
Vi=
4π 3
di
2 !2
(1) wheredi is a characteristic diameter of each bin calculated
300 channels used by CCM were reduced to 50 bins and the same bins were used for SEM data. Following data trans-formation, log-normal size distribution function was fitted to the original data following Steffensen (1997), Delmonte et al. (2002) and Ruth at al. (2003).
2.4 Water-soluble ions
The snow pit samples, including four samples containing dust, were analysed for soluble ions using Dionex Dual ICS-3000 ion chromatography system in the class-100 clean room at the LGGE Laboratory. Chemical analysis of cations (Li+,
Na+, NH+
4, K
+, Mg2+, Mn2+, Ca2+)were performed
us-ing CG16 and CS16 cations separator column and a CSRS-300 conductivity suppressor (Dionex) and isocratic 27 mM methanesulfonic acid as eluent. Anion (F−, CHOO−, Cl−,
NO−3, SO24−, C224−) analysis was performed using a
AG11-HC and AS11-AG11-HC columns and ASRS-300 suppressor, ap-plying a gradient elution (0.3–30 mM KOH).
2.5 Dating and “provenancing” dust deposition events
Dust deposition events were dated and “provenanced” us-ing methodology outlined in Shahgedanova et al. (2013) in three iterations utilising independent techniques and datasets. Firstly, visual examination of snow and shallow core profiles for dust layers together with isotopic analysis and position of the dust layers in relation to ice crusts, enabled determina-tion of the approximate (i.e. month) timing of dust deposi-tion events. Secondly, examinadeposi-tion of the NCEP/NCAR re-analysis (Kalnay et al., 1996) and local meteorological data together with the Moderate Resolution Imaging Spectrora-diometer (MODIS) atmospheric optical depth (AOD) (Hsu et al., 2006) data enabled dating dust deposition events to a precision of specific days and establishing broad source regions of the dust (e.g. northern Sahara or Middle East). Thirdly, Spinning Enhanced Visible and Infra-Red Imager (SEVIRI) on board the Meteosat Second Generation (MSG) red-green-blue (RGB) composite imagery and HYSPLIT at-mospheric trajectory model (Draxler and Rolph, 2013; http: //ready.arl.noaa.gov/HYSPLIT.php) were used for high tem-poral (hours) and spatial (ca. 20–100 km) resolution “prove-nancing” of desert dust.
2.5.1 Meteorological and back trajectory data
Meteorological conditions conducive to dust entrain-ment, transportation and deposition were examined using NCEP/NCAR reanalysis data (Kalnay et al., 1996) including sea level pressure (SLP), geopotential height and vector wind data at 700 hPa isobaric surface, surface and boundary layer wind speeds obtained from the National Oceanic and Atmo-spheric Administration (NOAA; http://www.esrl.noaa.gov/ psd/data/) and station measurements of air temperature, pre-cipitation, wind speed, visibility and reports of specific me-teorological events such as dust storms, blowing sand,
reduc-tion in visibility and unusual, yellow colour of precipitareduc-tion. The 700 hPa vector wind fields serve as a good indicator of potential dust transportation to the Caucasus (Shahgedanova et al., 2013). Data on surface and boundary layer wind speed in the potential source regions compared with the threshold for dust mobilisation defined by Chomette et al. (1999) as 7–9 m s−1confirmed potential for dust entrainment. Meteo-rological conditions in the vicinity of Mt. Elbrus were eval-uated using data from the Terskol weather station located 12 km southeast of the Western Plateau at 2141 m a.s.l.
For each dust deposition event, twenty-seven member en-sembles of three-dimensional trajectories were calculated using HYSPLIT model run with the Global Data As-similation System (GDAS) meteorological input (Draxler and Rolph, 2013; http://ready.arl.noaa.gov/HYSPLIT.php). HYSPLIT has horizontal resolution of 1◦. Each member of
the trajectory ensemble is calculated by offsetting meteoro-logical data by a fixed grid factor (one meteorometeoro-logical grid point in the horizontal and 0.01 sigma unit (approximately 250 m) in the vertical). HYSPLIT was run in the backward mode for the Western Plateau at six-hourly intervals for the times when SEVIRI RGB images (Sect. 2.5.2) showed dust clouds passing over Mt. Elbrus. The length of each integra-tion did not exceed 120 h. After source regions were located with high accuracy using SEVIRI imagery, HYSPLIT was run in a forward mode using source region and time of dust storm initiation as a starting point. The differences between the end-points of back trajectories and the starting point of forward trajectories were taken as an uncertainty measure in the location of source regions using the trajectory method.
2.5.2 Remote-sensing products
Data from SEVIRI on board MSG satellite, positioned in a geostationary orbit at 0◦W over the equator, were available with 15 min temporal resolution, which is key to high resolu-tion “provenancing” and dating of dust events. The SEVIRI RGB composite images were produced from three thermal infrared channels, 10 (12.0 µm), 9 (10.8 µm), and 7 (8.7 µm), by displaying the brightness temperature differences between channels 10 and 9 as red, 9 and 7 as green and channel 9 as blue (Lensky and Rosenfeld, 2008; Schepanski et al., 2007). Spatial resolution of the RGB composites is 3 km at nadir decreasing to 4–7 km over the Middle East and the Cauca-sus where satellite view angle reaches 60◦(Roebeling et al.,
2012).
dust sources (Schepanski et al., 2007, 2009) and to examine dust plume transportation history (Bou Karam et al., 2010; Shahgedanova et al., 2013). The technique is qualitative and involves visual spotting of dust plume and tracking it either back to source region or forward to sink region by inspecting consecutive SEVIRI images with 15 min time step (Schepan-ski et al., 2007).
The images were downloaded from the EUMETSAT web-site (www.eumetsat.int) initially at 2 h intervals between May 2009 and June 2012. Following the preliminary anal-ysis of meteorological data, AOD and the 2-hourly SEVIRI RGB images for dust events, additional SEVIRI images with 15 min resolution were downloaded and inspected to deter-mine desert dust sources and reconstruct detailed transporta-tion history.
Data from the Cloud Aerosol Lidar and Infrared Pathfinder Satellite Observation (CALIPSO) mission (http: //www-calipso.larc.nasa.gov) were used to characterise ver-tical distribution of dust during the event. Attenuated backscatter (reflectivity) profiles at 532 nm were provided by the Cloud-Aerosol Lidar with Orthogonal Polarization (CALIOP) installed on CALIPSO (Winker et al., 2003) with vertical and horizontal resolutions of 60 m and 12 km respec-tively. The CALIOP-derived reflectivity was used as a proxy to describe the dust layer structure as it depends on aerosol concentration and its optical properties (Bou Karam et al., 2010).
MODIS AOD at 550 nm derived using the Deep Blue al-gorithm (Hsu et al., 2006) from MODIS-Aqua collection 5.1 (http://disc.sci.gsfc.nasa.gov/giovanni/) was used. MODIS AOD fields were available daily at approximately 12 h local time.
3 Results
3.1 Dust stratigraphy and isotopic analysis
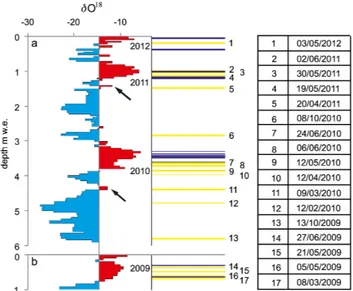
The stable isotope record revealed strong fluctuations inδ18O values with a range of 21.5 ‰, a minimum of−27 ‰ and a maximum of−5.5 ‰, and the record average of−15 ‰ (Fig. 2). These fluctuations were interpreted as seasonal cycle in which warm season values varied between−5.5 ‰ and −10 ‰ and cold season values varied between −17 ‰ and −27 ‰. The seasonal variations in δ18O confirmed that the shallow core extended from June 2012 to the autumn 2009. The snow pit record began 7 September 2009, when the pit was excavated and extended to the winter of 2009–2008. It is not clear whether the shallow core and the snow pit isotopic records overlap and it is possible that a short period at the end to middle of September 2009 is not represented.
The thin ice crusts, forming on the snow surface due to radiative thawing, occurred in three sections of the core and in the snow profile corresponding to the high δ18O values typical of the summer months (Fig. 2). Seventeen dust
de-Fig. 2.Oxygen (δ18O) isotopic record and stratigraphy for(a)the
shallow core and(b)the snow pit. Dust layers and ice crusts are shown in yellow and blue respectively. Dust deposition events are numbered from 1 (the most recent) to 17 (the earliest in the record). Dates of deposition events are shown in the table. Arrows point at the short-term increases inδ18O corresponding to the advection of warm air masses transporting dust (Sect. 3.1). Depth is shown in metres of water equivalent (m.w.e.)
position events were identified in the shallow core and the snow pit and their position in relation to the ice crusts and the seasonally increasing values ofδ18O confirm that most of the dust events occurred in spring–early summer. The dust layer No. 12 was deposited at the end of winter 2010 and lay-ers No. 13 and 6 were deposited in the autumns of 2009 and 2010. The dates were subsequently established as February 2010 and October 2009 and 2010 (Sect. 3.2).
The prominent, short-term increases in δ18O indicating precipitation forming in the warm air mass were observed in the springs of 2010 and 2011 coinciding with dust lay-ers No. 11 and No. 5 (Fig. 2). Analysis of the meteorologi-cal records from Terskol revealed two episodes of warm ad-vection and heavy snowfall on 8–10 March 2010 and 19– 21 April 2011. During the March episode, temperature in-creased from−5.7◦C on 8 March to 1.5◦C on 09 of March exceeding the monthly average by 3◦C. The station regis-tered a three-day total of 69.3 mm of precipitation and re-ported its unusual yellow colour. During the April episode, air temperature increased from−1.6 to 3.6◦C exceeding the monthly average by 3.3◦C, 40.2 mm of precipitation was recorded and a number regional stations reported yellowish colour of clouds.
3.2 Chronology and “provenancing” of dust events
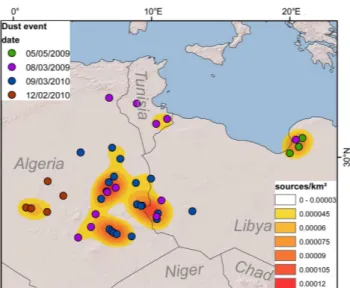
Fig. 3.The Saharan source regions of dust transported to Mt. El-brus with dates of dust deposition. The colours represent the kernel density of the dust sources (points per unit area) as calculated in ArcGIS 10.
discussed in Sect. 2.5. Ten deposition events occurred in March–May, four events were registered in June, two events in October and one in February (Figs. 2–4). On four occa-sions, dust originated from the northern Sahara (Fig. 3). In thirteen cases, dust originated from the Middle East and more specifically from northern Mesopotamia (northern Syria – northwestern Iraq) and the Syrian Desert (32–34◦N; 37.5– 39.5◦E) (Fig. 4). On 5 May 2009, the Saharan depression carrying dust travelled over the Middle East initiating addi-tional dust uplift (Kokkalis et al., 2012; Shahgedanova et al., 2013). It is, therefore, possible to characterise dust events as Saharan, Middle Eastern and mixed and similar characterisa-tion of dust events was suggested by Koçak et al. (2012) us-ing the results of atmospheric mineral aerosol monitorus-ing in 2007–2008 in the eastern Mediterranean. In both the Sahara and the Middle East, specific meteorological conditions re-sult in dust entrainment and transport. These vary in strength and duration but not in the types of weather systems initiating dust events. Two examples demonstrate how dust deposition events were dated, their geographical provenance established and examine typical meteorological conditions leading to the uplift and transportation of dust from the Sahara and the Mid-dle East.
A potential dust deposition event occurred on 11–13 June 2009 in addition to the events identified from the snow pit and shallow core stratigraphy. The uplift of dust from two source regions in the Middle East and its transportation to the Caucasus was identified on the SEVIRI imagery (not shown) but dust horizon was not registered in the snow pit. The ev-idence for weak dust deposition was provided by chemical composition of the samples and is discussed in Sect. 3.4.
Fig. 4.The Middle Eastern source regions of dust transported to
Mt. Elbrus with dates of dust deposition. The majority of dust events were traced to northern Mesopotamia (northern Syria – northwestern Iraq) and the Syrian Desert (approximately 32–34◦N; 37.5–39.5◦E). The colours represent the kernel density of the dust sources (points per unit area) as calculated in ArcGIS 10.
3.2.1 The Saharan event of March 2009
Figure 3 summarises the source regions in northern Sahara supplying dust to the Caucasus. There are two main areas: (i) the foothills of the Akhdar Mountains in northeastern Libya and (ii) the foothills of the Ahaggar Mountains in east-ern Algeria. Both regions were identified by Schepanski et al. (2009) as persistent dust sources active in spring. De-tailed analysis of dust deposition of 5 May 2009, whereby dust originated from the foothills of the Akhdar Mountains, was provided by Shahgedanova et al. (2013). On other oc-casions, dust originated either from Algeria or from multiple sources including Algerian, Libyan and Tunisian sources.
The most intensive dust deposition event of all, regis-tered between 2009 and 2012, occurred on 8 March 2009 and was contributed to by multiple sources in the north-ern Sahara (Fig. 3). Following this event, dust concentra-tion in snow reached 253 mg kg−1 while following the
in-tensive dust event of 5 May 2009, dust concentration was 89 mg kg−1. The dust uplift was initiated on 4 March by
migrating from northwestern to southeastern Europe, the UK Met Office SLP analysis charts (not shown) indicate that a depression formed over the Libyan Desert with central SLP of 1006 hPa at 00:00 UTS on 4 March deepening to 979 hPa on 6 March (not shown). Associated with the de-pression was a cold front extending from the coast through western Libya and Tunisia to Algeria and marked by a band of brown clouds on the SEVIRI RGB image (Fig. 5a). At 12:00 UTC on 4 March, the 6 h average wind speed ex-ceeded 13 m s−1. Strong southwesterly flow from eastern Al-geria established in the middle and the upper troposphere with the 6-hourly mean wind speeds exceeding 30 m s−1at
700 hPa on 4 March (not shown). While the observed con-ditions were similar to those leading to dust transportation on 5 May 2009 (Shahgedanova et al., 2013) as well as to other Saharan events, during the March 2009 event, a deeper depression dominated over the Mediterranean coast of Africa and stronger southwesterly mid-troposphere flow from North Africa to the Caucasus with 5-day mean wind speed in ex-cess of 20 m s−1persisted between 4 and 8 March (Fig. 5e). Associated with position of the centre of the depression and frontal zones were areas of strong surface wind and ascend-ing vertical velocities. Thus, 6-hourly mean surface wind speed of 12–19 m s−1was registered on 5 March over north-eastern Libya and over the foothills of Akhdar Mountains in northeastern Libya on 6 March initiating additional dust uplift (Fig. 5b and c). Mineral dust from the latter source was transported to the Caucasus in addition to the initial dust transport from eastern Algeria. Regional meteorologi-cal station reported continuous dust storms between 4 and 7 March. The dust cloud reached Mt. Elbrus on 8 March to-gether with the precipitation-bearing cold front. Precipitation total of 37 mm was recorded at the Terskol weather station on 8–9 March.
3.2.2 The Middle Eastern event of May 2011
The majority of dust events originating in the Middle East are associated with the development of (i) depressions over or extensions of low pressure troughs to the Middle East and Turkey in the south and (ii) high pressure in the north cen-tred over or extending towards the Caspian Sea either from Siberia or from northern Europe. These weather systems con-trol (i) the surface wind speeds that are sufficiently high to initiate dust uplift and (ii) formation of southerly or south-easterly flow transporting desert dust to the Caucasus. Shifts in positions of the weather systems predetermine activation of dust sources in northern Mesopotamia, the Syrian Desert or across the region (Fig. 4).
The dust event of 16–19 May 2011 (Fig. 6) typifies mete-orological processes and sources of dust uplift in the region although it was characterised by a more prolonged circula-tion of the dust mass over the region than during other dust events and involved uplift from multiple areas including both the Syrian Desert and Mesopotamian sources. Dust
entrain-04/03/09 12 UTC 05/03/09 12 UTC
06/03/09 12 UTC 07/03/09 12 UTC
a b
c d
e f
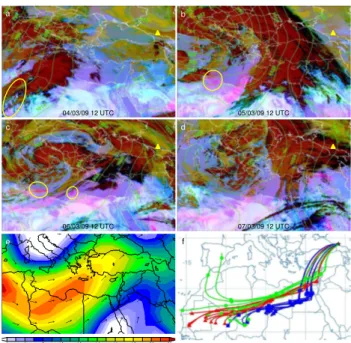
Fig. 5. (a–d) SEVIRI-derived RGB false colour composite
im-ages for 4–7 March 2009, showing dust (pink/magenta), clouds (brown/orange), and differences in surface emissivity retrieved in absence of dust or clouds (blue). Deserts appear as light green-blue. Isobars are shown as continuous green lines with SLP values (hPa).(e)Five-day (4–8 March 2009) average wind speed (m s−1)
and direction at 700 hPa. (f) 4-days three-dimensional back tra-jectories from HYSPLIT model starting at 43.348◦N; 42.427◦E; 5000 m a.s.l. at 22:00 UTC on 7 March 2009. Mt. Elbrus is shown as a yellow triangle. The yellow ovals highlight areas of dust uplift.
ment was initiated by a weak depression with central pres-sure of 1002 hPa forming over the Red Sea on 16 May 2011 (Fig. 6a). The initial dust uplift occurred over the northern-most Saudi Arabia and was associated with the passage of a weak front, whose position is marked on the SEVIRI image by the mid-level clouds (brown colour; Fig. 6a). The 6-hourly mean surface wind speeds, derived from NCEP/NCAR re-analysis, varied between 6–9 m s−1 but local weather sta-tions, e.g. Gassim (26.30◦N; 43.77◦E) and Hail (27.43◦N;
41.68◦N), registered surface wind speeds of 10–15 m s−1
16/05/11 10 UTC
18/05/11 16 UTC
17/05/11 05 UTC
19/05/11 03 UTC
a b
c d
e f
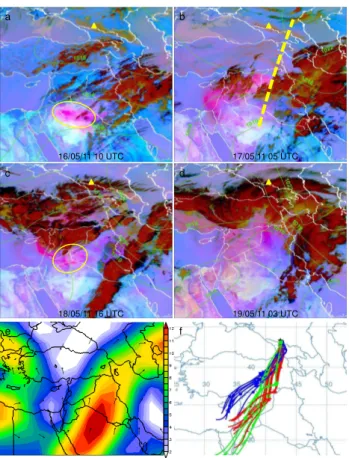
Fig. 6. (a–d)SEVIRI-derived RGB false colour composite images
for 16–19 May 2011. The colour scheme, isobars and signs are as on Fig. 5.(e)Four-day (16–19 May 2009) average wind speed (m s−1) and direction at 700 hPa.(f)Two-day three-dimensional back tra-jectories from HYSPLIT model starting at 43.348◦N; 42.427◦E; 5000 m a.s.l. at 03:00 UTC on 19 May 2011. CALIOP/CALIPSO lidar transact for 17 May 2011 is shown as yellow dashed line (see Fig. 7b).
the centre of the low was positioned over Iraq (Fig. 6c and d). A zone of strong pressure gradient established between the low and the anticyclone over the Caspian Sea initiat-ing southerly flow towards the Caucasus Mountains with four-day (16–19 May) average wind speed of 12–14 m s−1 at 700 hPa (Fig. 6e). The southerly advection created a zone of strong baroclinicity with temperature gradients exceeding 17◦C over 400 km at 00:00 UTC (3 h local time) over
north-ern Iraq and southeastnorth-ern Turkey (not shown). The frontal system marked on the SEVIRI image by thick high-level clouds (dark red) and mid-level clouds (brown) (Fig. 6c and d) was moving from the west, which in turn provided con-ditions for uplift of dust to the middle troposphere. Regional weather stations, e.g. Mosul (36.32◦N; 43.15◦N) and Kirkuk (37.47◦N; 44.40◦N), reported dust storms from 19:00 UTC on 18 May to 19:00 UTC 19 May and MODIS AOD values exceeded 2.15 (not shown). The dust mass reached Mt. El-brus at 06:00 UTC on 19 May. HYSLIP trajectories (Fig. 6f) are in agreement with SEVIRI data.
Fig. 7. (a) MODIS AOD values for 18 May 2011 and (b)
CALIOP/CALIPSO transact showing attenuated backscatter coeffi-cient (km−1sr−1)profiles at 532 nm with 60 m vertical and 12 km horizontal resolution. The outline of the topography is shown as a solid orange line. Thick clouds appear in white and dust clouds in orange-red. Position of the transact is shown in Fig. 6b.
3.3 Particle size distribution
Statistics of the volume particle size distributions derived from analyses of seventeen dust layers are shown in Table 1. The SEM measurements cover a wider range of particle sizes than the CCM measurements. To make these statistics com-parable, particles with equivalent diameter below 1 µm were excluded from the calculations of statistical properties of the SEM-derived data (Table 1). While the exclusion of the small particles significantly affects particle number distribu-tion, its effect on particle volume distribution is weak due to the small cumulative volume accounted for by these particles (see Fig. 9).
The modal values ranged between 1.98 µm and 4.16 µm although most samples were characterised by modal val-ues of 2.0–2.8 µm with an average of 2.6 µm. These valval-ues were lower than those obtained from the ice cores in central and southern Asia following the deposition of long-travelled dust (Dong et al., 2009; Wu et al., 2009, 2013; Xu et al., 2010) and are closer to those reported for the European Alps (Schwikowski et al., 1995; Thevenon et al., 2009) and the po-lar ice cores (Delmonte et al., 2002; Ruth et al., 2003; Stef-fensen, 1997).
The volume size distributions for the 2009 dust deposi-tion events, derived from CCM analysis, are shown in Fig. 8. Close fit with log-normal curves has been achieved for all distributions although there is higher uncertainty for the fine particles. Analysis of low-concentration samples, one of which is shown in Fig. 8, revealed no systematic coarse particle mode. All four distributions derived from samples containing dust have a single mode which is usually inter-preted as a single source region (Dong and Li, 2011). How-ever, during the dust deposition event of 5 May 2009, dust was transported from two different source regions, the north-ern Sahara and northnorth-ern Mesopotamia (Shahgedanova et al., 2013; Sects. 3.2 and 3.4).
Table 1.Characteristics of frequency distributions of dust particles (µm). Samples from 2009 and 2010–2012 were analysed using CCM and SEM respectively. Modal values (µ) and standard deviations (σ) are given for the size distributions with the minimum equivalent particle diameter of 1 µm. MND and MNV are mean number and mean volume diameters respectively. Events are numbered as on Fig. 2.
SEM (2010–2012) CCM (2009)
No 1 2 3 4 5 6 7 8 9 10 11 12 13 14 15 16 17
µ 1.93 2.11 2.11 4.16 2.17 2.88 2.02 2.23 1.92 2.71 2.30 3.34 2.52 2.72 2.56 2.18 2.78
σ 2.17 1.98 2.27 2.62 1.83 1.99 2.10 1.95 1.79 1.95 2.12 1.83 1.99 1.95 2.04 1.95 2.03
MND 1.77 1.80 1.84 2.23 1.81 1.99 1.78 1.80 1.69 1.92 1.85 2.25 1.88 1.96 1.92 1.85 1.97 MVD 2.20 2.18 2.29 2.97 2.16 2.43 2.19 2.14 1.95 2.31 2.28 2.71 2.25 2.25 2.18 2.05 2.28
Fig. 8.Particle size distributions by volume with lognormal fits for
the four dust deposition events recorded in 2009. Particle size dis-tribution for a sample which did not contain visible dust is shown for comparison.
orders of magnitude lower than those analysed using CCM. To account for this difference, frequency distributions were presented as percentage of volume accounted for the parti-cles in 50 bins. Similarly to 2009, the majority of samples are characterised by the single-mode distributions. Particles with a diameter exceeding 10 µm are present in all samples (Fig. 9). In the samples analysed using SEM, large particles account for a higher proportion of the volume than in the samples analysed using CCM as a result of a comparatively low number of particles used for the SEM analysis. For ex-ample, in the particle size distribution for event No. 1 (3 May 2012), a single particle with a diameter of 16 µm accounted for 4 % of the volume. Particles within 1–10 µm range con-tribute 88±5 % to the total volume in the thirteen samples analysed using SEM.
The dust deposition event of 19 May 2011 (No. 4) was characterised by higher frequency of larger particles. This event was characterised by the highest modal value of 4.16 µm (Table 1) and particles with diameter of 10 µm and larger accounted for 17 % of the total volume. In
addi-tion to sensitivity of particle size distribuaddi-tions derived from SEM analysis to the presence of large particles, high con-centrations of fresh-water diatoms with equivalent diam-eter of 6–8 µm (Fig. 10) explained the atypical size dis-tribution and comparatively high modal values. The dust originated from several source regions in the Middle East (Sect. 3.2.2; Fig. 6) including ephemeral lakes and dry streams in Mesopotamia, which explains the presence of
Cocconeissp. diatoms whose likely ecological preference is for shallow fresh water (N. Cameron, personal communica-tion, 2013).
3.4 Chemical composition
The CCM analysis, conducted on twenty three samples obtained from the 2009 snow pit, revealed four peaks in mineral dust mass in the profile (Fig. 11). The deposition of dust resulted in elevated concentrations of most ions, especially Ca2+, Mg2+, K+, SO2−
4 , and NO
−
3 (Fig. 11).
The average dust mass concentration for 23 samples was 18 mg kg−1and it was strongly affected by four dust
deposi-tion events. The highest concentradeposi-tion of total mineral dust of 253 mg kg−1and 89 mg kg−1characterised deposition events of 8–9 March 2009 (No. 17) and 5 May 2009 (No. 16) respec-tively. Although the largest amount of dust was deposited on Mt. Elbrus during the two-day deposition event on 8– 9 March, the highest concentrations of ions characterised a short (about 2 h) but intensive dust deposition event of 5 May 2009. Thus concentrations of Ca2+, a well-known indicator
of desert dust in snow and ice cores (Schwikowski, 1995; Sodemann et al., 2006), reached 23 mg kg−1(Fig. 11c). The
total dust mass and concentrations of ions are lower in the dust layers attributed to 21 May (No. 15) and 27 June 2009 (No. 14).
Na+ and Cl−are generally assumed to be of marine
Fig. 9.Particle size distributions by volume for dust deposition events recorded between 2010 and 2012 and analysed using SEM. Particle size distributions for the 2009 events analysed using CCM are shown for comparison.
ratio which is consistent with the mixing of dust-containing air mass arriving from the Sahara and/or Middle East with air masses travelling over the Black Sea (Table 2). The low-est ratio of 1.3 characterised deposition of the Saharan dust on 8–9 March indicating a potential contribution of the halite and other terrestrial minerals to elevated Na+concentrations.
This result is consisted with the reduced Cl−/ Na+ratios re-ported for snow and ice in the Swiss Alps and attributed to the Saharan dust (Schwikovski, 1999) and with the origin of dust in the foothills of the Ahaggar Mountains known for the widespread occurrence of dry saline lakes.
Na+ was chosen as a sea-salt tracer to evaluate sea salt contribution to the sulphate and calcium concentrations. Non-sea-salt sulphate (nssSO24−) and calcium (nssCa2+)
composition during four dust evens was calculated from the ion ratios SO24−/ Na+and Ca2+/ Na+in seawater which are
Table 2.Concentrations of major ions in the 2009 snow pit samples containing dust layers (ppb).
Date (No.) Depth (m.w.e.) Cl− Na+ NO−3 SO42− NH+4 K+ Mg2+ Ca2+
27/06 (14) 0.358–0.369 141 77 655 1714 220 95 78 5109 21/05 (15) 0.447–0.486 201 96 784 1891 301 107 87 6604 05/05 (16) 0.594–0.602 351 201 1065 4376 357 307 167 23 609 08/03 (17) 0.670–0.689 135 104 215 2970 143 190 108 17 286
Fig. 10.Diatoms in the dust samples:(a)fresh-water Aulacoseira sp. attributed to 05 May 2009 deposition event and(b)(most likely
fresh-water)Cocconeissp. attributed to 19 May 2011 event. Classified by N. Cameron, University College London, UK.
are characterised by higher ratios of 0.34 and 0.29. It is pos-sible that oxidation of anthropogenic SO2 from industrial
sources typical of this region might have contributed to the elevated concentrations of sulphates (Ginoux et al., 2012a). NH+4 species originate from biomass burning and agricul-tural sources such as livestock and application of fertilizers and their concentrations are known to be high over the Mid-dle East in general and Mesopotamia in particular (Ginoux et al., 2012a). Three out of four samples of dust originating from or travelling over the Middle East were characterised by elevated concentrations of NO−3 and NH+4 while the Saharan dust deposited on 8–9 March was not.
Additional peaks in concentrations of NO−3, NH+4, SO24−, and to a lesser extent, Mg2+ were noted at the depth of
0.409–0.449 m w.e. Both the total mass and Ca2+ profiles
exhibited weak increases (Fig. 11), however, no visible dust layer was detected at this depth in the snow pit. Examina-tion of the SEVIRI imagery revealed transportaExamina-tion of dust from two source regions, uplifted on 11 June on the border between Syria and Jordan and on 13 June in northern Syria and Iraq, to the Caucasus (not shown). Elevated concentra-tions of ammonium are consistent with the extent of anthro-pogenic activities in the latter source region (Ginoux et al., 2012a).
Fig. 11.Particle number, total mass, and major ion concentration
4 Discussion
The application of multiple, independent techniques to the examination of four-year record of dust deposition events on Mt. Elbrus enabled, for the first time, high-precision dat-ing (ca. days) and “provenancdat-ing” (ca. 20–100 km) of dust events recorded in snow and glacier ice. Many previous stud-ies focused on dust deposition on glaciers, however, in most dust deposition events were dated to the precision of years (e.g. Wu et al., 2013) or seasons (e.g. Kreutz et al., 2001) using traditional methods of ice core analysis. A number of studies used satellite remote sensing and back trajectory analysis and provided high-resolution dating of dust events (e.g. Collaud Coen et al., 2004; Grousset et al., 2003; Sode-mann et al., 2006) especially when daily air quality observa-tions were used. SEVIRI imagery, available at 15 min tempo-ral resolution, is widely used in studies of atmospheric dust and was recently applied to dust deposition on glaciers by Shahgedanova et al. (2013). The use of SEVIRI in applica-tion to the four-year record of dust deposited on Mt. Elbrus enabled dating dust deposition events to the precision of days and, in some cases, hours and, for the first time, linked dust deposited on glaciers with their source regions with precision of a few tens of kilometres. Two main broad source regions were identified, the northern Sahara and the Middle East, and within these regions the specific areas contributing to dust deposition in the Caucasus were established (Figs. 3 and 4). While deposition of the Saharan dust on glaciers was de-tected in many studies (e.g. Schwikowski et al., 1995; Sode-mann et al., 2006; Wagenbach and Geis, 1989), so far the Caucasus is the only region where deposition of dust origi-nating in the Middle East was researched in detail.
Sources of dust in the Sahara have been well documented (Schepanski et al., 2007, 2009) and there is a wealth of data on geochemistry of the Saharan dust (e.g. Castillo et al., 2008; Formenti et al., 2003; Guieu, 2002). Dust sources in the Middle East are less well known and detection of dust sources using SEVIRI imagery complemented earlier stud-ies by Walker et al. (2009) and Gerivani et al. (2011) us-ing MODIS surface reflection imagery and by Ginoux et al. (2012b) using MODIS AOD. An important step is linking dust provenance established from remote sensing and back trajectory modelling with geochemical data despite its limi-tation to a single year (Sect. 4.2).
4.1 Uncertainties in dating and “provenancing” dust deposition events
A number of uncertainties are associated with the employed methodology. The occurrence and timing of dust deposition events were generally determined accurately using the com-bination of complimentary techniques including detailed vi-sual examination of startigraphy, isotopic analysis, SEVIRI and meteorological data. An exception is weak dust depo-sition events which are not prominent in the snow or core
profile due to the small mass of dust, but are visible on the SEVIRI imagery. An example is deposition event of 13 June 2009 which was detected not through the examination of snow profile, but through chemical analysis of soluble ions and confirmed by SEVIRI. It is possible that another weak event, not detected in the shallow core, occurred on 4 April 2011 when SEVIRI imagery shows passage of dust mass over the central Greater Caucasus. The absence of geochem-ical data for 2010–2012 did not allow us to confirm this de-position event. Therefore, it is important to use the proposed approach in conjunction with traditional chemical and parti-cle size analyses for the continuum of samples. This combi-nation was used in relation to the data obtained in 2009, but not in 2012 for logistical reasons which is a limitation of the study.
Spatial resolution of SEVIRI RGB imagery which varies between 3 km at nadir and 4–7 km over the Middle East (Roebeling et al., 2012), however, various factors preclude location of dust sources with this precision. The activation of dust sources in both regions is associated with low pressure systems and atmospheric fronts whose passage is marked by the presence of clouds. Figure 12a shows that while uplift of dust in the foothills of the Ahaggar Mountains is evident, the northern sector of this region, where eroding land sur-face features can be identified using sursur-face reflectance im-agery with spatial resolution of 1 km and higher, is obscured by cloud cover. Therefore, a larger number of sources could potentially contribute to this dust event. The same limita-tion characterises dust transportalimita-tion from the Syrian Desert (e.g. Fig. 6) whereby contribution of sources located down-wind in Syria and Iraq might not have been detected.
Cloud cover affects the ability of the method to distin-guish between contribution of the Saharan and Middle East-ern sources when a dust-carrying Saharan depression passes over the Middle East initiating dust uplift that is obscured by clouds (Wilkerson, 1991; Shahgedanova et al., 2013). Both SEVIRI and Deep Blue MODIS data are affected by this lim-itation. CALIOP data distinguish between clouds and differ-ent types of aerosol (Winker et al., 2003), however, frequency of acquisitions over the same region limits its ability to char-acterise dust events. The ability of HYSPLIT trajectory data to alleviate this problem is limited because the uncertainty associated with calculation of back trajectories reaches 15– 30 % of the travel distance (Draxler and Rolph, 2013) and is considerably higher than that of satellite data. This limitation will not impact the European Alps and the Pyrenees which are not affected by dust transport from the Middle East.
Fig. 12. (a)Dust plume over the eastern Algeria on 7 March 2010 and obscuration of dust sources located further north by clouds (dark red-brown). Black rectangle indicates area shown in(b)and
(c).(b)Colour enhancement on the SEVIRI image by the underly-ing surface, blue rectangle shows sources of dust, black rectangle shows colour enhancement by dark-coloured rocks.(c)True-colour surface reflectance image indicating location of dark-coloured rocks with no potential dust sources.
typical of recent emission or to the false enhancement by the underlying surface. Rocky desert surfaces in particular can appear purple on SEVIRI imagery due to their high emis-sivity in the 8.7 µm channel causing potential confusion with airborne dust (Banks and Brindley, 2013). Further examina-tion of the high-resoluexamina-tion imagery confirms the absence of erodible areas serving as potential dust sources in this loca-tion (Fig. 12c). To avoid false detecloca-tion, the consecutive im-ages with 15 min resolution were examined and dust plumes were traced to their point of origin. The false enhancement is typical or early spring and early morning hours (Banks and Brindley, 2013) when both seasonal and diurnal maxima in dust activation occur (Schepanski et al., 2009).
A combination of Figs. 4 and 13 illustrates spatial reso-lution of dust “provenancing” and mapping of dust sources. Figure 13a shows dust uplift in northern Iraq leading to dust deposition event on 21 May 2009. Land cover in the region of uplift is shown as (i) overlaid by SEVIRI RGB image with pixels of approximately 5×5 km and (ii) on a true colour im-age (Fig. 13b and c). The area of uplift and each pixel accom-modate a number of potential sources including both season-ally dry rivers and agricultural fields. Therefore, while dust sources can theoretically be located with precision of spa-tial resolution of SEVIRI RGB composite images, in practice dust is mobilised from multiple erodible areas forming dif-fused plumes. This was also noted by Walker et al. (2009) in the analysis of uncertainties of dust source mapping in south-west Asia using MODIS. In our analysis, dust plumes can be traced back to their source areas with the highest spatial resolution of approximately 20–30 km in case of small-scale sources, in the absence of clouds and obscuration by dust up-lifted from the upwind sources (e.g. Fig. 13) but more com-monly, in case of large-scale dust plumes, with a resolution of 50–100 km (e.g. Fig. 5).
As all ice-core studies, this study analysed dust deposition events in a single point and did not address spatial variability in dust deposition. Further analysis will be required to quan-tify spatial variability and dust deposition rates on Mt.
El-Fig. 13. (a)Dust uplift in northern Iraq. Black arrow indicates the
source area.(b) The area of dust uplift shown on a surface re-flectance image overlaid by SEVIRI RGB image with individual pixels seen as rectangles.(c)True-colour surface reflectance image showing multiple potential dust sources (agricultural fields, season-ally river beds) in the same area as on(b).
brus due to the influence of local topography through the extraction of multiple shallow cores in different sectors of Mt. Elbrus. Our analysis of SEVIRI imagery indicated that dust clouds passed over the southern and eastern Caucasus and these trajectories did not resulted in dust deposition on Mt. Elbrus. Thus, it will be desirable to obtain snow pit and firn or ice core records from the different regions in the Cau-casus Mountains, most importantly, from the south CauCau-casus in the future.
4.2 Dust source regions contributing to deposition on Mt. Elbrus
The identified dust source areas are presented in Figs. 3 and 4. The Saharan sources are in the north of the region and their positions are in good agreement with dust source areas identified by Schepanski et al. (2009) using SEVIRI RGB imagery from 2006–2008. Dust originates mainly in the foothills of the Saharan mountains, e.g. the Djebel Akhdar in Libya and in the Ahaggar Mountains in eastern Algeria. In both regions dust emissions occur from the endorheic water systems, e.g. wadis opening to alluvial fans or chotts (dry, often salt lakes), where sediments forming through fluvial abrasion are uplifted by strong wind (Schepanski et al., 2009; Ginoux et al., 2012b). The foothills of the Atlas Mountains are another important source of dust in the northern Sahara, contributing to dust deposition in the European Alps (Col-laud Coen et al., 2004), but not in the Caucasus within the period of assessment. During the dust event of 5–8 March 2009, while dust predominantly from Algeria travelled to the Caucasus, dust from the Atlas foothills crossed the Mediter-ranean following trajectory towards the Alps (not shown). There was no transport from the more extensive and active sources located in the southern and eastern Sahara.
estimated that erodible surfaces account for 30–50 % of the area in northern Mesopotamia including its Iraqi sector and making it a prominent source of dust.
In contrast to the extensive natural sources in the Sahara, multiple small-scale sources dominate in the Middle East and these are both natural (dry river beds and lakes) and an-thropogenic, predominantly agricultural sources (Ginoux et al., 2012b; Walker et al., 2009). Ginoux et al. (2012b) com-mented that dust sources are mainly anthropogenic in north-eastern Syria and natural in Iraq while Wilkerson (1991) and Gerivani et al. (2011) relate dust storms in northern Mesopotamia predominantly to the erosion of alluvial sed-iments. Our assessment showed a widespread occurrence of dust emissions from sources which can be characterised as anthropogenic using criteria applied by both Tegen et al. (2004), classifying land as natural if no more than 5 % of regional land-use is anthropogenic, and Ginoux et al. (2012b), who applied a 30 % land-use threshold to classify source regions as anthropogenic. Figure 13 illustrates dust mobilisation in northern Iraq from both agricultural and allu-vial sources and during other events, dust is mobilised from a similar mixture of sources.
Greater prominence of dust emissions from anthropogenic sources in northern Mesopotamia can result from regional droughts in the 2000s. Al Dabbas et al. (2010) noted an in-crease in the frequency of dust storms between 1978 and 2008 in response to a negative trend in annual precipita-tion which declined from 138 mm in 1970–1979 to 36 mm in 2000–2008 for six stations representing different regions of Iraq and from 327 mm to 149 mm at Mosul in northern Iraq. Reporting droughts in Syria in 2000–2010, Erian et al. (2010) stressed that eastern Syria was affected particularly strongly. In 2008, annual precipitations was about 30 % below the re-gional forty-year average making it the driest year on record. The rain-fed crops, accounting for 71 % of total arable land in Syria, cover about 8000 km2in the region and rely on April– May rainfall for growth. In 2007–2010, these crops were fail-ing in March and most of the land was abandoned and served as a source of dust (Erian et al., 2010). The desiccation of rivers was widespread including drying of the al-Khabour, a main tributary of the River Euphrates, enabling deflation of alluvial sediments in northern Mesopotamia.
Dust originating from or passing over the Middle East was characterised by the elevated concentrations of NO−3 and NH+4 in 2009 (Table 2). Dust deposited on Mt. Elbrus on 27 June and 21 May originated from multiple sources in the Middle East including Mesopotamia (Fig. 4) while dust transport from northeastern Libya on 5 May occurred over northern Mesopotamia either causing additional uplift of dust and/or absorption of pollutants from the atmosphere (Shahgedanova et al., 2013). These results are consistent with Ginoux et al. (2012a) showed that this region is characterised by high atmospheric loads of ammonium emitted by agricul-tural sources and high concentrations of ammonium in dust
originating from this region. By contrast, samples of the Sa-haran dust deposited on 8 March, showed low concentrations consistent with the low ammonium loads in the source region (Ginoux et al., 2012b). We suggest that elevated concentra-tions of nitrates and ammonium may serve as a tracer of dust originating from or travelling over the Middle East although analysis of larger number of samples is required to confirm this conclusion. Particle size distributions, by contrast, did not reveal any significant differences between the Saharan and the Middle Eastern sources (Figs. 8 and 9).
Data on dust mass concentrations are limited to 2009 when the average dust mass concentration was 18 mg kg−1 and
this was strongly affected by four dust deposition events (Fig. 11). Few studies report dust mass concentrations for the short time periods (e.g. days or months) or individual events. Wake et al. (1994) reported dust mass concentrations with higher temporal resolution for eight glaciers in Central Asia. The dust mass concentrations averaged over 1–3 yr periods were 2–8 mg kg−1which is considerably lower than the av-erage concentration in 2009 in the Caucasus.
4.3 Seasonality of dust deposition and associated meteorological conditions
Dust uplift and transportation to the Caucasus from both, the Sahara and the Middle East is associated with depres-sions migrating towards the Caucasus and occurs mainly in March–June. Dust events occurred as wet deposition and pre-dominantly when dust-carrying depressions, producing lit-tle or no rainfall, merged with precipitation-bearing weather fronts moving from the Black Sea region.
Mediterranean (despite the higher frequency of the Saharan depressions which produce little rainfall) enabling efficient dust transport to the Caucasus region.
Dust transport from the Middle East is controlled by the development of low pressure systems over the Middle East – Turkey – Black Sea region and high pressure centred over or extending towards the Caspian Sea (e.g. Fig. 6) enabling the development of southerly or southeasterly flow towards the Caucasus. In March–early May and in October, westward extensions of the Siberian high dominating northern Asia in the cold half-year (Panagiotopoulos et al., 2005) develop in the north while in the second half of May–June high pressure systems forming over northern Europe prevail.
Although dust concentrations were only determined for 2009 when two of the Saharan dust events occurred (Ta-ble 2), thickness of dust layers attributed to the Saharan sources indicates higher dust loads than those associated with the Middle Eastern sources. Cyclogenesis over the North African coast, resulting in dust transportation, was intense with central SLP in depressions as low as 979 hPa while the depressions forming over the Middle Eastern were less vigorous with central SLP of 1000–1008 hPa. Surface wind speeds over the Saharan source regions reached 20 m s−1and daily 700 hPa wind speeds averaged 20–30 m s−1against 12– 18 m s−1 during the dust transport from the Middle East. Strong ascent, with vertical velocities in access of 0.2 m s−1,
induced by frontal systems characterises the Saharan depres-sions and this is considerably weaker over the Middle East.
5 Conclusions
A four-year record of desert dust deposition events, de-rived from a snow pit and a shallow firn core, encompass-ing the 2009–2012 period was for the first time presented for the Caucasus Mountains, Russia. The elevation and cli-matic characteristics of Mt. Elbrus made it ideal for trap-ping and preserving dust in snow and firn. The application of a multi-disciplinary methodology based on the analysis of high-resolution remote-sensing products from SEVIRI and MODIS, back trajectory models and meteorological data for the first time allowed dating and “provenancing” dust events with temporal precision of days or hours and spatial resolu-tion of 20–100 km. The main source regions of dust were the northern Sahara (especially northeastern Libya and Algeria), the Syrian Desert and northern Mesopotamia. Despite the frequent comments, made in the Russian-language literature on the dust transport from the deserts of Kazakhstan, Cen-tral Asia and lower Volga, we found no such events within the assessment period most likely due to the absence of me-teorological conditions for dust transport from this region at high elevations. Most dust deposition events occurred in March–June, but also in February and October, and were as-sociated with either vigorous Saharan depressions or with southerly flow from the Middle East forming between the
de-pressions over the source region moving towards the Cauca-sus and high pressure systems extending towards the Caspian Sea. The first type of events was less frequent but associated with deeper depressions and stronger air flow and resulted in higher dust loads. The second type was more frequent but associated with weaker deposition. In both cases, wet deposi-tion occurred when the dust-bearing air masses merged with precipitation-bearing weather fronts advancing towards the Caucasus from the Black Sea – Turkey region.
Due to the logistical reasons, dust mass and concentrations of soluble ions in snow were determined for 2009 only which is a limitation of this study. However, analysis of the 2009 events revealed higher concentrations of nitrates and ammo-nium in the samples attributed to the Middle Eastern sources than in the sample attributed to the Sahara potentially indi-cating the input of anthropogenic sources in the Middle East either at the point of emission (i.e. fertilizers used on agri-cultural fields) or during the transportation over this popu-lated region. Comparison of the Middle Eastern sources con-tributing to the analysed dust events with their assessments published in literature (e.g. Walter et al., 2009; Wilkerson, 1991) showed that the prominence of northern Mesopotamia as a source region of dust might have increased during the period of assessment in comparison with the earlier years due to the drought observed in Syria and Iraq in the 2000s. A more detailed, quantitative assessment of input of anthro-pogenic sources of dust to deposition events and impacts of climatic variability on dust emissions requires chemical anal-ysis of larger number of dust samples and a longer record. A deeper core has been extracted on Mt. Elbrus in the sum-mer of 2013 and will provide more information on total dust deposition, chemical properties of dust, and comparison be-tween the anomalously dry years with those when precipita-tion was close to its climatological norm in the Middle East.
Acknowledgements. The research leading to these results has received funding from the European Union Seventh Framework Programme FP7-PEOPLE-2010-IIF under grant agreement PIIF-GA-2010-275071, Royal Society International Joint Project “Impacts of Dust Deposition on Glacier Melt in the Caucasus Mountains, Russia” (project N JP100235) and Russian Foundation for Basic Research (grants 11-05-00304 and 13-05-10069). The University of Reading UROP scheme funded SEM analysis. We are grateful to the Climate and Environment Research Laboratory (CERL), Arctic and Antarctic Research Institute, St. Petersburg, Russia for isotopic analysis and the University of Reading Centre for Advanced Microscopy for providing access to and help with SEM. We thank Nigel Cameron, Environmental Change Research Centre, University College London for classifying diatoms and Kevin White, Department of Geography and Environmental Science, University of Reading for sharing his vast knowledge of geomorphology of the Sahara and deserts of the Middle East.
References
Al-Dabbas, M. A., Ayad Abbas, M., and Al-Khafaji, R. M.: Dust storms loads analyses – Iraq, Arab. J. Geosci., 5, 121–131, doi:10.1007/s12517-010-0181-7, 2010.
Banks, J. R. and Brindley, H. E.: Evaluation of MSG-SEVIRI mineral dust retrieval products over North Africa and the Middle East, Remote Sens. Environ., 128, 58–73, doi:10.1016/j.rse.2012.07.017, 2013.
Barkan, J., Alpert, P., Kutiel, H., and Kishcha, P.: Synoptics of dust transportation days from Africa toward Italy and central Europe, J. Geophys. Res., 110, D07208, doi:10.1029/2004JD005222, 2005.
Bou Karam, D., Flamant, C., Cuesta, J., Pelon, J., and Williams, E.: Dust emission and transport associated with a Saharan de-pression: February 2007 case, J. Geophys. Res., 115, D00H27, doi:10.1029/2009JD012390, 2010.
Brindley, H. E. and Russell, J. E.: An assessment of Saharan dust loading and the corresponding cloud-free longwave direct radia-tive effect from geostationary satellite observations, J. Geophys. Res., 114, D23201, doi:10.1029/2008JD011635, 2009.
Brindley, H., Knippertz, P., Ryder, C., and Ashpole, I.: A critical evaluation of the ability of the Spinning Enhanced Visible and Infrared Imager (SEVIRI) thermal infrared red-green-blue ren-dering to identify dust events: Theoretical analysis, J. Geophys. Res., 117, D07201, doi:10.1029/2011JD017326, 2012.
Castillo, S., Moreno, T., Querol, X., Alastuey, A., Cuevas, E., Her-rmann, L., Mounkaila, M., and Gibbons, W.: Trace element vari-ation in size-fractionated African desert dusts, J. Arid Environ., 72, 1034–1045, doi:10.1016/j.jaridenv.2007.12.007, 2008. Chomette, O., Legrand, M., and Marticorena, B.: Determination of
the wind speed threshold for the emission of desert dust using satellite remote sensing in the thermal infrared, J. Geophys. Res., 104, 31207, doi:10.1029/1999JD900756, 1999.
Christopher, S. A., Gupta, P., Johnson, B., Ansell, C., Brindley, H., and Haywood, J.: Multi-sensor satellite remote sensing of dust aerosols over North Africa during GERBILS, Q. J. Roy. Meteor. Soc., 137, 1168–1178, doi:10.1002/qj.863, 2011.
Collaud Coen, M., Weingartner, E., Schaub, D., Hueglin, C., Cor-rigan, C., Henning, S., Schwikowski, M., and Baltensperger, U.: Saharan dust events at the Jungfraujoch: detection by wavelength dependence of the single scattering albedo and first climatology analysis, Atmos. Chem. Phys., 4, 2465–2480, doi:10.5194/acp-4-2465-2004, 2004.
De Angelis, M. and Gaudichet, A.: Saharan dust deposition over Mont Blanc (French Alps) during the last 30 years, Tellus B, 43, 61–75, doi:10.1034/j.1600-0889.1991.00005.x, 1991.
Delmonte, B., Petit, J.-R., and Maggi, V.: Glacial to Holocene im-plications of the new 27000-year dust record from the EPICA Dome C (East Antarctica) ice core, Clim. Dynam., 18, 647–660, doi:10.1007/s00382-001-0193-9, 2002.
Dong, Z. and Li, Z.: Characteristics of Atmospheric Dust De-position in Snow on Glacier No. 72, Mount Tuomuer, China, Arct. Antarct. Alp. Res., 43, 517–526, doi:10.1657/1938-4246-43.4.517, 2011.
Dong, Z., Li, Z., Wang, F., and Zhang, M.: Characteristics of atmospheric dust deposition in snow on the glaciers of the eastern Tien Shan, China, J. Glaciol., 55, 797–804, doi:10.3189/002214309790152393, 2009.
Draxler, R. R. and Rolph, G. D.: HYSPLIT (HYbrid Single-Particle Lagrangian Integrated Trajectory) Model access via NOAA ARL READY Website (http://ready.arl.noaa.gov/HYSPLIT. php), NOAA Air Resources Laboratory, Silver Spring, MD, 2013.
Erian, W., Katlan, B., and Babah, O.: Drought vulnerability in the Arab region: Special case study: Syria, Background paper pre-pared for the 2011 Global Assessment Report on Disaster Risk Reduction, Geneva, Switzerland, 2010.
Formenti, P., Elbert, W., Maenhaut, W., Haywood, J., and Andreae, M. O.: Chemical composition of mineral dust aerosol during the Saharan Dust Experiment (SHADE) airborne campaign in the Cape Verde region, September 2000, J. Geophys. Res., 108, 8576, doi:10.1029/2002JD002648, 2003.
Gerivani, H., Lashkaripur, G., Ghafoori, M., and Jalili, N.: The source of dust storm in Iran: a case study based on geological information and rainfall data, Carpath. J. Earth Env., 6, 297–308, 2011.
Ginoux, P., Clarisse, L., Clerbaux, C., Coheur, P.-F., Dubovik, O., Hsu, N. C., and Van Damme, M.: Mixing of dust and NH3
ob-served globally over anthropogenic dust sources, Atmos. Chem. Phys., 12, 7351–7363, doi:10.5194/acp-12-7351-2012, 2012a. Ginoux, P., Prospero, J., Gill, T., Hsu, N., and Zhao, M.:
Global-scale attribution of anthropogenic and natural dust sources and their emission rates based on MODIS Deep Blue aerosol prod-ucts, Rev. Geophys., 50, RG3005, doi:10.1029/2012RG000388, 2012b.
Grousset, F. E. Ginoux, P., Bory, A., and Biscaye, P. E.: Case study of a Chinese dust plume reaching the French Alps, Geophys. Res. Lett., 30, 1277, doi:10.1029/2002GL016833, 2003.
Guieu, C., Loÿe-Pilot, M.-D., Ridame, C., and Thomas, C.: Chemi-cal characterisation of the Saharan dust end-member: Some bio-geochemical implications for the western Mediterranean Sea, J. Geophys. Res., 107, 4258, doi:10.1029/2001JD000582, 2002. Hannachi, A., Awad, A., and Ammar, K.: Climatology and
clas-sification of Spring Saharan cyclone tracks, Clim. Dynam., 37, 473–491, doi:10.1007/s00382-010-0941-9, 2011.
Hsu, N. C., Tsay, S.-C., King, M. D., and Herman, J. R.: Aerosol Properties Over Bright-Reflecting Source Regions, IEEE T. Geosci. Remote, 42, 557–569, doi:10.1109/TGRS.2004.824067, 2004.
Hsu, N. C., Tsay, S.-C., King, M. D., and Herman, J. R.: Deep Blue Retrievals of Asian Aerosol Properties Dur-ing ACE-Asia, IEEE T. Geosci. Remote, 44, 3180–3195, doi:10.1109/TGRS.2006.879540, 2006.
Kalnay, E., Kanamitsu, M., Kistler, R., Collins, W., Deaven, D., Gandin, L., Iredell, M., Saha, S., White, G., Woollen, J., Zhu, Y., Leetmaa, A., Reynolds, R., Chelliah, M., Ebisuzaki, W., Hig-gins, W., Janowiak, J., Mo, K. C., Ropelewski, C., Wang, J., Jenne, R., and Joseph, D.: The NCEP/NCAR 40-Year Reanalysis Project, B. Am. Meteorol. Soc., 77, 437–471, doi:10.1175/1520-0477(1996)077<0437:TNYRP>2.0.CO;2, 1996.
Kaspari, S., Mayewski, P. a., Handley, M., Kang, S., Hou, S., Sneed, S., Maasch, K., and Qin, D.: A High-Resolution Record of At-mospheric Dust Composition and Variability since a.d. 1650 from a Mount Everest Ice Core, J. Climate, 22, 3910–3925, doi:10.1175/2009JCLI2518.1, 2009.