TOTAL QUALITY MANAGEMENT IMPLEMENTATION
AND GUEST SATISFACTION IN HOSPITALITY
Miroslav Knežević
1*,
Slobodan Čerović
2, Vladimir Džamić
3and Tijana Radojević
41) 2) 3)4)
Singidunum University,
Faculty of Tourism
and Hospitality Management Belgrade, Serbia
Please cite this article as:
Knežević, M., Čerović, S., Džamić, V. and Radojević,
T., 2017. Total Quality Management Implementation and Guest Satisfaction in Hospitality. Amfiteatru Economic, 19(44), 124-143
Article History
Received: 5 September 2016 Revised: 17 November 2016 Accepted: 10 December 2016
Abstract
Total quality management (TQM) has become a modern system of constant improvement of the quality of all company activities. The purpose of this study is to measure the expectations and satisfaction of the guests concerning the attribute quality of the hotel product. Furthermore obtained results were compared in such a way as to analyse particularly the reviews of hotels which have implemented TQM and have the ISO 9001 certificates with reviews from hotels which have not implemented TQM and do not have the ISO 9001 certificates. The conducted analysis included 55 hotels in Serbia belonging to the 4- and 5-star categories, i.e. 1308 guests who have stayed in them. The results show that between the observed groups of guests there are fewer differences in expectations than in perception, and that generally speaking guests who have stayed in the hotels that have implemented TQM are more satisfied. The biggest difference concerning the guest satisfaction with the quality of service in the observed hotels is noticeable in relation to the employees and the value-for-money.
Keywords: total quality management, ISO 9001 certificate, Guest satisfaction, Hospitality
JEL Classification: L83, C12, Z33
Introduction
Defining the quality of services is much more complex than defining product quality, in accordance with numerous particularities of the service process (services are heterogeneous, intangible, they cannot be possessed and stored, etc.). Because of all these qualities and the diversity of services in relation to the products, their quality can neither be tested nor evaluated before use. Kotler believes that the quality of services is a set of service characteristics which arise from their ability to meet the expectations and satisfy the
customers’ needs (Kotler, Bowen and Makens, 2010). Avelini defines quality as the degree of meeting the expectations and demands of a customer, i.e. a compliance with the expectations of ever more demanding consumers on the market (Avelini – Holjevac, 2002). The quality of service is very important in the hotel business and, consequently, is the research topic of many scientific papers (Salazar, Costa and Rita, 2010; Crick and Spencer, 2011; Renganathan, 2011). Čačić (2013) defines the quality of hotel services as a set of its intangible and tangible properties on the basis of which interpersonal relationships with guests are established and, accordingly, their expectations and needs are met. In his definition of the quality of hotel services, Barjaktarović (2014) points out that what is essential are the characteristics of services that enable meeting the guests’ needs, and stresses that it is the user (guest) who provides the final evaluation (judgment) of the level of the achieved satisfaction with the provided service. In accordance with this, the service quality must meet or exceed the guests’ expectations. In this way, the defined quality includes all the processes in the business and the relationships which they establish with the guests and with one another. The quality of hotel services is often defined as an attitude of the difference between what the expectation was, and what the provided service (Parasuraman, Zeithaml and Berry, 1985; Seth, Deshmukh and Vrat, 2005; Jemmasi, Strong and Taylor, 2011). Thus, many authors believe that the quality of service is the result of the assessment process in which the service users compare their expectations with the provided service they used (Pyo, 2000; Grönroos, 2001; Kang and James, 2004). Powers also stresses the significance of quality in the hotel industry and notes that the quality management refers to designing a long-term program and is based on the following
(Radosavljević, 2007):
• identification of the key quality determinants in relation to the demands of the target customers groups;
• ensuring customer satisfaction in relation to services;
• achieving quality in all (both tangible and intangible) elements of the service; • the development of a process of informing users;
• the development of a culture of service quality in the hotel;
• technological quality improvement on the basis of the introduction of automation and modern technologies;
• improving service quality continuously.
Due to the fact that quality is emphasized as a key factor in long-term competitiveness, Total Quality Management (TQM) has become a modern system of constant improvement of the quality of all the company activities. A large number of managers have come to recognize the potential of TQM as a factor in the small and medium-sized enterprises (SMEs) survival on the market, especially in times of an economic crisis. Small and medium-sized enterprises (SMEs) are the engines of growth and job creation in most economies around the world (Mencinger, Aristovnik and Verbič, 2014).
that very important aspect of excellence in any organisation involves the employees, i.e. human resources management (Tomaževič, Seljak and Aristovnik, 2014). Although it is difficult to accurately measure the effects of TQM pertaining to these particular elements, many authors confirm a positive impact on the image of the company and the trust of customers, staff motivation, more advanced cooperation with suppliers, and innovation, which is eventually reflected mostly on the financial performance as well. Due to ever more demanding expectations of the guests, the hotel companies see Total Quality Management as a key component of competitiveness (Milovanović, 2014).
The goal of this study is to measure the expectations and satisfaction of the guests concerning the attribute quality of the hotel product. Furthermore obtained results were compared in such a way as to analyze particularly the reviews of hotels which have implemented TQM and have the ISO 9001 certificates with reviews from hotels which have not implemented TQM and do not have the ISO 9001 certificates. We analysed 55 hotels in Serbia as 4 and 5 * and 1308 guests who have stayed in them.
1.Standardization as a basis to create high-quality services in hospitality
Standardization is nowadays often defined as a certain effort of a company to offer a joint product by using a common marketing approach and without altering its business activities, in certain markets (Yalcin, 2009). A key role in standardization is reserved for standards that include permanent management decisions such as procedures, guidelines, requirements, characteristics, and instructions, which are aimed at defining actions that are carried out continuously in repeating situations (Lončarević, Mašić and Đorđević
-Boljanović, 2007). Access to standardization depends primarily on the size of the hotel, but
also on the business orientation of the hotel company. However, access to the standardization of business functions is found more often in a hotel where a single independent object is managed, while access to the standardization of business processes is more frequent in companies which have directed their business focus towards internationalization and globalization. Regardless of the approach which a company chooses, the most frequent final product of standardization are written instructions, i.e. guidelines for a proper performance of duties, which are known as standard operating procedures. Consequently, the largest number of procedures in hotels are written for work tasks which are critical for running the essential business processes in the hotel (these are processes that are aimed at achieving customer satisfaction) (Harrow, 2006). In fact, these are processes which take place in order to provide guests with basic services in the hotel (booking, checking-in and boarding, preparing and serving food and drinks, room cleaning, checking out) (Mohapatra, 2009). The key features of the standard operating procedures are the following: the procedures are accurate, clear, complete and concise, realistic, written for those who know how to use them, are corrected without delay, define the authorizations, include unplanned emergency situations, determine whom the user should turn to for help, define the minimum performance standards, and are routinely used during the course of training (Hill, 2012). Also, Hill (2012) believes that the implementation of these procedures achieves the following objectives: documenting the right processes, control of the company, control of the work processes, providing training facilities, facilitating innovation and achievement of results which are to be constant.
also includes international standards prescribed by the International Organization for Standardization (ISO). Its role is reflected primarily in the fact that, on the basis of the best of experiences in the world, it is to develop standards that can be used in different fields and industries. Some of the goals of the International Organization for Standardization are (ISO 2013): establishment, maintenance and continuous improvement of product quality and services in order to meet the needs of users; improving the health and safety of all stakeholders; global protection of the interests and rights of consumers; the promotion of international business management at the global level, etc.
As the key international standards focused on securing quality in the hotel industry,
Barjaktarović (2014) singles out the following series:
• ISO 9000 (a group of standards in the field of quality management)
• ISO 14001 (a group of standards in the field of environmental management)
• OHSAS 18001 (a group of standards in the field of health protection and safety at work)
• ISO 26000 (a group of standards in the field of corporate responsibility) • ISO 50001 (a group of standards in the field of energy management) • ISO 10018 (standards of consumer protection)
• ISO 18513 (standards related to the terminology used in tourism) • ISO 27001 (standards concerning the security of information property) • A group of standards for food safety (HACCP, ISO 22000, HALAL).
Those standards are the basis for establishing a quality management system and are used as a framework to guide companies in improving the impact (performance) and results in business management.
2.Measuring the quality of hotel services
Measuring the quality of hotel services is much more demanding and difficult than measuring the quality of physically tangible products because, in addition to material components in the hotel, a great importance is attached to the process of service delivery in which employees play a crucial role. In order to properly determine the quality of services in the hotel industry, it is necessary to measure the level of the hotel guests’ satisfaction with the provided service. It should be noted that in assessing the quality the guests are active participants, in the creation and delivery as much as in the final assessment of the overall quality of service (Barjaktarović, 2014).
There are a number of determinants of the quality of tourism and hotel services. Through a multi-dimensional approach, the users experience and use them as important criteria in the decision-making process pertaining to the use of certain services. From the standpoint of
customers, the key determinants of the quality of hotel services include (Ćosić, 2007): • palpability
• competences • availability • security • communication • empathy, etc.
All the listed determinants are very important and some of them are the bases of various models by which the quality of hotel services is defined and measured.
Živković (2011) believes that the main objectives in all measurements of the customers’
satisfaction with the provided services or products are:
•monitoring the guests’ attitudes and perceptions concerning the expected quality of products and services
•choosing a good feedback system related to the experiences of consumers.
Determining the hotel guests’ satisfaction with the provided services is a crucial activity for the hotel management so that they could objectively measure the quality of the service process. Customers’ satisfaction can be determined by means of direct and indirect measurements methods.
Direct methods include (Živković, 2011; Barjaktarović, 2014):
• direct measurement of customer satisfaction (conducted with the help of questionnaires and other techniques used for gathering information on the satisfaction)
• method of critical events (it is based on the assumption that customer satisfaction is the result of critical events concerning the relationship of staff with the service users)
• system of problem detection (the goal is to detect problems that users encounter while using the services)
• review of customer satisfaction (it is based on periodic measurements of the level of customer satisfaction and a comparison of indicators over time)
• Kano model (it is aimed at determining the preferences of guests through three different types of satisfaction in relation to the needs).
The most used indirect methods (Živković, 2011; Barjaktarović, 2014) are:
• monitoring of sales revenue (it can be divided according to different criteria)
• analysis of the complaints by the guests (the method is based on the analysis of customer complaints about the used services)
• collecting the guests’ reviews (enables detection of certain defects that need to be eliminated)
• index of retained guests (shows the number of guests who stay loyal at the end of the year as compared to those from the year’s beginning as well as new guests)
• analysis of lost guests (it is used to determine the causes for which consumers stop using a product or service)
The aim of the presented method is to identify the attitudes of the guests and to measure their satisfaction with the used products or provided services. By obtaining their ratings it is possible to identify the shortcomings whose removal means gaining a competitive advantage in the market.
3.Review of the scientific literature
Certain studies show that the quality of service is an important prerequisite for the profitability of business management (Chang and Chen, 1998; Chiou and Chang, 2009; Chang, Chen and Chiou, 2015). Tomaževič, Seljak and Aristovnik (2016) state that it is very important to measure the performance and highlight their importance in the public sector. They also listed several different models such as the European Foundation for Quality Management model, Common Assessment Framework (CAF), Business Scorecard, etc. from which CAF is very often used. Aristovnik and Obadić (2015) presented the impact and efficiency of bureaucracy on the development of small and medium-sized enterprises (SMEs) in the European Union (EU) using data envelopment analysis (DEA). The results of most studies on this topic have contributed to the emergence of a large number of conceptual models and new measuring instruments related to quality. In a series of papers between 1985 and 1994, Parasuraman et al. developed the so-called GAP model that measures the gap between the expectations before the service process and the perception of service quality after the completion of the service process. The same authors developed, in the context of the GAP model, a model for the assessment of service quality -- SERVQUAL, which consists of five determinants of quality (tangibility, reliability, responsibility, security, and compassion) (Parasuraman, Zeithaml and Berry, 1985; Parasuraman, Zeithaml and Berry, 1988). This model has been employed in a number of studies related to measuring the quality of services in various sectors (Chou et al., 2011;
So, when it comes to research on the quality of services in the hotel business, the disconfirmational method and the modified SERVQUAL model has been used by a large number of authors (Blešić, Stefanović and Kicošev, 2010; Markovic and RASPOR, 2010; Mok, Sparks and Kadampully, 2013; Madar, 2014), but this model has rarely been used to compare the quality of services in hotels which have implemented TQM with those which have not. The research on the use of standards from the series ISO 9000 and TQM implementation is mainly focused on their impact on the company performance (Tara Molina-Azorín and Heras, 2012), while for the research of the satisfaction of customers who have stayed in these hotels, other methods have been generally used (Heras -Saizarbitoria, Arana and Boiral, 2015).
The research on the impact of the total quality management implementation on the performance of hotel companies in Serbia has been very scarce and mostly directed to:
• CSR as an element of TQM and the benefits gained in this way (the satisfaction of internal and external customers, public opinion, revenue increase, cost savings, etc.).
(Blešić, Čerović andDragicević, 2011; Milovanović, 2014 )
• the impact of the application of TQM on the financial indicators of the hotel companies (Milovanović, 2014)
The obtained results have shown that the level of the implementation of total quality management in Serbian hotels is relatively high, especially in relation to the key factors such as customer orientation and teamwork. However, the analysis has shown that a higher level of the total quality management implementation does not affect the financial performance of the hotel (Milovanović, 2014).
Since there has not been any adequate research on measuring the quality of services in hotels that have implemented TQM in Serbia, we have decided to focus our research in this direction and to measure the quality of services in the above mentioned hotels by using the disconfirmational model, with certain modifications in relation to the observed hotel product attributes.
4.Research methodology
As we have previously stated, the goal of our research is to measure the expectations and satisfaction of the guests concerning the attribute quality of the hotel product. Furthermore obtained results we compared in such a way as to analyse particularly the reviews of hotels which have implemented TQM and have the ISO 9001 certificates with hotels which don’t have. This was done in order to identify whether the implementation of TQM and ISO 9001 results with a higher guests satisfaction. Research on attitudes and reviews of the guests took place between May 1st and June 30th 2015. The study covered a sample of 55 hotels, i.e. 76%† of hotels of the 4- and 5-star categories in Serbia (35 hotels which have not yet implemented TQM and do not have the ISO 9001 certificates and 20 hotels which have them), i.e. 1500 guests who have stayed in the observed hotels.
†According to the Ministry of Trade, Tourism and Telecommunications, in 2014 Serbia had 63 4-star as well as 9
To determine the guests' satisfaction with the provided services in 4- and 5-star hotels in Serbia, we used a direct method -- a questionnaire. All the information was provided strictly anonymously and voluntarily, with prior consent of the respondents in line with high ethical standards. In this way, the risk of giving socially acceptable answers was reduced as well. The guests are interviewed in person, and out of 1500 guests, the questionnaire was filled out properly by 1308 of them, which is 87.2% of respondents. The guests graded the expectations and perceptions (experience) of the quality of the hotel product with marks on the scale of 1-5 (Likert scale) for 5 attributes in five dimensions (25 questions):
• Cleanliness: Cleanliness; Cleanliness in the corridors; Cleanliness of the kitchen and the restaurant; Cleanliness of the hall; The hotel surroundings
• Comfort: Comfortable beds; Comfort in the rooms; Comfortable chairs in the restaurant; Pleasant atmosphere; Eliminating noise
• Location: Proximity of the bus station; Proximity of the airport; Proximity of the city center; Proximity of cultural and historical attractions; Proximity of the competition
• Facilities: Wellness facilities; Spa facilities; Opportunities for sports and recreation; Entertainment facilities; Possibilities for organizing various meetings
• Staff: Kindness of the staff; Professionalism of staff; Communicative staff; Employees’ foreign language skills; Employees’ ability to cope with unexpected situations Finally, we asked the guests to assess the expectations and perception when in relation to: free use of WiFi and the value-for money. We selected these attributes because they are evaluated by guests on the most visited Internet distribution system -- Booking.com. The website Booking.com™ has a large market share, especially in Europe, operating on a commission-based model and allowing its registered users to carry out a complete booking procedure online quickly and securely. Shortly after a stay, a user is routinely invited via email to fill out a guest review form. The first part of the form allows users to evaluate the property they stayed in, using a standardised set of criteria – specifically: cleanliness, comfort, location, facilities, staff, and value for money – while the second part of the form gives users the option to write additional comments (Radojevic, Stanisic & Stanic, 2015). Many authors have analysed data generated from online reviews (for a comprehensive review, see Serra Cantallops and Salvi, 2014), but we have decided not to use a data from online reviews because internet distribution systems (IDS) enable quality assessment only to users who make a reservation of hotel services over them.
In order to collect the more objective results we used a direct method -- a questionnaire. On that way we gave the possibility for all guests to rate the quality of those dimensions, no matter how they have reserved the hotel services.
We calculated the guests’ satisfaction with the analyzed attributes by using the disconfirmational model according to which the service quality is a function of expectations and perception, which can be represented as (Nitin, Deshmukh and Perm, 2005):
where:
SQ – The overall service quality; k – the number of attributes
Pij (perception) – perception of the incentive performance i under the influence of the attribute j
Eij (expectation) – expected quality of service for the attribute j in comparison to the set stimulant i
In accordance with the objectives of the study, we have set the following hypotheses: H1: There is no statistical difference between the expectations of the guests who have stayed in hotels that have implemented TQM in comparison to those guests who have stayed in hotels which have not implemented TQM
H2: There are significant differences between the perceptions of the guests who have stayed in hotels that have implemented TQM in comparison to the guests who have stayed in hotels that have not implemented TQM
H3: The guests who have stayed in hotels that have implemented TQM are as satisfied as those in hotels that have not implemented TQM
The collected data were analyzed with the help of the statistical software IBM SPSS Statistics 22, and descriptive statistics and T test were used in the analysis (Independent Samples Test and Paired Differences).
5.Results and Discussion
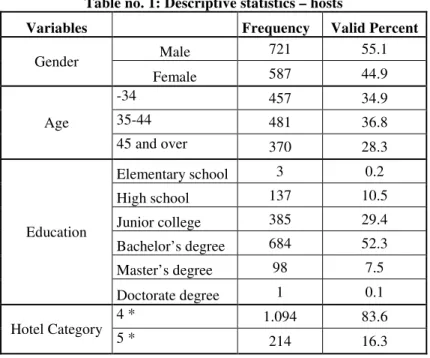
The obtained results (table no. 1) show that the largest number of guests who participated in the research possesses university education, that most of them stayed in 4-star hotels, and that they were between 35 and 44 years of age.
Table no. 1: Descriptive statistics – hosts
Variables Frequency Valid Percent
Gender Male 721 55.1
Female 587 44.9
Age
-34 457 34.9
35-44 481 36.8
45 and over 370 28.3
Education
Elementary school 3 0.2
High school 137 10.5
Junior college 385 29.4
Bachelor’s degree 684 52.3
Master’s degree 98 7.5
Doctorate degree 1 0.1
Hotel Category
4 * 1.094 83.6
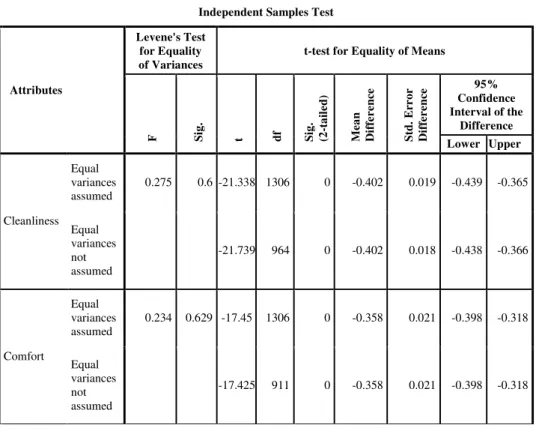
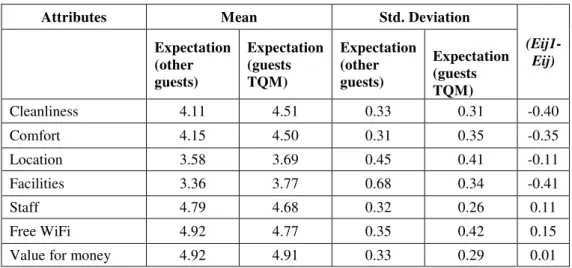
To test the first hypothesis we used the Independent Samples Test. The results (table no. 2) show that there are statistically significant differences in the estimations related to the guests’ expectation about the hotel product quality attribute when in the cases of: Cleanliness (t = -21.338; df = 1306, p <0.001), Comfort (t = -17.458; df = 1306, p <0.001), Location (t = -4.051, df = 1306, p <0.001) Facilities (t = 14.481, df = 1303, p <0.001) and Staff (t = 6.151, df = 1306; p <0.001), whereas in the case of Free WiFi (t = 0.755, df = 1.306, p = 0.451) and Value for money (t = 1.783, df = 1.275, p = 0.075) there were no statistically significant differences, i.e. the guests who have stayed in hotels that have implemented TQM and those who have stayed in hotels that have not implemented TQM, have the same expectations as far as these attributes are concerned. With the help of a more detailed score analysis (table no. 3), we have concluded that in terms of the differences in the evaluations of the five aforementioned attributes (Cleanliness, Comfort, Location, Facilities, and Staff), the guests who have stayed in hotels that have implemented TQM have higher expectations in relation to the first four attributes, while those who have stayed in hotels that have not implemented TQM have higher expectations only with regard to Staff. Since the results show that there are differences between the guests' expectations in relation to the greatest number of the observed attributes, we must discard the H1.
Table no. 2: Differences in the expectations of guests
Independent Samples Test
Attributes
Levene's Test for Equality of Variances
t-test for Equality of Means
F Sig
.
t df Sig
. (2 -t a il e d ) Me a n D if feren ce S td . E rro r D if feren
ce Confidence 95%
Interval of the Difference Lower Upper
Cleanliness Equal variances assumed
0.275 0.6 -21.338 1306 0 -0.402 0.019 -0.439 -0.365
Equal variances not assumed
-21.739 964 0 -0.402 0.018 -0.438 -0.366
Comfort
Equal variances assumed
0.234 0.629 -17.45 1306 0 -0.358 0.021 -0.398 -0.318
Equal variances not assumed
Attributes
Levene's Test for Equality of Variances
t-test for Equality of Means
F Sig
.
t df Sig
. (2 -t a il e d ) Me a n D if feren ce S td . E rro r D if feren
ce Confidence 95%
Interval of the Difference Lower Upper
Location
Equal variances assumed
0.055 0.815 -4.051 1306 0 -0.103 0.025 -0.153 -0.053
Equal variances not assumed
-4.192 1006 0 -0.103 0.025 -0.151 -0.055
Facilities
Equal variances assumed
213.624 0 -11.986 1306 0 -0.407 0.034 -0.473 -0.340
Equal variances not assumed
-14.481 1303 0 -0.407 0.028 -0.462 -0.352
Staff
Equal variances assumed
0.037 0.847 6.151 1306 0 0.107 0.017 0.073 0.141
Equal variances not assumed
6.527 1077 0 0.107 0.016 0.075 0.139
Free WiFi Equal variances assumed
1.657 0.198 0.755 1306 0.451 0.014 0.018 -0.022 0.050
Equal variances not assumed
0.781 1008 0.435 0.014 0.018 -0.021 0.048
Value for money
Equal variances assumed
12.565 0 1.777 1306 0.076 0.031 0.017 -0.003 0.065
Equal variances not assumed
Table no. 3: Differences in assessments expectations of guests
Attributes Mean Std. Deviation
(Eij1-Eij) Expectation (other guests) Expectation (guests TQM) Expectation (other guests) Expectation (guests TQM)
Cleanliness 4.11 4.51 0.33 0.31 -0.40
Comfort 4.15 4.50 0.31 0.35 -0.35
Location 3.58 3.69 0.45 0.41 -0.11
Facilities 3.36 3.77 0.68 0.34 -0.41
Staff 4.79 4.68 0.32 0.26 0.11
Free WiFi 4.92 4.77 0.35 0.42 0.15
Value for money 4.92 4.91 0.33 0.29 0.01
To test the second hypothesis, we also used the Independent Samples Test. Based on the obtained results (table no. 4), we conclude that there are statistically significant differences in evaluations concerning the experience (perception) of the guests in relation to the quality of all hotel product attributes: Cleanliness (t = -18.161; df = 1193, p <0.001) Comfort (t = -19.507; df = 1302, p <0.001), Location (t = 4.948, df = 1147, p <0.001), Facilities (t = -22.325; df = 1296, p <0.001), Staff (t = -13.054; df = 995; p <0.001), Free WiFi (t = -2.459, df = 1.306, p = 0.014) and Value for money (t = -7.198, df = 929, p <0.001). With the help of a more detailed score analysis (table no. 5), we have concluded that the guests who have stayed in hotels that have implemented TQM are more satisfied with all the monitored attributes (Cleanliness, Comfort, Facilities, Staff, Free WiFi, and Value for money) except with Location. In accordance with the obtained results, which confirm that there are differences when in relation to the guests’ perception of all the monitored attributes, we confirm the H2.
Table no. 4: Differences in the perceptions of guests
Independent Samples Test
Attributes
Levene's Test for Equality of Variances
t-test for Equality of Means
F Sig
.
df Sig
. (2 -t a il e d ) Me a n D if feren ce S td . E rro r D if feren
ce 95% Confidence Interval of the
Difference
Lower Upper
Cleanliness Equal variances assumed
52.665 0 -16.401 1306 0 -0.435 0.027 -0.487 -0.383
Equal variances not assumed
Comfort
Equal variances assumed
85.387 0 -16.543 1306 0 -0.475 0.029 -0.531 -0.418
Equal variances not assumed
-19.507 1302 0 -0.475 0.024 -0.522 -0.427
Location
Equal variances assumed
25.904 0 4.547 1306 0 0.112 0.025 0.064 0.161
Equal variances not assumed
4.948 1147 0 0.112 0.023 0.068 0.157
Facilities
Equal variances assumed
201.621 0 -18.318 1306 0 -0.722 0.039 -0.799 -0.645
Equal variances not assumed
-22.325 1296 0 -0.722 0.032 -0.786 -0.659
Staff
Equal variances assumed
13.687 0 -12.668 1306 0 -0.398 0.031 -0.459 -0.336
Equal variances not assumed
-13.054 995 0 -0.398 0.03 -0.457 -0.338
Free WiFi Equal variances assumed
1.128 0.288 -2.459 1306 0.014 -0.174 0.071 -0.313 -0.035
Equal variances not assumed
-2.474 931 0.014 -0.174 0.07 -0.312 -0.036
Value for money
Equal variances assumed
27.926 0 -7.158 1306 0 -0.272 0.038 -0.347 -0.198
Equal variances not assumed
Table no. 5: Differences in assessments perceptions of guests
Attributes Mean Std. Deviation
(Pij1-Pij)
Perception (other guests)
Perception (guests TQM)
Perception (other guests)
Perception (guests TQM)
Cleanliness 3.96 4.40 0.50 0.36 -0.44
Comfort 3.87 4.35 0.57 0.31 -0.48
Location 3.61 3.49 0.46 0.35 0.12
Facilities 3.30 4.03 0.79 0.38 -0.73
Staff 3.99 4.39 0.56 0.50 -0.40
Free WiFi 4.27 4.44 1.26 1.20 -0.17
Value for
money 4.03 4.31 0.66 0.65 -0.28
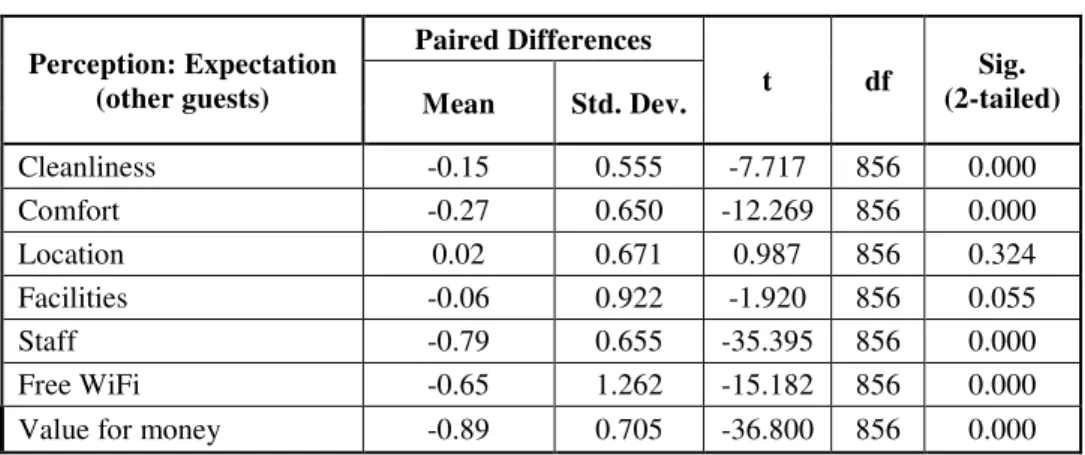
According to the mentioned disconfirmational model, the guests’ satisfaction with the quality represents the difference between perception and expectations. Accordingly, by using the T test, we have compared the perceptions of both groups of guests with the expectations they had. Based on the analysis of the assessments provided by the guests who have stayed in hotels that have not implemented TQM (table no. 6), we can conclude that there are statistically significant differences between the experience (perception) and expectations in terms of Cleanliness (t = -7.717, df = 856; p <0.001), Comfort (t = -12.269; df = 856; p <0.001), Staff (t = -35.395; df = 856; p <0.001), Free Wi Fi (t = -15.182; df = 856; p <0.001) and Value for Money (t = -36.800; df = 856; p <0.001). It is notable that for each of the listed attributes, the results are negative, i.e. that the guests’ experience is below their expectations. There are no statistically significant differences in terms of Location (t = 0.987, df = 856; p = 0.324) and Facilities (t = -1.920, df = 856; p = 0.055), which means that the guests’ experience in relation to these attributes is on par with their expectations.
Table no. 6: The satisfaction of guests who have stayed in hotels that have implemented TQM
Perception: Expectation (other guests)
Paired Differences
t df Sig.
(2-tailed) Mean Std. Dev.
Cleanliness -0.15 0.555 -7.717 856 0.000
Comfort -0.27 0.650 -12.269 856 0.000
Location 0.02 0.671 0.987 856 0.324
Facilities -0.06 0.922 -1.920 856 0.055
Staff -0.79 0.655 -35.395 856 0.000
Free WiFi -0.65 1.262 -15.182 856 0.000
Value for money -0.89 0.705 -36.800 856 0.000
significant differences between the experience (perception) and expectations with regard to: Cleanliness (t = -5.950 ; df = 450; p <0.001), Comfort (t = -7.931, df = 450, p <0.001), Location (t = -7.738, df = 450, p <0.001), Facilities (t = 11.580, df = 450; p <0.001) Staff (t = -11.909; df = 450; p <0.001), Free Wi Fi (t = -5.530, df = 450, p <0.001), and Value for Money (t = -16.913; df = 450; p <0.001). It is notable that for each of these attributes, except for Facilities, the results are negative, i.e. that the guests’ experience is below their expectations.
Table no. 7: The satisfaction of guests who have stayed in hotels that have implemented TQM
Perception: Expectation (tqm
guests)
Paired Differences
t df Sig.
(2-tailed) Mean Std. Dev.
Cleanliness -0.11 0.404 -5.950 450 0.000
Comfort -0.16 0.418 -7.931 450 0.000
Location -0.19 0.528 -7.738 450 0.000
Facilities 0.25 0.468 11.580 450 0.000
Staff -0.29 0.513 -11.909 450 0.000
Free WiFi -0.33 1.252 -5.530 450 0.000
Value for money -0.60 0.754 -16.913 450 0.000
We tested the third hypothesis by the T Test for independent samples, and for each indicator of satisfaction we have tested the zero hypotheses, which is, that there is no difference in satisfaction with the quality between the two groups of guests, i.e.
H
0: μ
other guests= μ
tqm guests (2) Based on the conducted tests (table no. 8), it can be concluded that by all the indicators, except for Cleanliness, there is a statistically significant difference in satisfaction between the guests who have stayed in hotels that have not implemented TQM (the Other Guests column), and those who have stayed in hotels which have implement TQM (the TQM guests column). The test results show that in terms of location there is greater satisfaction in the guests staying in hotels which have not implemented TQM, while in terms of all other indicators in which a statistically significant difference has been observed, satisfaction is greater among the guests who have stayed in hotels that have implemented TQM, which confirms the H3.Table no. 8: The differences in satisfaction ratings
Attributes Other guests TQM guests
95% Confidence Interval
of the Difference t df p
Mean St. dev Mean St.dev lower upper
Cleanliness -0.15 0.555 -0.11 0.404 -0.9813 0.0181 -1.35 1304 0.1766
Comfort -0.28 0.65 -0.15 0.418 -0.1964 -0.0636 -3.84 1304 < 0.0001
Attributes Other guests TQM guests
95% Confidence Interval
of the Difference t df p
Mean St. dev Mean St.dev lower upper
Facilities -0.06 0.922 0.26 0.468 -0.411 -0.229 -6.91 1304 < 0.0001
Staff -0.8 0.655 -0.29 0.513 -0.5798 -0.4402 -14.35 1304 < 0.0001
Free WiFi -0.65 1.262 -0.33 1.252 -0.464 -0.176 -4.37 1304 < 0.0001
Value for
money -0.89 0.705 -0.6 0.754 -0.3726 -0.2074 -6.89 1304 < 0.0001
Conclusions
On the basis of the conducted research and the analysis of the obtained results, we conclude that the guests who stayed in hotels that had implemented TQM had expectations similar to those of the guests who stayed in hotels that had not implemented TQM, but their perceptions were completely different. When the guests’ satisfaction, as a difference between perception and expectations, is compared to the quality of the observed attributes, it is noticeable that the perception is generally below the expectations, but the guests who stay in hotels that have implemented TQM are more satisfied with Comfort, Facilities, Staff, Free WiFi, and Value for money. The biggest difference, in comparison to the satisfaction of the guests from hotels which have not implemented TQM, lies in the assessments of the qualities of the employees. Accordingly, we can say that the implementation of TQM in the observed hotels in Serbia has had the greatest impact on the behaviour of employees which, in turn, due to the high degree of interpersonal relations, had a direct impact on the guests’ satisfaction. In this way, there is another confirmation of the importance and significance of the employees, but also of the importance of applying the ISO 9001 standards which directly affect the quality improvement, with the full involvement of all employees implied.
The limitations of this study could be that it was conducted on a national level. However, it should be noted that hotels of the best categories were analysed and some of them representing international corporative hotel chains. Thus, the results presented in this study could be considered and generalised in a broader context, which could be the subject of further research in this area.
In addition, further research on this topic could relate to a comparative analysis of hotels which have implemented TQM and strengths and weaknesses of that implementation as well.
References
Akbaba, A., 2006. Measuring service quality in the hotel industry: A study in a business hotel in Turkey. International Journal of Hospitality Management, 25(2), pp. 170-192. Ali, M. and Raza, S. A., 2015. Measurement of Service Quality Perception and Customer
Altuntas, S. and Yener, E., 2012. An Approach Based on TRIZ Methodology and SERVQUAL Scale to Improve the Quality of Health-Care Service: A Case Study/Saglik Hizmetinin Kalitesini Arttirmak için TRIZ Metodolojisi ile SERVQUAL Skalasina Dayanan Bir Yaklasi: Bir Uygulama. Ege Akademik Bakis, 12(1), pp. 97-106.
Avelini Holjevac, I., 2002. Upravljanje kvalitetom u turizmu i hotelskoj industriji. Opatija:
Fakultet za turistički i hotelski menadžment.
Barjaktarović, D., 2014. Upravljanje kvalitetom u hotelijerstvu. Beograd: Univerzitet Singidunum.
Blešić, I., Čerović, S. andDragićević, V., 2011. Improving the service quality as a socially responsible activity of hotel companies. Amfiteatru Economic, 13(29), pp. 273-286.
Blešić, I., Stefanović, V. and Kicošev, S., 2010. Primena diskonfirmacijskog modela u merenju kvaliteta hotelskih usluga. Economic Themes, 48(2), pp. 201-216
Burger, F., Kroiß, P., Pröll, B., Richtsfeld, R., Sighart, H. and Starck, H., 1997. TIS@WEB
‒ database supported tourist information on the Web. In: A.M. Tjoa, ed. 1997.
Information and communication technologies in tourism. Wien: Springer Vienna pp. 180-189.
Buttle, F., 1996. SERVQUAL: review, critique, research agenda. European Journal of Marketing, 30(1), pp. 8-32.
Cantallops, A. S. and Salvi, F., 2014. New consumer behavior: A review of research on eWOM and hotels. International Journal of Hospitality Management, 36, pp. 41-51. Carrasco, R. A., Sánchez-Fernández, J., Muñoz-Leiva, F., Blasco, M. F. and
Herrera-Viedma, E., 2015. Evaluation of the hotels e-services quality under the user’s experience. Soft Computing, pp. 1-17.
Chang, T. Z. and Chen, S. J., 1998. Market orientation, service quality and business profitability: a conceptual model and empirical evidence. Journal of Services Marketing, 12(4), pp. 246-264.
Chang, T. Z., Chen, S. J. and Chiou, J. S., 2015. Management Leadership Behaviour and Market Orientation: The Relationship and Their Effects on Organization Effectiveness and Business Performance. Marketing, Technology and Customer Commitment in the New Economy, pp. 276-281.
Chiou, J. S. and Chang, T. Z., 2009. The effect of management leadership style on marketing orientation, service quality, and financial results: A cross-cultural study. Journal of Global Marketing, 22(2), pp. 95-107.
Chou, C. C., Liu, L. J., Huang, S. F., Yih, J. M. and Han, T. C., 2011. An evaluation of airline service quality using the fuzzy weighted SERVQUAL method. Applied Soft Computing, 11(2), pp. 2117-2128.
Coulthard, L. J., 2004. Measuring service quality: A review and critique of research using SERVQUAL. International Journal of Market Research, 46(4), pp. 479-497.
Crick, A. P. and Spencer, A., 2011. Hospitality quality: new directions and new challenges.
International Journal of Contemporary Hospitality Management, 23(4), pp. 463-478. Crosby, P. B., 1979. Quality is free. s.l: Mc Graw – Hill.
Čačić, K., 2013. Poslovanje hotelskih preduzeća. Beograd: Univerzitet Singidunum.
Debasish, S. S. and Dey, M. S., 2015. Customer Perceptions of Service Quality towards Luxury Hotels in Odisha Using Servqual Model. International Journal of Research in Business Studies and Management, 2(9), pp 1-9.
Drljača, M., 2006. Methodology of Business Process Development in a Hotel. In: Faculty of Tourism and Hospitality Management, Opatija, 18th Biennial International Congress
Tourism & Hospitality – New Trends in Tourism and Hospitality Management. Opatija, Croatia, n.d. Opatija: Faculty of Tourism and Hospitality Management.
Ekinici, Y., Riley, M. and Fife-Schaw, C., 1998. Which school of thought? The dimensions of resort hotel quality. International Journal of Contemporary Hospitality Management, 10(2), pp. 63-67.
Eyefortravel, 2012. Travel Consumer Report. [online] Available at: <http://www.eyefortravel.com/sites/default/files/Extract_Consumer_Report_United_Ki ngdom_2012_13_0.pdf > [Accessed 8 August 2016].
Fombrun, C. J. and Gardberg, N. A., 1999. The reputation quotient sm: A multistakeholder measure of corporate reputation. The Journal of Brand Management, 7(4), pp. 241-255. Galeeva, R. B., 2016. SERVQUAL application and adaptation for educational service
quality assessments in Russian higher education. Quality Assurance in Education, 24(3), pp. 329-348.
Grönroos, C., 2001. The perceived service quality concept-a mistake? Managing Service Quality. International Journal, 11(3), pp. 150-152.
Heras-Saizarbitoria, I., Arana, G. and Boiral, O., 2015. Do ISO 9001-certified hotels get a higher customer rating than non-certified ones? International Journal of Hospitality Management, 51, pp. 138-146.
Hill, A., 2012. The Encyclopaedia of Operations Management: A Field Manual and Glossary of Operations Management Terms and Concepts. New Jersey: Pearson.
Jemmasi, M., Strong, K. C. and Taylor, S. A., 2011. Measuring service quality for strategic planning and analysis in service firms. Journal of Applied Business Research, 10(4), pp. 24-34.
Juran, J. M., 1997. Oblikovanjem do kvaliteta. Beograd: Grmeč.
Kang, G. D. and James, J., 2004. Service quality dimensions: an examination of Grönroos's service quality model. International Journal, 14(4), pp. 266-277.
Knežević, M., Barjaktarović, D. and Obradović, P., 2014. Ocenjivanje kvaliteta hotelskih usluga putem interneta. Zbornik radova međunarodne konferencije Sinteza, 2014,
pp. 767-771.
Kosar, L. and Rašeta, S., 2005. Izazovi Kvaliteta. Beograd: Visoka hotelijerska škola. Kotler, P., Bowen, J. and Makens, J., 2010. Marketing u ugostiteljstvu, hotelijerstvu i
turizmu. Zagreb: MATE.
Ladhari, R., 2009. A review of twenty years of SERVQUAL research. International Journal of Quality and Service Sciences, 1(2), pp. 172-198.
Litvin, S. W., Goldsmith, R. E. and Pan, B., 2008. Electronic word-of-mouth in hospitality and tourism management. Tourism management, 29(3), pp. 458-468.
Madar, A., 2014. Hotel services quality assessment using SERVQUAL method. Case study: Athénée Palace hotel. Bulletin of the Transylvania University of Brasov Economic Sciences, 7(56), pp. 71-76
Marchiori, E. and Cantoni, L., 2011. The online reputation construct: does it matter for the tourism domain? A literature review on destinations’ online reputation. Information Technology & Tourism, 13(3), pp. 139-159.
Markovic, S. and Raspor, S., 2010. Measuring perceived service quality using SERVQUAL: a case study of the Croatian hotel industry. Management, 5(3), pp. 195-209.
McDougall, G. H. and Levesque, T. J., 1995. A Revised View of Service Quality Dimensions: An Empirical Investigation. Journal of Professional Services Marketing, 11(1), pp. 189-209.
Milovanović, V., 2014. Corporate social responsibility of hotels in Serbia as an element of total quality management. Ekonomija: teorija i praksa, pp. 61-73.
Milovanović, V., 2014. Total quality management as a profitability factor in the hotel industry. Industrija, 42(3), pp. 115-127.
Mohapatra, S., 2009. Business Process Automation. New Delhi: PHI Learning Private Limited.
Mok, C., Sparks, B. and Kadampully, J., 2013. Service quality management in hospitality, tourism, and leisure. s.l: Routledge.
Nitin, S., Deshmukh, S. G. and Perm, V., 2005. Service quality models: a review.
International Journal of Quality and Reliability Management, 22(9), pp. 913-949. Parasuraman, A., Zeithaml, V. A. and Berry, L. L., 1985. A Conceptual Model of Service
Quality and its Implications for Future Research. Journal of Marketing, 49, pp. 41-50. Parasuraman, A., Zeithaml, V. A. and Berry, L. L., 1988. SERVQUAL: A multiple-item
scale for measuring consumer perceptions of service quality. Journal of Retailing 64(1), pp.12-40.
Pyo, S., 2000. Quality research in tourism and hospitality: perspectives and research agenda. Journal of Quality Assurance in Hospitality & Tourism, 1(1), pp. 1-12.
Radojevic, T., Stanisic, N. and Stanic, N., 2015. Ensuring positive feedback: Factors that influence customer satisfaction in the contemporary hospitality industry. Tourism Management, 51, pp. 13-21.
Radosavljević, G., 2007. Kvalitet u funkciji unapređenja poslovanja hotelskih preduzeća.
Zbornik radova Nacionalne konferencije o kvalitetu. Kragujevac: Asocijacija za kvalitet i standardizaciju Srbije.
Regber, S., 2016. Measuring Customer Satisfaction by Applying the Approach of SERVQUAL for Quality Service Improvement in the Public Sector. Munich: GRIN Verlag
Reid, D. R. and Bojanic, C. D., 2009. Hospitality Marketing Management. s.l: John Wiley & Sons.
Renganathan, R., 2011. Service quality in hospitality services: Gap model and factor analysis. European Journal of Social Sciences, 26(2), pp. 159-175.
Saleh, F. and Ryan, C., 1991. Analysing Service Quality in the Hospitality Industry Using the SERVQUAL Model. The Service Industries Journal,11(3), pp. 324-343.
Serra Cantallops, A. and Salvi, F., 2014. New consumer behavior: a review of research on eWOM and hotels. International Journal of Hospitality Management, 36, pp. 41-51 Seth, N., Deshmukh, S. G. and Vrat, P., 2005. Service quality models: A review.
International Journal of Quality and Reliability Management, 22(9), pp. 913-949. Sweeney, J. C., Soutar, G. N. and Mazzarol, T., 2008. Factors influencing word of mouth
effectiveness: receiver perspectives. European Journal of Marketing 42(3/4), pp. 344-364. Tarí, J. J., Molina-Azorín, J. F. and Heras, I., 2012. Benefits of the ISO 9001 and ISO
14001 standards: A literature review. Journal of Industrial Engineering and Management, 5(2), pp. 297-322.
Tomaževič N., Seljak J. and Aristovnik A., 2016. TQM in public administration organisations: an application of data envelopment analysis in the police service. Total Quality Management & Business Excellence, 27(11-12), pp. 1396-1412.
Tomaževič, N., Seljak, J. and Aristovnik, A., 2014. The impact of CAF enablers on job satisfaction: The case of the Slovenian law enforcement agency. Total Quality Management & Business Excellence, 25(11-12), pp. 1336-1351.
Vermeulen, I. E. and Seegers, D., 2009. Tried and tested: The impact of online hotel reviews on consumer consideration. Tourism Management, 30(1), pp. 123-127.
Wu, Y. L., Tao, Y. H. and Yang, P. C., 2012. Learning from the past and present: measuring Internet banking service quality. The Service Industries Journal, 32(3), pp. 477-497.
Xie, K. L., Zhang, Z. and Zhang, Z., 2014. The business value of online consumer reviews and management response to hotel performance. International Journal of Hospitality Management, 43, pp. 1-12.
Yalcin, S., 2009. Standardization. In: Wankel, C., 2009. Encyclopedia of Business in Today’s World. Thousand Oaks: SAGE.
Zikmund, W., Babin, B., Carr, J. and Griffin, M., 2012. Business research methods. s.l: Cengage Learning.