EAESP/FGV/NPP - NÚCLEODEPESQUISAS EPUBLICAÇÕES 1/94
RE L A T Ó R I O D E PE S Q U I S A Nº 2/ 1998
RESUMO
O presente relatório origina-se de projeto destinado a analisar a gestão da qualidade no setor de serviços nacional. A pesquisa foi conduzida através do envio de questionário, contendo 135 perguntas, a uma amostra, selecionada por conveniência, de empresas de grande, médio e pequeno portes do segmento de serviços. A sondagem cobre aspectos socioorganizacionais, técnico-tecnológicos e econômico-competitivos das indústrias. Foram avaliados os procedimentos usados na gestão da qualidade e os resultados obtidos. O trabalho insere-se numa pesquisa mundial sobre gestão da qualidade, coordenada pelo Prof. Gustavo Vargas da Universidade Estadual da Califórnia em Fullerton.
PALAVRAS-CHAVE
Gestão da qualidade; Serviços; Modernização; Competitividade; Práticas empresariais.
ABSTRACT
EAESP/FGV/NPP - NÚCLEODEPESQUISAS EPUBLICAÇÕES 2/94
RE L A T Ó R I O D E PE S Q U I S A Nº 2/ 1998
KEY WORDS
EAESP/FGV/NPP - NÚCLEODEPESQUISAS EPUBLICAÇÕES 3/94
RE L A T Ó R I O D E PE S Q U I S A Nº 2/ 1998
SUMMARY
I. Introduction ... 7
II. Methodology ... 9
III. Survey interviews conduction ... 11
IV. The evolution of the industry and of the services sector in Brazil ... 12
V. The Brazilian macroeconomic environment ... 14
VI. Quality in Brazil ... 17
VII. Results achieved and analysis ... 21
1. Main characteristics of the researched companies... 23
2. Quality challenges and drivers... 24
3. Degrees of difficulty and utility in the implementation of quality programs and actions ... 25
4. Development, implementation and evolution of quality programs and actions... 27
5. Economic and multistructural impacts and results of quality ... 28
6. Macroeconomic and infrastructure support ... 28
7. Education and responsibility for quality management... 29
8. Hindering factors and difficulties faced for quality success ... 32
9. Advantages originated from the quality system ... 33
VIII. Conclusions ... 33
EAESP/FGV/NPP - NÚCLEODEPESQUISAS EPUBLICAÇÕES 4/94
RE L A T Ó R I O D E PE S Q U I S A Nº 2/ 1998
X. Annex I - Tables ... 39
1. Sample profile ... 40
2. Challenges and drivers of quality... 42
3. Degree of difficulty and utility of quality programs and actions ... 43
4. Contribution to the improvement of organization development – programs and actions ... 44
5. Need of government policies and programs ... 45
6. Trained personnel in quality issues ... 46
7. Themes addressed in personnel training in quality control and processes ... 47
8. Interest in updating of knowledge of quality management ... 48
9. Responsibility for the critical dimensions in quality management (transnational) ... 49
10. Hindering factors faced for the success in quality... 50
11. Difficulties for the success in the implementation of quality management .... ... 51
12. Advantages originated from the quality system ... 52
XI. Annex II - Pictures ... 53
1. Factors of success, survival and growth (next five years) ... 54
EAESP/FGV/NPP - NÚCLEODEPESQUISAS EPUBLICAÇÕES 5/94
RE L A T Ó R I O D E PE S Q U I S A Nº 2/ 1998
3. Degree of difficulty in the implementation of quality programs and
actions (situation in the short run) ... 56
4. Degree of utility of quality programs and actions (short and long run) ... 57
5. Quality management: situation in the short run... 58
6. Quality management: situation in the long run... 59
7. Hindering factors and difficulties faced to the quality success... 60
EAESP/FGV/NPP - NÚCLEODEPESQUISAS EPUBLICAÇÕES 6/94
RE L A T Ó R I O D E PE S Q U I S A Nº 2/ 1998
ACKNOWLEDGEMENTS
This work benefited from the collaboration of the following people:
Prof. Claude Machline, Ph.D., Emeritus Professor of the EAESP/FGV
Profª Gisela Taschner, EAESP/FGV’s Research and Publications Center Director
Prof. Marcos Vasconcellos, EAESP/FGV’s Production and Operations Department
Frederico A. Turolla, Master Candidate, EAESP/FGV
EAESP/FGV/NPP - NÚCLEODEPESQUISAS EPUBLICAÇÕES 7/94
RE L A T Ó R I O D E PE S Q U I S A Nº 2/ 1998
QUALITY MANAGEMENT IN BRAZIL
José Delazaro Filho
I. INTRODUCTION
The California State University at Fullerton is coordinating a Worldwide Survey on Quality Management in Mid-Sized Economies. The survey is being conducted by local institutions in several countries. The list of countries include Spain, Mexico, Hong Kong, Malaysia, Argentina, Peru, and Brazil. In some of these countries the work is already concluded.
In Brazil, the local institution that was invited to lead the survey was the EAESP/FGV (Business School of the Fundação Getúlio Vargas – São Paulo). This institution, through its Research and Publications Center (NPP) and the Production and Industrial Operations Department (POI) undertook the present study, covering the Brazilian manufacturing, processing and services industries.
The relevance of the concept of Quality among managers would by itself justify the undertaking of a survey focused on this theme. Results of a 1995 survey carried out by the National Industry Confederation reinforce the importance of the subject: in a large sample of industrial companies, their managers chose the item “Creation and Broadening of Quality Programs” as their main strategy in their adjustments to face
trade deregulation. In this survey, almost 90% of the answers pointed to Quality as a priority, followed in the ranking by the rationalization of production lines, and by human resources training.
EAESP/FGV/NPP - NÚCLEODEPESQUISAS EPUBLICAÇÕES 8/94
RE L A T Ó R I O D E PE S Q U I S A Nº 2/ 1998
reduction, delivery time, technology and innovation, in Brazil and abroad. Several books also report experiences in Total Quality Control programs implementation in national companies. However, methods and techniques used by the companies, and the actual results as well, are not always transparent. It is worthy mentioning that quality programs are long lasting, and, therefore, surveys should be carried out with a certain frequency.
Nothing is more useful to assure the survival and the progress of the Brazilian industry than knowing for sure the viability and the stage of implementation of
imported quality programs and methodologies such as Total Quality Control, ISO
9000, National Quality Award, Quality Function Deployment, Value Analysis and other.
This survey gathers information about quality management and analyzes the results achieved by Brazilian companies, aiming at knowing which methods and management systems are currently being used in our companies, and which of them are succeeding in quality terms.
On a wider scope, the project analyzes quality management in Brazilian companies. The survey covered social-organizational, technical-technological, and economical-competitive aspects of the industries.
The survey was carried out in three stages, focusing on the manufacturing, processing, and services areas, respectively. The scopes of these categories are listed below.
EAESP/FGV/NPP - NÚCLEODEPESQUISAS EPUBLICAÇÕES 9/94
RE L A T Ó R I O D E PE S Q U I S A Nº 2/ 1998
The processing industry, on the other hand, is made up by segments with central focus on chemical reaction or mechanical transformation, in which the final product is not identifiable as discrete units. That is the case of chemical, petrochemical, metalwork, ironwork, glass, cement, and others.
The services industry is characterized by its intangibility, and comprises the following major segments: advertising, promotion and public relations, communication and information, editing and printing, banks, finance and insurance, data processing and software, health care, consulting, auditing and counseling, education and formation, legal and management, research and engineering, real estate, fashion, design and art, leisure and entertainment, hotels, travel and restaurant, distribution, retail sales, wholesale, transportation, repairs, maintenance and recovery, public service (power, gas, etc.), and government services.
II. METHODOLOGY
EAESP/FGV/NPP - NÚCLEODEPESQUISAS EPUBLICAÇÕES 10/94
RE L A T Ó R I O D E PE S Q U I S A Nº 2/ 1998
In general, the questionnaires were structured by the international team, and adjusted by ourselves to cover, among others, the following main quality management related topics:
• Characteristics of the Brazilian companies involved in projects related with quality management;
• general challenges and specific drivers of quality;
• difficulties found in quality programs and actions;
• usefulness of quality programs and actions;
• development, implementation and evolution of quality programs and actions;
• impacts and results of quality;
• infrastructure and macroeconomic support required for quality achievement;
• education and responsibility for quality management;
• hindering factors and difficulties faced to achieve quality;
• advantages originated from the quality system.
To achieve such goals, the survey questionnaires formulated 135 multiple choice questions to the interviewed companies, focusing on each of the above mentioned aspects in a high level of detail.
According to the widely accepted methodology in the international research program, the sample was selected according to convenience criteria, and it met the following mutually exclusive requirements:
• to have more than 300 employees;
EAESP/FGV/NPP - NÚCLEODEPESQUISAS EPUBLICAÇÕES 11/94
RE L A T Ó R I O D E PE S Q U I S A Nº 2/ 1998
• to be among the leaders in quality within its sector, or to be relevant in its economic context;
• to have an ongoing quality program.
The sample selection did not obey to random criteria, and was driven by convenience. The reason for this approach is that the survey is expected to reflect what the leaders in quality and successful implementers do, instead of reflecting what most industries do in terms of quality management. Clearly and logically, where the leaders go, the rest will follow. Thus, a deliberate obliquity was introduced in the sample selection, considering the intention of reflecting the best practices in quality management, in accordance with the approach used by researchers in the other countries.
III. SURVEY INTERVIEWS CONDUCTION
Each stage of the project was undertaken according to the steps described below, in which the main activities are highlighted, as well as some difficulties found:
• questionnaire design;
• the sample selection: a set of proprietary lists, besides Fiesp/Ciesp`s Industry Yearbook 96/97, were used. Several publications were also used, and other available lists as well, to select companies that would fit into the research criteria;
EAESP/FGV/NPP - NÚCLEODEPESQUISAS EPUBLICAÇÕES 12/94
RE L A T Ó R I O D E PE S Q U I S A Nº 2/ 1998
the non-answered questions. Such facts, though, did not harm the development of the research.
• Receipt and follow-up of the answers: in the contacts with the quality area personnel, it was possible to identify some reasons that prevented a higher index of answers:
* questionnaire length: it was considered too long and complex;
* excess of work in the quality area in most of the companies. The Quality area personnel was too busy, with low availability of time for activities other than their own.
* Most services companies showed an additional difficulty, which is the early stage of development in quality issues in this area, or even the absence of a specific quality management area. The services sector, and this is not a coincidence, had a lower index of return. In item IV, the difference in relative speed of development in assimilating quality tools among sectors is explained.
IV. THE EVOLUTION OF THE INDUSTRY AND OF THE
SERVICES SECTOR IN BRAZIL
Except for isolated cases, the installation of industries in Brazil only started by the end of the last century. In the period between Word War I and World War II, the industrialization got an effective impulse, but it was only in the Fifties that the country could start an industrialization process.
EAESP/FGV/NPP - NÚCLEODEPESQUISAS EPUBLICAÇÕES 13/94
RE L A T Ó R I O D E PE S Q U I S A Nº 2/ 1998
involvement in the process included the design and implementation of the protection system, promotion and regulation, and even direct partnership in the productive investment. The Brazilian government created a huge State-owned production scheme in sectors such as oil, chemical, steel production, and infrastructure.
The strategy was successful. According to Coutinho (1994), as early as 1980, the Brazilian industrial structure showed a high degree of sector integration and production diversification. Such a structure was not significantly different from those of most developed economies. Just like the industrialized countries, Brazil had a significant part of the industrial production originated from the chemical and metal-mechanic complexes.
On the other hand, the industrialization through imports substitution revealed itself insufficient to foment the innovation capacity of the national industry. According to Coutinho (1994), the technological efforts in the period were “limited to those required by production in itself”. Besides the insufficient capacity to develop new products and processes, other central issues of the prevailing industrialization model until the eighties were the absence of a clear standard of specialization, and the insufficient integration with international markets.
In the absence of the adequate incentives, the Brazilian industry entered the 90`s operating technologically outdated facilities, showing shortage in processes technology, and retard regarding products technology, and investing a small fraction of sales revenue in research and development activities.
EAESP/FGV/NPP - NÚCLEODEPESQUISAS EPUBLICAÇÕES 14/94
RE L A T Ó R I O D E PE S Q U I S A Nº 2/ 1998
qualification. In this last issue, the problem is widespread over the Brazilian educational system, which shows deficiency in almost all levels.
The 90`s brought important changes to the scenario, specially on what concerns the industrial policy and other macroeconomic aspects. The present decade witnesses the interment of the imports substitution model, and the end of the long era of protection used as industrial policy instrument. In this new phase, the exposure to the international competition, both in internal and external markets, inaugurated unprecedented challenges to the local industry. The new scenario of the 90’s, and the recent years is the object of the analysis in item V – The Brazilian Macroeconomic Environment.
V. THE BRAZILIAN MACROECONOMIC ENVIRONMENT
The Brazilian economy began the 90’s amid the inheritance of a strong recession originated in the precedent decade. Since 1930, the country used intense government partnership in the production, and a high degree of tariff and non-tariff trade barriers to imports to create a huge industrial complex based on the substitution of imports by national production.
The government intervention, barriers in almost all sectors, and the consequent low degree of internal competition brought low efficiency, and market distortions that implied in difficulty to compete internationally, a basic requirement to the survival of enterprises in a globalized environment where huge blocks of countries are created.
EAESP/FGV/NPP - NÚCLEODEPESQUISAS EPUBLICAÇÕES 15/94
RE L A T Ó R I O D E PE S Q U I S A Nº 2/ 1998
enterprises to an unprecedented level of competition in their local markets. To make things worse, besides the operating and processes deficiency, the competitivity conditions of the national industries were degenerated due to inefficiency in infrastructure such as ports equipment, transportation and telecommunications, and generation and distribution of electric power. At the same time, the conditions imposed by the need to promote the external balance under currency over-evaluation forced the maintenance of high internal interest rates as a form of attraction to the foreign speculative investment.
So, recently, to the joint pressure originated from the over-evaluation of the currency and low import tariffs it was added as worsening factor: high interest rates, high infrastructure costs, unbalanced tax collecting system and inadequate distribution of the fiscal burden, incidence of taxes over exports, low levels of health and education, among other structural deficiencies. These elements make up a condition that exposes the national industry to a strong competitive pressure, forcing it to scale cost reduction, quality levels, and operating efficiency.
From the point of view of the external balance, the recovery of trust of investors in the country, probably associated to factors such as democratic consolidation and progression in inflation reduction has attracted foreign productive investments in extraordinary volume. The external capital entry, though, may suffer reduction in function of the recent international stock exchange crisis that depressed the prices of real estate all over the world, and reduced the exceeding liquidity in the world, a probable “speculative bubble” that fed emergent economies with an important flow of resources. Even though, the country preserved a good reputation among emergent markets, and may attract a considerable part of the remaining investment capital flow. This tendency may be reinforced by the volume of assets that still remain in the hands of the government, and that attracts the attention of foreign investors.
EAESP/FGV/NPP - NÚCLEODEPESQUISAS EPUBLICAÇÕES 16/94
RE L A T Ó R I O D E PE S Q U I S A Nº 2/ 1998
reducing significantly Brazil’s risk in international markets, bringing good perspectives for the country. However, the fulfillment of the promise still depends on aspects such as the public sector financing requirements, which remain too high, and the presence of a significant external debt. On the external side, the balance of payments is heavily dependent on capital flows, bringing some fragility to the balance. A recent turmoil shaking East Asian economies put in risk the external financing, but the high flows were promptly recovered right after the main signals of the crisis went out of the scenario. The fiscal risk is relieved by the huge assets portfolio of the public sector, which is generating significant flows to the privatization process. In this sense, the privatization revenues help the external balance through the attraction of direct investments, and the fiscal balance by generating revenues to the public sector.
The National Privatization Program (PND), started in 1990, is succeeding both on the fiscal aspect, generating significant revenue and public debts payments, from the point of view of transference of property. Regarding the latter, about fifty companies were already sold to the private sector, including the Companhia Vale do Rio Doce, Companhia Siderúrgica Nacional, and other important enterprises.
EAESP/FGV/NPP - NÚCLEODEPESQUISAS EPUBLICAÇÕES 17/94
RE L A T Ó R I O D E PE S Q U I S A Nº 2/ 1998
Another important step was the auctions for concession of the 22,000 km railroad system operated by Rede Ferroviária Federal. Other 2,000 km of tracks were sold together with the Companhia Vale do Rio Doce. The remaining 5,000 km are owned by Fepasa, the São Paulo State railroad company, which has its concession auction scheduled for 1998. The privatization in the railroad sector brings an important force of change in the Brazilian cargo transportation system matrix, with potential high effects on production costs. Transportation costs are also declining due to concessions of toll roads, and increasing competition in the airlines sector. International transportation is also benefiting from these efforts, by the privatization of ports, and through the modernization of the Labor laws that burden ports operation in Brazil.
Other initiatives oriented to face these challenges is the Brazilian Program on Quality and Productivity (PBQP), a government effort. However, almost 9 years after its start, the outcomes are still below expectations.
Within the challenging environment that was described, the quality improvement must be a need. This study presents in its results the practices of the national industry in seeking competitiveness through quality, allowing to detect the signs of survival, and to assess the current practices that are essential for economic and business growth.
VI. QUALITY IN BRAZIL
EAESP/FGV/NPP - NÚCLEODEPESQUISAS EPUBLICAÇÕES 18/94
RE L A T Ó R I O D E PE S Q U I S A Nº 2/ 1998
quality concepts, defining its own requirements, creating difficulties to the autoparts companies.
Even considering Petrobrás and the automotive companies as the starters, few results were achieved in the national level affecting other industries before the seventies, when the aeronautic industry was installed, and the nuclear industry had its first contracts signed up. Behind these industries, standards for quality systems management were introduced with worldwide acceptance.
These events brought the concern with quality to the Brazilian industry, but still did not create a general movement of the whole industry, remaining limited to the biggest companies.
As from 1990, the first Portuguese version of the NBR ISO 9000 (the Brazilian Standard related to the international standard) was issued. The first company to obtain a ISO 9000 certificate was VIBASA – Villares Indústrias de Base S.A.. From this year on, more companies became interested in quality, while others were forced to do it by the international competition. At this time, a wide movement of certification under the ISO 9000 standards was initiated.
Slowly, the ISO 9000 certification grew up, driven also by the PBQP. Brazil has been keeping high rates of growth in ISO 9000 certification. In 1996, there were more than 1,500 certificates, a figure that makes the country one of the 15 with the higher level of certification worldwide. Certifications are still growing fast.
EAESP/FGV/NPP - NÚCLEODEPESQUISAS EPUBLICAÇÕES 19/94
RE L A T Ó R I O D E PE S Q U I S A Nº 2/ 1998
Presently, the quality requirements in a company are most of the time linked to the
Just in Time system, acting as pre-requisites to the implementation of such a system.
The Just in Time concept may be seen as the pursue of the elimination of waste of resources, and continuous improvement. In this context, quality management has been named Total Quality Control, and was developed in Japan based on Joseph M. Juran, W. Edwards Deming, and A. V. Feigenbaum’s works in the fifties.
The attribution of the responsibility for quality in production to all its components and participating personnel is one of the foundations of the total quality system. In other words, quality should be present in all the sources or parts of the processes of production, making sure that the products are being produced with the desired quality, not only undertaking inspections after the production.
As relevant aspects of the total quality control, there may be highlighted:
• Process control – the control of all stages of the process along the production. There should be a complete effort to inspect all parts produced, using the same personnel of production. Each point of work should also be a center of inspection and quality control;
• Visibility and quality correction – measurable and visible quality standards should be established, aiming at the instant detection of all abnormal situations, and the correction of the problems of quality in the same point of work that generated the problem;
• Discipline for quality – there should exist a perfect synchrony of the personnel in terms of quality goals, and the continuous appreciation of efforts of improvement. A total involvement of the management as a whole is necessary.
EAESP/FGV/NPP - NÚCLEODEPESQUISAS EPUBLICAÇÕES 20/94
RE L A T Ó R I O D E PE S Q U I S A Nº 2/ 1998
The importance of such aspects is based upon the stability of the continuous process of quality improvement.
The services sector in particular shows some special characteristics that deserve to be noticed, in function of their direct impact on the quality tools when applied to this sector1
1. Attitude. The attitudes of the service rendering personnel, such as kindness and courtesy, are essential features of services quality.
2. Promptness in delivery. In service, delay in delivery is most of the time unacceptable, specially because the services are designed to satisfy momentary needs. A clear example is the existence of long lines in an amusement park, converting the leisure time that creates value to users into an inconvenience.
3. Equipment and facilities. Cleanliness, adequacy and appearance of uniforms, tools, equipment and building are quality attributes in services, conversely to what happens with a product that contains in itself the attributes that create satisfaction. In this sense, accounting offices should be equipped with state-of-the-art computers, which are a quality attribute.
4. Product. Both, products and services, should be free of defects.
5. Consumer satisfaction. When considering this variable, one should notice the main differences between services and manufacturing/processing industries2:
• Services are intangible;
• Services are perishable;
EAESP/FGV/NPP - NÚCLEODEPESQUISAS EPUBLICAÇÕES 21/94
RE L A T Ó R I O D E PE S Q U I S A Nº 2/ 1998
• Services involve complex delivery systems;
• Services are time-sensitive;
• Consumer involvement is unpredictable;
• Consumer standards are difficult to identify, frequently involving preferences or even mood.
Among the three sectors analyzed in this work, it was clear that, theoretically, the services sector is the one that assimilate most slowly the quality management tools. According to ARMSTRONG and SYMONDS (1991), the fluid nature of the product is responsible for the biggest difficulties in quality improvement in services. As a consequence, in 1991, according to the authors, only 10% of the American service providers had an ongoing quality program. However, the forecasts for the year 2000 are that this figure will increase up to 70% of the companies with more than 500 employees. The services usually considered as more aggressive are the financial services, health and government, followed by retailers and universities.
VII. RESULTS ACHIEVED AND ANALYSIS
EAESP/FGV/NPP - NÚCLEODEPESQUISAS EPUBLICAÇÕES 22/94
RE L A T Ó R I O D E PE S Q U I S A Nº 2/ 1998
Number of
Questionnaires Sent
Questionnaires returned and included in the analysis
(number and % of total)
Manufacturing Industry
205 42 20.5%
Processing 220 34 15.5%
Services 202 17 8.5%
TOTAL 627 93 15.5%
The Table shows that, according to previous expectations, the manufacturing sector shows the highest index of return, due to the fact that the quality management techniques are more spread and effective in this sector. Still within previous expectations, the services sector produced the smallest return, due to slower diffusion of quality management in this sector.
Even considering the questionnaire length and the high effort required to answer it, most of the results are discussed in this Report according to the format of the proposed questions. However, some were aggregated for operating purposes. The following themes include most of the questions answered, namely:
• Characteristics of the researched companies;
• Quality Challenges and Drivers faced by the companies;
• Degree of utility and difficulty in the implementation of programs and actions of quality;
• Impacts, and economic and multi-structural results of quality;
EAESP/FGV/NPP - NÚCLEODEPESQUISAS EPUBLICAÇÕES 23/94
RE L A T Ó R I O D E PE S Q U I S A Nº 2/ 1998
• Education and responsibility for quality management;
• Hindering Factors and difficulties faced to achieve quality;
• Advantages of the quality system.
The analysis and structuring of the results followed the same general lines of the report concerning the Spanish industry. In this sense, such procedure was adopted to create compatibility of information and conclusions, as well as to make easier the international comparisons. Thus, the same logical structure of organization of the questions, text, and conclusions was used as in the Spanish report. The same logic was employed in the three preliminary reports already published by the Research Publications Center at EAESP/FGV.
1. MAIN CHARACTERISTICS OF THE RESEARCHED
COMPANIES
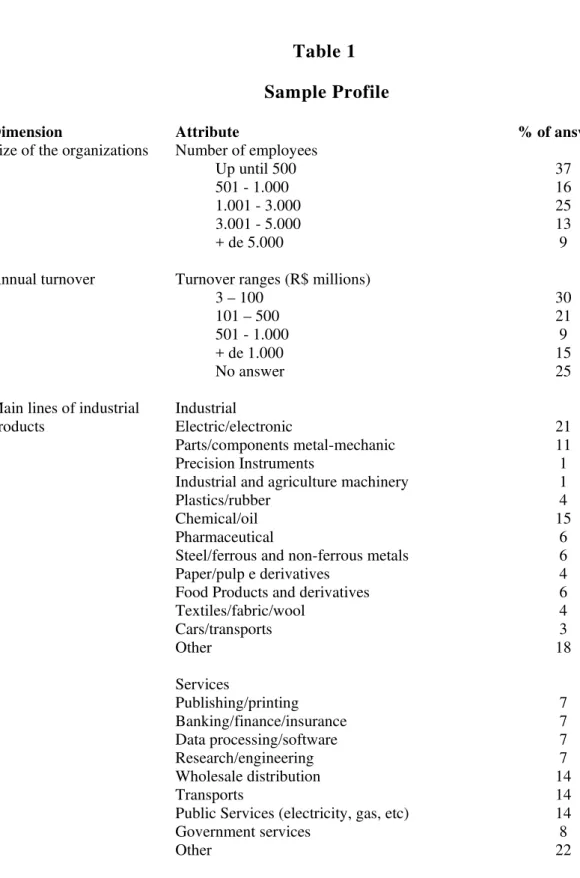
The profile of the sample companies is shown in Table 1 – Sample Profile.
Following a criterion of size, the sample is distributed as follows: 37% of the companies are small sized, with less than 500 employees. In the medium size range (501 to 5,000 employees) there are 58% of the companies, while 9% can be considered as big companies, with more than 5,000 employees.
The annual sales follow the same distribution: 30% of the companies sell among 3 to 100 million reais per year, and can be considered as small size companies. The
remaining medium and big size, with sales of more than 100 million reais per year,
EAESP/FGV/NPP - NÚCLEODEPESQUISAS EPUBLICAÇÕES 24/94
RE L A T Ó R I O D E PE S Q U I S A Nº 2/ 1998
The products and services lines are rather diversified. Among the products lines, the more representative are the electrical/electronic with 21%, chemical/oil with 15%, parts, and metal-mechanic components with 11%. The segment Other, representing 18% of the questionnaires, shows a wider diversification of product lines.
The services lines are also diversified. Wholesale distributors, transportation, and public services were the most representative, 14% each. Government services correspond to 8%, while publication/printing, banking/financial/insurance, data processing/software, and research/engineering represent 7% each, a still representative participation. Other segments total 22%.
Operations in the product area are characterized by high volume, totaling 63% of the answers. Most of the manufacturing and processing companies show repetitive operations (86%).
Services companies focus on high volume (64%). Concerning the distinction between standardized and personalized services, the sample is homogeneous, with 42 and 51% respectively.
2. QUALITY CHALLENGES AND DRIVERS
The more relevant challenges and drivers are shown in Table 2 – Challenges and Quality Drivers, as well as in Picture 1 – Factors of Success, Surviving, and Growth, showing the relative importance in a scale from 1 (very low) to 5 (very
high).
EAESP/FGV/NPP - NÚCLEODEPESQUISAS EPUBLICAÇÕES 25/94
RE L A T Ó R I O D E PE S Q U I S A Nº 2/ 1998
responsibility for the product, and government regulation received a medium importance. In this particular, it is worthy mentioning that the companies did not rely, and should not rely exclusively on quality programs instead of other resources and interests of the organization.
As main drivers, the companies highlighted greater quality requirements of product, opportunities offered by computing/communications, need to reduce operating costs, growing international competition, better usage of resources, Mercosul creation, and better education of their personnel, in decreasing order, but all of them with an index higher than four (high importance).
The answers on the drivers made clear that for those enterprises, the efforts on quality seeking are associated with a combination of organizational, competitive, and economic causes. In this last aspect, it is evident that the motivation for this quality achievement is strongly linked to the inputs from the macroeconomic environment described in item V, including the challenges originated from the economic integration.
3. DEGREES OF DIFFICULTY AND UTILITY IN THE
IMPLEMENTATION OF QUALITY PROGRAMS AND
ACTIONS
EAESP/FGV/NPP - NÚCLEODEPESQUISAS EPUBLICAÇÕES 26/94
RE L A T Ó R I O D E PE S Q U I S A Nº 2/ 1998
As it can be seen in Table 3 and Picture 3, most quality programs did not face extraordinary difficulties to be implemented. The difficulty scale ranges between 0 (no difficulty), and 3 (complex difficulty) and is presented for short and long run.
In the short run, there was no item with difficulty higher than simple. In the long run, the items Human Resources Management, Payback systems, and High Management Support were appointed as routine difficulty, while the remaining items were considered of simple difficulty.
It is worthy noting that the difficulty originated from high management support, Payback systems, and Human Resources Management increase considerably when the time horizon increases. In the Manufacturing Industry, however, the difficulty in the long term for these items, except for the Human Resources Management, does not reach the routine difficulty level, though it increases with time. In the processing sector, the aspects of product/service/process development, and the methodologies/technologies of analysis/management control show a higher difficulty evolution than other sectors. The site management and maintenance management showed both low difficulty in the short and long runs.
Regarding the utility, all the listed points were considered as moderately useful, both in the short and in the long run. Comparatively, these item show slightly significant differences in utility. In the short term, for materials, suppliers, and distribution management, and Human Resources management. In the long run, the items high management support, quality assurance, and development of products/services/processes show higher relevance.
EAESP/FGV/NPP - NÚCLEODEPESQUISAS EPUBLICAÇÕES 27/94
RE L A T Ó R I O D E PE S Q U I S A Nº 2/ 1998
the long run, taken individually or together, seems more significant in the services sector than in the manufacture and processing sectors.
An interesting aspect of the results obtained in this item concerns the comparison between difficulties and utilities of programs and actions for quality management. In general, the indices obtained for utility are rather higher than those obtained for difficulties, showing a positive expectancy of the companies regarding quality management. Another view of the relationship between difficulty and utility is shown in the next topic, with the analysis of specific graphs.
4. DEVELOPMENT, IMPLEMENTATION AND
EVOLUTION OF QUALITY PROGRAMS AND ACTIONS
Both Picture 5 – Quality Management: Short Term Situation and Picture 6 – Quality Management: Long Term Situation link explicitly the degrees of difficulties
and utility of the several quality programs, and actions in the short and in the long run. This item aims at defining some criteria for development and implementation of these programs.
In ideal terms, a company should, in the short run, undertake the programs and actions of the first quadrant, i. e., high utility and low difficulty. As the next step, it could seek for programs and actions in the second and third quadrants, but remaining always above, and to the right of the 45o line. At last, it should look for the remaining programs and actions located below the 45o line; the programs and actions located in the fourth quadrant should be postponed.
EAESP/FGV/NPP - NÚCLEODEPESQUISAS EPUBLICAÇÕES 28/94
RE L A T Ó R I O D E PE S Q U I S A Nº 2/ 1998
the first quadrant. In general, the actions are positioned above the 45o line in the short and long runs, meaning a higher level of utility than difficulty in each action.
5. ECONOMIC AND MULTISTRUCTURAL IMPACTS AND
RESULTS OF QUALITY
The Table 4 - Contributions to the Improvement of Organizational Development
shows and associates the contributions of the researched programs and actions that affect the organizational performance. These contributions are based on programs that impact the four critical quality drivers: quality, cost, flexibility, and client service. This multi-dimensional analysis comes from the information presented in
Table 2 – Challenges and Quality Drivers, in which its clear that in Brazilian
companies, as well as in emerging and industrialized countries, a quality oriented program or action interferes and promotes positive results in other aspects of importance to its performance and improvement of the organizational performance.
Table 4 shows that programs and actions impact primarily the quality, both in the short and in the long run. Some, however, have more evident effects on quality than others. In the short run, these actions are: high management support, payback systems, Human Resources Management, and quality assurance. In the long run, the development of product, services, and processes has a more significant effect on quality.
6. MACROECONOMIC AND INFRASTRUCTURE
SUPPORT
EAESP/FGV/NPP - NÚCLEODEPESQUISAS EPUBLICAÇÕES 29/94
RE L A T Ó R I O D E PE S Q U I S A Nº 2/ 1998
competitivity-oriented business development, and for the efficiency of the productive system.
Table 5 – Need of Government Policies and Programs for Quality Improvement
presents a profile of policies and government programs to help or support the effort of local companies for both the short and long runs.
Remarkably, in the short term, fiscal incentives to investment and to personnel formation, besides the flexibility of the labor market, were pointed out by the companies as relevant government policies and programs. The companies also appointed moderate credits for development and formation, fiscal incentives to develop new technologies/products, infrastructure improvement, and better programs of general education.
More relevant in the long term is the promotion of scientific-professional sponsorship, privatization programs, higher investment in technical and professional education, and higher investment in basic education.
The results obtained reinforce the opinion that the policies of incentives and professional development are fundamental for quality development and market growth.
7. EDUCATION AND RESPONSABILITY FOR QUALITY
MANAGEMENT
In function of the great importance of training and education, the Table 6 – Personnel Trained in Quality Subjects and Table 7 – Subjects Covered in Quality
Control and Process Training present the extension and content of themes
EAESP/FGV/NPP - NÚCLEODEPESQUISAS EPUBLICAÇÕES 30/94
RE L A T Ó R I O D E PE S Q U I S A Nº 2/ 1998
Table 6 shows a great involvement in all levels of the Brazilian companies with training programs on quality issues. In general, the efforts of these companies in its involvement with quality have been very strong in recent years, specially in function of the ISO system. It can be highlighted that this movement is a start in the quality field, and the training process is in progress. The majority of the personnel knows about quality and its importance, and are prepared and motivated to contribute to the growth in the program implementation. The data shown in the referred Table reinforce the argument that the quality movement in Brazilian companies is irreversible, and its importance has been reassured by several international organizations.
It should be clear, however, that the technical training in quality will grow a lot along the following years, given the importance of the theme for the success and survival of the companies.
Table 7 shows the contents of formation in quality control and processes. There is a large interest and involvement of the personnel with such themes. This conclusion may be produced by the lack of in-depth investigation in the questionnaire, which did not address questions on the depth of preparation, and the level of knowledge accumulated in these control levels. Thus, one should not declare that most of the personnel of the sample companies have effective conceptual qualification and practice in these complex items. The result, however, shows a strong potential to help in the implementation of control systems. Analyzing Table 7, a relative efficiency is evident in the use of computers in the industries, a fact perfectly explained by the economic blocking to which the country was submitted during the market reserve in the computers sector.
EAESP/FGV/NPP - NÚCLEODEPESQUISAS EPUBLICAÇÕES 31/94
RE L A T Ó R I O D E PE S Q U I S A Nº 2/ 1998
implementation of SCP and dispersion diagrams. The less addresses themes are CCP usage in microcomputers and histograms of probabilities.
In the services sector, the more addressed themes are similar, with the exception of SCP implementation, Control charts by attributes, Control charts by variables, and sampling statistics.
In Table 8 – Interest for Updating Knowledge in Quality Management, the degree of
interest is represented by a scale ranging from four (high interest) to zero (no interest). It can be noticed that, in general, the companies show a high interest in learning. This fact reinforces the high involvement and motivation shown by the operating and executive personnel with the implementation of quality management systems.
Comparing the index of interest for the update of knowledge about quality management along the three researched sectors, it is clear that the manufacturing and processing segments reach a higher index than the services sector.
In transnational companies in Brazil, concerning the location of responsibility, or the effective interference in the critical dimensions of the quality management, a strong presence of the mother organization is evident, especially in activities related to the project of products and processes, as shown in Table 9 – Responsibilities for Critical Dimensions in Quality Management.
EAESP/FGV/NPP - NÚCLEODEPESQUISAS EPUBLICAÇÕES 32/94
RE L A T Ó R I O D E PE S Q U I S A Nº 2/ 1998
8. HINDERING FACTORS AND DIFFICULTIES FACED
FOR QUALITY SUCCESS
Table 10 – Hindering Factors for Quality Success and Picture 7 – Hindering
Factors and Difficulties for Quality Success indicate the main impacts on quality
implementation on a scale from 1 (negative impact) to 5 (positive impact). Through the analysis of Table 10, it is clear that the companies consider that the main factors linked to success are relatively easy to be implemented in the initial stages of implementation of the quality system.
The factors mentioned as those of less difficulty were the lack of individual responsibility, the lack of adequate training, company practices incompatible with the quality objectives, the lack of clearly defined criteria, and low communication between management levels.
The more important hindering factors are the external economic factors, outdated technology, delayed delivery of material by suppliers, lack of personnel, non availability of the best equipment, and excessive concern with costs.
The importance given to the external economic factors, together with unavailability of the best equipment are related with the typical instability of the Brazilian macroeconomic environment now lessened, and the difficulties to update the national technological park, always outdated in relation to the state of the art employed in developed countries. The concern with the delays from suppliers may reveal the lack of dissemination of quality programs from the Brazilian enterprises to the suppliers.
Table 11 – Difficulties for the Success in Implementation of Quality Management
EAESP/FGV/NPP - NÚCLEODEPESQUISAS EPUBLICAÇÕES 33/94
RE L A T Ó R I O D E PE S Q U I S A Nº 2/ 1998
9. ADVANTAGES ORIGINATED FROM THE QUALITY
SYSTEM
In Table 12 – Advantages originated from the Quality System, the potential gains
due to the implementation of the quality system are shown. Most of the answers showed an advantage smaller than 19% (68% of the answers). Inside this range, 21% assess advantages smaller than 5%, while 28% stayed in the range 5-10%. The remaining 19% stayed in the range of 11-19%. About 23% revealed uncertainty on the advantages of the quality system.
In the services sector, the level of uncertainty reached 50%. The remaining 40% in this sector concentrated in the range of 0 to 19% of total sales.
VIII. CONCLUSIONS
Particularly, each item was analyzed along the research, and specific conclusions were reached in each one of the them in the body of the report. The general conclusions that could be reached are the following:
• The quality increased its importance for the survival of the Brazilian manufacturing, processing and services industries. Even considering its initial stage of implementation, quality management systems are being built as a competitive strategy, and shown up as a tool to achieve productivity and flexibility in the production process. However, it was clear in this report that the quality-related aspects are not the only objectives of the companies, since factors related with productivity, cost reduction, rationalization of methods and processes, human resources development, and others are also present.
EAESP/FGV/NPP - NÚCLEODEPESQUISAS EPUBLICAÇÕES 34/94
RE L A T Ó R I O D E PE S Q U I S A Nº 2/ 1998
incorporation of new practices, however, these difficulties reduce along time. It is clear in this report that the concern of Brazilian industries with quality is an irreversible process.
• Quality programs stimulate the general development of the companies, improving operating performances, as well as promoting improvements in the organizational unit, and in the sense of responsibility of the personnel involved.
• In the Brazilian industries, a significant effort of human resources preparation in the quality field is being made. At the same time, this report showed the effective involvement of people with the programs. The importance of the theme is strongly considered among the companies, both from the point of view of their own human resources capacitating, and the government support with policies in this direction.
• The Brazilian macroeconomic environment and its dynamic characteristics have been an important driver of quality efforts in local companies. It is clear that they are reacting strongly to the difficulties arisen from this environment, and the quality management shows up as a natural response to the challenges presented. This aspect is confirmed by the results of the survey, both implicitly and explicitly.
Many other conclusions may be reached as from the presentation and analysis of the item, as well as many other information and results crossing may be done, which have not been discussed in this report.
EAESP/FGV/NPP - NÚCLEODEPESQUISAS EPUBLICAÇÕES 35/94
RE L A T Ó R I O D E PE S Q U I S A Nº 2/ 1998
are the key to this process. Many adjustments and reformulation will be necessary in time to reach success, but in general it must be considered that the Brazilian enterprises have prospered amid difficulties in the field of quality management.
IX. BIBLIOGRAPHY
ARMSTRONG, Larry. SYMONDS, William C. Services: Far Beyond the Routine “At your Service””. Republishing of article published in Business Week on Dec. 2, 1991. Brazilian Program of Quality and Productivity, 1991.
CARVALHO, Antonio Luís; Claude Machline; José Delazaro Filho and Walter Delázaro. Implementation and Certification in ISO 9000 Norms. São Paulo:
Marcos Cobra Editora, 1996.
CONFEDERAÇÃO NACIONAL DA INDÚSTRIA (CNI). Competitivity and Industrial Strategy: The Vision of Brazilian Industry Leaders. CNI, 1989.
________________. Commercial Opening & Technological Strategy - 5ª Research: The Vision of Brazilian Industry Leaders in 95. Vol. 5, dec. 1995.
COUTINHO, Luciano and João Carlos Ferraz (Coords). Study of Competitivity of the Brazilian Industry. Campinas: Papirus, Editora da Unicamp, 1994.
CROSBY, P. B. Quality without tears. Rio de Janeiro: José Olympio, 1992.
DELAZARO FILHO, José. Quality Management in Brazil - Sector Manufacturing Industry. Research Report published by the Center of Research and Publishing
EAESP/FGV/NPP - NÚCLEODEPESQUISAS EPUBLICAÇÕES 36/94
RE L A T Ó R I O D E PE S Q U I S A Nº 2/ 1998
_______________________. Quality Management in Brazil – Processing Sector.
Research Report published by the Center of Research and Publishing of the EAESP-FGV, 1997.
______________________. Quality Management in Brazil – Service Sector.
Research Report published by the Center of Research and Publishing of the EAESP-FGV, 1997.
__________________. Competitivity of Industries and Environmental Certification.
Research Report published by the Center of Research and Publishing of the EAESP-FGV, 1996.
DEMING, W. E. Quality: a Revolution in the Administration. Rio de Janeiro:
Marques Saraiva, 1990.
EXAME: MELHORES and MAIORES 1995. Editora Abril, São Paulo, august
1995.
FALCONI CAMPOS, V. TQC: Total Quality Control. Belo Horizonte: Fundação
Cristiano Ottoni, 1992.
FEIGENBAUM, A. V. Total Quality Control (Vol. 1). São Paulo: Makron, 1994.
FIESP/CIESP. Industry Yearbook 96/97. Editora Pesquisa and Indústrias Ltda.
Quality Management in Spain, Encuesta, Instituto de Empresa, 1993.
IMAM. Demystifying the ISO 9000: Version 1994. Instituto IMAM: São Paulo,
1994.
EAESP/FGV/NPP - NÚCLEODEPESQUISAS EPUBLICAÇÕES 37/94
RE L A T Ó R I O D E PE S Q U I S A Nº 2/ 1998
KING, Carol A. Service Quality Assurance is Different. Quality Progress, June 1985, pp. 14-18.
LEFEVRE, Henry L. Quality Service Pays: Six Keys to Success! Milwaukee, Wisconsin: American Society for Quality Control, 1989.
LUIZ, Arquimedes. Pressure Up. Revista CNI, Ano 28, nº 292, novembro/dezembro
1995.
LUZ, Alexandre Chagas. Competitivity and Competence reduce the Cost Brazil.
Revista Trevisan, setembro 1996, ano 9 nº 103.
PINTO, Jorge Lúcio. Productivity: Ascending Curve. Revista CNI, ano 29, nº 296,
julho/agosto 1996.
REVISTA CNI. 445 Years in the History of the Brazilian Industry. Revista CNI, ano
27, nº 288, march/april 1995.
RODRIGUES, Francisco Starke. Quality from Brazil. Revista Trevisan, setembro
1996, ano 9, nº 103.
VARGAS, Gustavo A. Managing Quality Within a Mid-sized Economy in
Transition. XXIX Asamblea de CLADEA, 1994.
___________________. Managing Manufacturing in an Economy in Transition:
Spain's Challenges and Responses. The IMSS Spanish Report, Madrid, Spain,
January 1995.
EAESP/FGV/NPP - NÚCLEODEPESQUISAS EPUBLICAÇÕES 38/94
RE L A T Ó R I O D E PE S Q U I S A Nº 2/ 1998
___________________ . Gestión de Calidad en España, Encuesta, Instituto de
Empresa, 1993.
VARGAS, Gustavo A. and Thomas W. Johnson. An Assessment of Quality Management in the US/Mexico Export Processing Industry. Int. J. Prod. Res.,
EAESP/FGV/NPP - NÚCLEODEPESQUISAS EPUBLICAÇÕES 39/94
RE L A T Ó R I O D E PE S Q U I S A Nº 2/ 1998
EAESP/FGV/NPP - NÚCLEODEPESQUISAS EPUBLICAÇÕES 40/94
RE L A T Ó R I O D E PE S Q U I S A Nº 2/ 1998
Table 1
Sample Profile
Dimension Attribute % of answers
Size of the organizations Number of employees Up until 500 501 - 1.000 1.001 - 3.000 3.001 - 5.000 + de 5.000
37 16 25 13 9 Annual turnover Turnover ranges (R$ millions)
3 – 100 101 – 500 501 - 1.000 + de 1.000 No answer 30 21 9 15 25 Main lines of industrial
products
Industrial
Electric/electronic
Parts/components metal-mechanic Precision Instruments
Industrial and agriculture machinery Plastics/rubber
Chemical/oil Pharmaceutical
Steel/ferrous and non-ferrous metals Paper/pulp e derivatives
Food Products and derivatives Textiles/fabric/wool Cars/transports Other Services Publishing/printing Banking/finance/insurance Data processing/software Research/engineering Wholesale distribution Transports
EAESP/FGV/NPP - NÚCLEODEPESQUISAS EPUBLICAÇÕES 41/94
RE L A T Ó R I O D E PE S Q U I S A Nº 2/ 1998
Type and volume of the operation
Types Industrial
High volume/repetitive Low volume/repetitive High volume/non-repetitive Low volume non-repetitive Services
High volume, standardized High volume, customized Low volume, standardized Low volume, customized Does not know
61 25 4 10
35 29 7 22
EAESP/FGV/NPP - NÚCLEODEPESQUISAS EPUBLICAÇÕES 42/94
RE L A T Ó R I O D E PE S Q U I S A Nº 2/ 1998
Table 2
Challenges and Drivers of Quality
Dimension Attribute Relative importance Factors of success,
survival and growth in the next five years
Product quality Productivity
Government regulation
Legal Responsibility for the product Materials/labor Costs Capital availability Labor relations 4.68 4.72 3.46 3.68 4.28 4.30 3.95 Drivers of quality
(seven most important)
Greater quality requirements of the product Need to increment flexibility
Increasing international competition Need to reduce operating costs Need to reduce quality costs Better use of resources
Higher education of its personnel
EAESP/FGV/NPP - NÚCLEODEPESQUISAS EPUBLICAÇÕES 43/94
RE L A T Ó R I O D E PE S Q U I S A Nº 2/ 1998
Table 3
Degree of Difficulty and Utility of Quality Programs and Actions
Dimension Action/program Relative importance Short run and long run Degree of difficulty of
implementation (1)
High Management support Payback systems
Human Resources Management Quality assurance
Materials, suppliers and distribution management
Maintenance management Operation/Processes management Sites Management
Development of products/services/processes Methodologies/technologies of management analysis/control 1.56 1.73 1.64 1.68 1.73 1.57 1.84 1.40 1.89 1.60 2.04 2.05 2.06 1.68 1.75 1.65 1.70 1.50 1.93 1.80
Degree of utility (2)
High Management support Payback systems
Human Resources Management Quality assurance
Materials, suppliers and distribution management
Maintenance management Operation/Processes management Sites Management
Development of products/services/processes Methodologies/technologies of management analysis/control 2.44 2.37 2.55 2.42 2.81 2.47 2.26 2.13 2.23 2.13 2.66 2.35 2.49 2.58 2.41 2.38 2.31 2.30 2.52 2.15 Reference scale: (1)
0 = No difficulty 1 = Simple Difficulty 2 = Routine Difficulty 3 = Complex Difficulty
(2)
EAESP/FGV/NPP - NÚCLEODEPESQUISAS EPUBLICAÇÕES 44/94
RE L A T Ó R I O D E PE S Q U I S A Nº 2/ 1998
Table 4
Contribution to the Improvement of Organization Development – Programs and Actions
Assessment of the contributions (% answers) SHORT RUN LONG RUN
Q C F E Q C F E
HIGH MANAGEMENT SUPPORT
55 10 24 12 46 13 27 14
Payback systems 44 15 28 14 38 18 33 10
Human Resources Management 51 21 19 9 43 24 22 11
Quality assurance 56 18 13 13 55 15 16 14
Materials, suppliers and distribution management
30 31 20 19 27 34 16 22
Maintenance management 29 32 24 15 33 34 21 11
Operation/Processes management 35 23 26 16 38 28 21 13
Sites Management 33 24 26 16 26 27 28 19
Development of
products/services/processes
46 26 17 10 54 26 12 8
Methodologies/technologies of management analysis/control
39 25 24 11 37 30 19 13
EAESP/FGV/NPP - NÚCLEODEPESQUISAS EPUBLICAÇÕES 45/94
RE L A T Ó R I O D E PE S Q U I S A Nº 2/ 1998
Table 5
Need of Government Policies and Programs
Policies /programs Relative importance (%) short run long run
Bigger investment in basic education 49 51 Bigger investment in technical-professional
education 47 53
Best programs of general education 51 49 Improvements in the physical infrastructure 52 48 Fiscal incentives to investment 76 24 Fiscal incentives to development of new technology
and/or products
53 47 Fiscal incentives to the formation of personnel 67 33
Moderate credits for development and formation 55 45 Promotion of scientific-professional sponsoring 42 58 Flexibility of the labor market 67 33
EAESP/FGV/NPP - NÚCLEODEPESQUISAS EPUBLICAÇÕES 46/94
RE L A T Ó R I O D E PE S Q U I S A Nº 2/ 1998
Table 6
Trained Personnel in Quality Issues
POSITION LEVEL 0 to 25% 26 to 50% + than 50%
Corporate Staff 21 7 72
Divisional Staff 14 3 83
Local manager 15 4 80
Direct Supervisor 15 5 80
Professional 16 5 79
Technician 14 4 81
EAESP/FGV/NPP - NÚCLEODEPESQUISAS EPUBLICAÇÕES 47/94
RE L A T Ó R I O D E PE S Q U I S A Nº 2/ 1998
Table 7
Themes Addressed in Personnel Training in Quality Control and Processes
% OF THEMES
ADDRESSED
THEMES YES NO
Pareto analysis 69 31
Charts for variables control 74 26
Histograms 89 11
Sampling statistics 81 19
Charts of control per attributes 63 37
Data Stratification 70 30
Cause-Effect Histogram 89 11
Sampling for acceptance 72 28
Adjustments to implement CEP 58 42
Probability Histograms 49 51
Dispersion diagrams 57 43
EAESP/FGV/NPP - NÚCLEODEPESQUISAS EPUBLICAÇÕES 48/94
RE L A T Ó R I O D E PE S Q U I S A Nº 2/ 1998
Table 8
Interest in Updating of Knowledge of Quality Management
ITEM ISSUES Degree of interest
1 Directive formation 2.67
2 Payback Systems 3.21
3 Human Resources Management 3.02
4 Quality Assurance 3.26
5 Materials, supply, and distribution management 3.22
6 Maintenance management 3.17
7 Operation/processes management 3.20
8 Sites management 2.80
9 Development of products/services/processes 3.02 10 Methodologies/technologies of analysis/management
control 2.39
References:
EAESP/FGV/NPP - NÚCLEODEPESQUISAS EPUBLICAÇÕES 49/94
RE L A T Ó R I O D E PE S Q U I S A Nº 2/ 1998
Table 9
Responsibility for the Critical Dimensions in Quality Management (Transnational)
CRITICAL DIMENSION HEAD OFFICE (%)
SUBSIDIARIES (%)
High management support 45 55
Information on quality 44 56
Project of products and processes 60 40
Processes management 26 74
Labor Management 14 86
Participation and integration of suppliers 24 76 Participation and integration of clients 20 80
EAESP/FGV/NPP - NÚCLEODEPESQUISAS EPUBLICAÇÕES 50/94
RE L A T Ó R I O D E PE S Q U I S A Nº 2/ 1998
Table 10
Hindering Factors Faced for the Success in Quality
FACTOR RELATIVE IMPORTANCE
Lack of proper formation 2.07
Fail in complying with the practices and procedures established 2.29 Little communication between management levels 2.15
Lack of individual responsibility 2.05
Delayed delivery of material by suppliers 2.65 Practices of the company incompatible with the quality targets 2.06 Lack of clearly defined quality criteria 2.11
Non-availability of the best equipment 2.52
Lack of enough personnel 2.55
Excessive concern with costs 2.51
Outdated technology 2.71
External economic factors 2.79
EAESP/FGV/NPP - NÚCLEODEPESQUISAS EPUBLICAÇÕES 51/94
RE L A T Ó R I O D E PE S Q U I S A Nº 2/ 1998
Table 11
Difficulties for the Success in the Implementation of Quality Management
ITEM ISSUES C
(%) T (%)
O (%)
R (%)
1 High management support 21 48 32 10
2 Payback systems 31 16 37 17
3 Human resources management 27 20 38 15
4 Quality assurance 26 16 39 19
5 Materials, suppliers, and distribution management 17 20 38 26
6 Maintenance management 13 29 31 27
7 Operations/processes management 27 26 33 13
8 Sites management 12 24 36 27
9 Development of products/services/processes 34 14 32 20 10 Methodologies/technologies of analysis/management
control 31 19 34 17
References:
C = Lack of knowledge and/or Comprehension T = Lack of Time
EAESP/FGV/NPP - NÚCLEODEPESQUISAS EPUBLICAÇÕES 52/94
RE L A T Ó R I O D E PE S Q U I S A Nº 2/ 1998
Table 12
Advantages Originated from the Quality System
ADVANTAGENS % OF TOTAL SALES
% OF ANSWERS
Less then 5% 21
5-10% 28
11 - 19% 19
20 - 29% 6
30 - 39% 0
40 - 49% 0
50% or mores 3
EAESP/FGV/NPP - NÚCLEODEPESQUISAS EPUBLICAÇÕES 53/94
RE L A T Ó R I O D E PE S Q U I S A Nº 2/ 1998
EAESP/FGV/NPP - NÚCLEODEPESQUISAS EPUBLICAÇÕES 54/94
RE L A T Ó R I O D E PE S Q U I S A Nº 2/ 1998
Figure 1
Factors of Success, Survival, and Growth (Next Five Years)
References:
1 = Very low importance 2 = Low importance 3 = Medium importance 4 = High importance 5 = Very high importance 6 = Unsure
Product quality 4,68
Productivity 4,72
Government regulation 3,46
Legal responsibility for the product 3,68
Malerials/Labor costs 4,28
Capital availability 4,3
Labor relations 3,95
0 1 2 3 4 5
Product quality Productivity Government regulation Legal responsibility for the
product Malerials/Labor costs
EAESP/FGV/NPP - NÚCLEODEPESQUISAS EPUBLICAÇÕES 55/94
RE L A T Ó R I O D E PE S Q U I S A Nº 2/ 1998
Figure 2
Quality Drivers
References:
1 = Very low importance 2 = Low importance 3 = Medium importance 4 = High importance 5 = Very high importance 6 = Unsure
Higher quality requirements of the prod 4,59 Need to improve flexibility 4,11 Growing international competition 4,27 Need to reduce operating costs 4,29 Need to reduce quality costs 4,02
Beter usage of resources 4,35
Higher education of its personnel 4,1
3,6 3,8 4 4,2 4,4 4,6 4,8 Higher quality requirements of the product
EAESP/FGV/NPP - NÚCLEODEPESQUISAS EPUBLICAÇÕES 56/94
RE L A T Ó R I O D E PE S Q U I S A Nº 2/ 1998
Figure 3
Degree of Difficulty of Implementation in the Quality Programs and Actions (Short and Long Run)
References: AAD SC GRH GQ GMFD GM GOP GL DPSP MTAG
High management support Payback systems
Human resources management Quality assurance
Materials, suppliers, and distribution management Maintenance management
Operations/processes management Sites management
Development of products/services/processes Methodologies/technologies of
analysis/management control
0
0,5
1
1,5
2
2,5
EAESP/FGV/NPP - NÚCLEODEPESQUISAS EPUBLICAÇÕES 57/94
RE L A T Ó R I O D E PE S Q U I S A Nº 2/ 1998
Figure 4
Degree of Utility of Quality Programs and Actions (Short and Long Run)
References:
AAD SC GRH GQ GMFD GM GOP GL DPSP MTAG
High management support Payback systems
Human resources management Quality assurance
Materials, suppliers, and distribution management Maintenance management
Operations/processes management Sites management
Development of products/services/processes Methodologies/technologies of
analysis/management control
0
0,5
1
1,5
2
2,5
3
EAESP/FGV/NPP - NÚCLEODEPESQUISAS EPUBLICAÇÕES 58/94
RE L A T Ó R I O D E PE S Q U I S A Nº 2/ 1998
Figure 5
Quality Management: Situation in the Short Run
Programs Reference Difficulty Utility
High management support 1 1.72 2.73
Payback systems 2 1.95 2.37
Human resources management 3 1.60 2.58
Quality assurance 4 1.56 2.78
Materials, suppliers, and distribution
management 5 1.55 2.96
Maintenance management 6 1.62 2.44
Operations/processes management 7 1.86 2.25
Sites management 8 1.25 2.20
Development of products/services/processes 9 1.91 2.54 Methodologies/technologies of
analysis/management control
10 1.57 2.04
0 0,5 1 1,5 2 2,5 3
0 0,5 1 1,5 2 2,5 3
Degree of difficulty in the implementation
EAESP/FGV/NPP - NÚCLEODEPESQUISAS EPUBLICAÇÕES 59/94
RE L A T Ó R I O D E PE S Q U I S A Nº 2/ 1998
Figure 6
Quality Management: Situation in the Long Run
Programs Reference Difficulty Utility
High management support 1 2.09 2.57
Payback systems 2 2.26 2.18
Human resources management 3 2.00 2.36
Quality assurance 4 1.65 2.63
Materials, suppliers, and distribution management 5 1.77 2.25
Maintenance management 6 1.75 2.27
Operations/processes management 7 1.65 2.10
Sites management 8 1.38 2.11
Development of products/services/processes 9 2.10 2.61 Methodologies/technologies of analysis/management
control 10 2.00 1.88
0
0,5
1
1,5
2
2,5
3
0 0,5 1 1,5 2 2,5 3
Degree of difficulty in the implementation
EAESP/FGV/NPP - NÚCLEODEPESQUISAS EPUBLICAÇÕES 60/94
RE L A T Ó R I O D E PE S Q U I S A Nº 2/ 1998
Figure 7
Hindering Factors and Difficulties Faced for the Quality Success
References: 1 = Very harmful 2 = Harmful 3 = Medium impact 4 = Low impact 5 = Non-harmful 6 = Uncertain
FATOR IMPORTÂNCIA RELATIVA
Lack of proper formation 2,07
Failure in the complyiance with the practices and procedures establishe 2,29
Little communication between management levels 2,15
Lack of individual responsibility 2,05
Delayed deliveries of material by suppliers 2,65
Practices of the company incompatible with the quality targets 2,06
Lack of clearly defined quality criteria 2,11
Non-availability of the best equipment 2,52
Lack of enough personnel 2,55
Excessive concern with costs 2,51
Outdated technology 2,71
External economic factors 2,79
0 0,5 1 1,5 2 2,5 3
Lack of proper formation Failure in the complyiance with the practices and
procedures established Little communication between management levels
Lack of individual responsibility Delayed deliveries of material by suppliers Practices of the company incompatible with the
quality targets