Submitted21 January 2016
Accepted 23 March 2016
Published18 April 2016
Corresponding author
Peter J. Schupp,
Academic editor
Joseph Pawlik
Additional Information and Declarations can be found on page 19
DOI10.7717/peerj.1936
Copyright
2016 Steinert et al.
Distributed under
Creative Commons CC-BY 4.0
OPEN ACCESS
In four shallow and mesophotic tropical
reef sponges from Guam the microbial
community largely depends on host
identity
Georg Steinert1,2, Michael W. Taylor3, Peter Deines3,4, Rachel L. Simister3,5,
Nicole J. de Voogd6, Michael Hoggard3and Peter J. Schupp1
1Institute for Chemistry and Biology of the Marine Environment, Carl von Ossietzky Universität Oldenburg,
Wilhelmshaven, Germany
2Laboratory of Microbiology, Wageningen University, Wageningen, The Netherlands 3School of Biological Sciences, University of Auckland, Auckland, New Zealand 4Zoological Institute, Christian-Albrechts-University Kiel, Kiel, Germany
5Department of Microbiology and Immunology, University of British Columbia, Vancouver, Canada 6Naturalis Biodiversity Center, Leiden, The Netherlands
ABSTRACT
Sponges (phylum Porifera) are important members of almost all aquatic ecosystems, and are renowned for hosting often dense and diverse microbial communities. While the specificity of the sponge microbiota seems to be closely related to host phylogeny, the environmental factors that could shape differences within local sponge-specific communities remain less understood. On tropical coral reefs, sponge habitats can span from shallow areas to deeper, mesophotic sites. These habitats differ in terms of environmental factors such as light, temperature, and food availability, as well as anthropogenic impact. In order to study the host specificity and potential influence of varying habitats on the sponge microbiota within a local area, four tropical reef sponges,
Rhabdastrella globostellata,Callyspongiasp.,Rhaphoxyasp., andAcanthella cavernosa, were collected from exposed shallow reef slopes and a deep reef drop-off. Based on 16S rRNA gene pyrosequencing profiles, beta diversity analyses revealed that each sponge species possessed a specific microbiota that was significantly different to those of the other species and exhibited attributes that are characteristic of high- and/or low-microbial-abundance sponges. These findings emphasize the influence of host identity on the associated microbiota. Dominant sponge- and seawater-associated bacterial phyla were Chloroflexi, Cyanobacteria, and Proteobacteria. Comparison of individual sponge taxa and seawater samples between shallow and deep reef sites revealed no significant variation in alpha diversity estimates, while differences in microbial beta
diversity (variation in community composition) were significant forCallyspongia sp.
sponges and seawater samples. Overall, the sponge-associated microbiota is significantly shaped by host identity across all samples, while the effect of habitat differentiation seems to be less predominant in tropical reef sponges.
SubjectsEcology, Marine Biology, Microbiology
INTRODUCTION
In marine ecosystems, sponges represent common and versatile members of the benthos, with distribution ranges along large environmental gradients and across various habitats including deep sea benthos, seamounts, polar regions, and temperate and tropical coral reefs (Bell, 2008). Many sponges are notable for their diverse and abundant microbial biota, with up to 35% of sponge biomass being made up of microbes (Taylor et al., 2007). Sponge-microbe relationships can include microbial cells as a food source for filter-feeding sponges, carbon- and nitrogen-based nutritional interactions, and the synthesis of secondary metabolites for chemical defence mechanisms (Hentschel et al., 2012;Taylor et al., 2007). Accumulated evidence indicates that much of the sponge microbiota is specific to, or at the very least heavily enriched in, sponge hosts (Lee et al., 2011;Pita et al., 2013;
Schmitt, Hentschel & Taylor, 2012;Webster et al., 2010;Simister et al., 2012a). Even studies which detect so-called ‘‘sponge-specific’’ microbes outside the sponge host only find these at very low abundances, with no evidence for these free-living microbes being metabolically active (Taylor et al., 2013;Moitinho-Silva et al., 2014). In addition to the apparent influence of host identity on microbial composition (Easson & Thacker, 2014;Naim et al., 2014;Pita et al., 2013;Reveillaud et al., 2014), marine sponge-associated microbial communities exhibit relatively high temporal and biogeographic stability (e.g., Simister et al., 2013;
Hardoim & Costa, 2014;Taylor et al., 2005).
While sponges occupy a range of different depths, knowledge about the influence of
depth on the composition of the sponge microbiota still remains rather limited (Olson
& Kellogg, 2010;Olson & Gao, 2013;Morrow, Fiore & Lesser, 2016). Spatial dynamics of the host-associated microbiota within coral reef ecosystems, from shallow (0–30 m) to mesophotic (30–150 m) sites, are of great interest because of the potential role of the mesophotic coral ecosystem (MCE) as refugia for both microbial symbionts and their hosts facing threats of environmental change and anthropogenic disturbances (Olson & Kellogg, 2010;Lesser, Slattery & Leichter, 2009;Kahng, Copus & Wagner, 2014). Sponges in particular seem to be very important benthic members of MCEs, with increased growth rates, biomass and coverage compared to their shallow site counterparts (Lesser, Slattery & Leichter, 2009). The habitat of sponges can span from shallow reef ecosystems into these mesophotic zones, which are less influenced by variable abiotic factors such as surface water temperature and salinity, or by direct human impact such as overfishing and pollution (Kahng, Copus & Wagner, 2014;Olson & Kellogg, 2010). Research on thermal stress responses of sponge-associated microbial communities, for example, has already shown the drastic effects of rising water temperatures on the microbial symbionts (Webster, Cobb & Negri, 2008;Simister et al., 2012b). Knowledge of the spatial dynamics of potential microbial refugia could yield new perspectives on the resilience and management of coral ecosystems, which are facing enormous pressures due to increasing global climatic disturbances and anthropogenic influences along highly populated and narrow land-sea transition zones (Olson & Kellogg, 2010;Ainsworth, Thurber & Gates, 2010).
because of larval migration, water circulation and the filtering activities of sessile benthic invertebrates that inhabit these zones (Olson & Kellogg, 2010;Slattery et al., 2011;Kahng, Copus & Wagner, 2014;Thacker & Freeman, 2012). The first assessment ofin situ sponge-associated communities along an MCE depth gradient suggested host-specific local variations in community structure, which are possibly influenced by prevailing biotic and abiotic factors (Olson & Gao, 2013). A recent study of theXestospongia mutamicrobiota with parallel inorganic nutrient and stable isotope analyses demonstrated that changing environmental factors with depth contribute to the microbial 16S rRNA gene-defined microbial compositions in this sponge (Morrow, Fiore & Lesser, 2016).
In this study, we apply high-throughput 16S rRNA gene amplicon pyrosequencing to profile four demosponge species, Rhabdastrella globostellata,Callyspongiasp.,Acanthella cavernosa, andRhaphoxyasp., collected with surrounding seawater to address the following aims: (1) based on all available samples we investigate the degree of host specificity of microbial communities among several tropical sponge species, and (2) based on a habitat-specific subset of samples we estimate the influence of local habitat variation on sponge- and seawater-associated microbial community patterns. We sampled two closely related but environmentally differentiating habitats; a deep drop-off (Guam Blue Hole) for the collection of the mesophotic reef samples and nearby shallow reef slope sites for comparison.
MATERIALS & METHODS
Sample processing and sequencing
Samples of four different sponge speciesR. globostellata(n=6 specimens),Callyspongia
sp. (n=7),A.cavernosa(n=3),Rhaphoxyasp. (n=5) and seawater (n=5) were collected from closely connected Guam reef sites and depths (shallow exposed reef sites and a deep drop-off) via snorkelling and technical diving (Table 1). The tropical island Guam is known for the presence of a marine karstic limestone sinkhole (i.e., Guam Blue Hole);
Taborosi, Jenson & Mylroie (2003). The vertical Blue Hole sinkhole has a vertical shaft of more than 90 m depth at which it merges with a deep drop-off running along the southern part of the Orote peninsula. This site harbours a rich and diverse associated coral reef fauna (Paulay, 2003) with very different environmental conditions from the shallow coral slopes of the surrounding areas. All shallow water samples for R. globostellataand
Callyspongia sp. were collected from either Western Shoals or Gab Gab, which are both inside Apra Harbor and separated less than 1 nautical mile. The samples were collected in the same habitat, a shallow fore reef slope, which is dominated byPorites ruscorals. Sample collection took place between June 25th 2010 and July 6th 2010, except for the samples C4 & C5 (March 2010) and A2 & A3 (November 2010 and March 2008, respectively) (see
Table 1 for the sample accession codes). Sampling was carried out by technical diving,
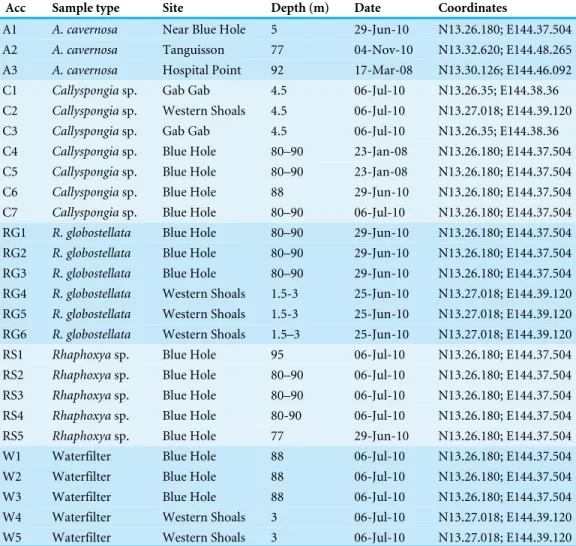
Table 1 Sample data.With internal sample name, classified taxon, date and site of collection, depth and coordinates for each sample.
Acc Sample type Site Depth (m) Date Coordinates
A1 A. cavernosa Near Blue Hole 5 29-Jun-10 N13.26.180; E144.37.504
A2 A. cavernosa Tanguisson 77 04-Nov-10 N13.32.620; E144.48.265
A3 A. cavernosa Hospital Point 92 17-Mar-08 N13.30.126; E144.46.092 C1 Callyspongiasp. Gab Gab 4.5 06-Jul-10 N13.26.35; E144.38.36 C2 Callyspongiasp. Western Shoals 4.5 06-Jul-10 N13.27.018; E144.39.120 C3 Callyspongiasp. Gab Gab 4.5 06-Jul-10 N13.26.35; E144.38.36 C4 Callyspongiasp. Blue Hole 80–90 23-Jan-08 N13.26.180; E144.37.504 C5 Callyspongiasp. Blue Hole 80–90 23-Jan-08 N13.26.180; E144.37.504 C6 Callyspongiasp. Blue Hole 88 29-Jun-10 N13.26.180; E144.37.504 C7 Callyspongiasp. Blue Hole 80–90 06-Jul-10 N13.26.180; E144.37.504 RG1 R. globostellata Blue Hole 80–90 29-Jun-10 N13.26.180; E144.37.504 RG2 R. globostellata Blue Hole 80–90 29-Jun-10 N13.26.180; E144.37.504 RG3 R. globostellata Blue Hole 80–90 29-Jun-10 N13.26.180; E144.37.504 RG4 R. globostellata Western Shoals 1.5-3 25-Jun-10 N13.27.018; E144.39.120 RG5 R. globostellata Western Shoals 1.5-3 25-Jun-10 N13.27.018; E144.39.120 RG6 R. globostellata Western Shoals 1.5–3 25-Jun-10 N13.27.018; E144.39.120 RS1 Rhaphoxyasp. Blue Hole 95 06-Jul-10 N13.26.180; E144.37.504 RS2 Rhaphoxyasp. Blue Hole 80–90 06-Jul-10 N13.26.180; E144.37.504 RS3 Rhaphoxyasp. Blue Hole 80–90 06-Jul-10 N13.26.180; E144.37.504 RS4 Rhaphoxyasp. Blue Hole 80-90 06-Jul-10 N13.26.180; E144.37.504 RS5 Rhaphoxyasp. Blue Hole 77 29-Jun-10 N13.26.180; E144.37.504 W1 Waterfilter Blue Hole 88 06-Jul-10 N13.26.180; E144.37.504 W2 Waterfilter Blue Hole 88 06-Jul-10 N13.26.180; E144.37.504 W3 Waterfilter Blue Hole 88 06-Jul-10 N13.26.180; E144.37.504 W4 Waterfilter Western Shoals 3 06-Jul-10 N13.27.018; E144.39.120 W5 Waterfilter Western Shoals 3 06-Jul-10 N13.27.018; E144.39.120
dive equipment included 5 independent tanks. Given that bottom times were limited to ca. 10–15 min at 90 m including descent time, searching for replicate sponges was very limited, explaining the somewhat limited number of replicates for the deep drop-off sponges. Sea surface temperatures (SST) were obtained from the Coastal Data Information
Program (CDIP,http://cdip.ucsd.edu/themes/). SST averaged 29.8◦C in June and 29.7◦C
in July 2010. Temperatures at depth (90 m) averaged 25 ◦C (taken with Dive rite-Intel
HE and VR3-trimix dive computers). All samples were frozen, freeze-dried, and then stored at −20◦C prior to further processing. Sponges were identified by Dr Nicole J.
de Voogd and vouchers of each species were preserved in 70% ethanol at the Naturalis Biodiversity Center, Leiden, Netherlands. Genomic DNA was extracted from sponge tissue
and water filters (1 L each, 0.22 µm filter) by bead-beating in an ammonium acetate
was performed as previously described by Simister et al. (2012b). Pyrosequencing was performed by Macrogen Inc. (Seoul, South Korea) using the Roche GS FLX Titanium system. The obtained raw sequence data can be accessed via the NCBI Sequence Read
Archive under accession numberSRX838037.
Raw sequence processing
Sequences were processed using mothur v.1.33.0 (Schloss, Gevers & Westcott, 2011;Schloss et al., 2009). Pyrosequencing flowgrams were filtered and denoised using the mothur
implementation of AmpliconNoise (Quince et al., 2011). Adaptor, MID, and primer
sequences were removed from raw sequences. Sequences were removed from the analysis
if they were ≤200 bp or contained ambiguous characters, homopolymers longer than
8 bp, more than one MID mismatch, or more than two mismatches to the reverse primer sequence. Unique sequences were aligned against a SILVA alignment (available
athttp://www.mothur.org/wiki/Silva_reference_alignment). After chimera-checking with
UCHIME (Edgar et al., 2011), unique sequences were identified using the Greengenes
‘‘gg_13_8_99’’ reference taxonomy (available at
http://www.mothur.org/wiki/Greengenes-formatted_databases). Non-target sequences (e.g. chloroplasts, mitochondria, eukaryotic
18S rRNA) were removed.
Sequence data analyses
After raw data processing, mothur was used to group the obtained high quality sequences into 97% average neighbour sequence-similarity threshold operational taxonomic units (i.e., 97%-OTUs), for calculation of Shannon & inverse Simpson diversity, and rarefaction curves. Reads were evenly subsampled to 2,387 sequences per sample for all alpha diversity calculations (mothur commandsummary.single &subsample=T; 1,000 iterations). For visualization and interpretation of the microbial community data, we used standardized
97%-OTU abundance information (vegan command decostand &method=hellinger
or pa; Bray-Curtis dissimilarities for relative abundance & Jaccard dissimilarities for presence/absence analyses). To estimate the variance of beta diversity, two hypothetical treatments were applied to the dataset: (a) ‘habitat’ (shallow reef slope, deep drop-off) and (b) ‘group’ (Rhabdastrella, Rhaphoxya,Callyspongia,Acanthella, seawater) (Table
S1). These treatments were used for analysis of multivariate homogeneity of group
dispersions (variances) (Anderson, 2006) with thebetadisper (followed by pairwise Tukey’s
Honestly Significant Difference tests) andpermutest function from the vegan package in
R (v. 3.0.2) (Oksanen et al., 2012;R Development Core Team, 2013). We used theadonis
function (1000 permutations) from the vegan package to estimate the variances in beta diversity for both treatment groups (Anderson, 2001). Visualization of variations in sponge composition among habitats (i.e., shallow reef slope, deep drop-off) and sponge hosts (R. globostellata,Callyspongia sp., Rhaphoxyasp. andA. cavernosa) were assessed with
multivariate non-metric multidimensional scaling (nMDS) using themetaMDSfunction
data. The contribution of OTUs to average overall pairwise sample dissimilarity in
R. globostellata, Callyspongia sp. and seawater specific datasets (‘habitat’ treatment)
was assessed using the vegan function simper for similarity percentages (SIMPER).
Relative abundance of the 30 most abundant OTUs (each≥0.5% relative abundance)
and relative phylum abundance were visualized with JColorGrid (Joachimiak, Weisman
& May, 2006). Representative sequences of the 30 most abundant OTUs were assembled
via theget.oturepcommand in mothur and BLAST searched against the NCBI Nucleotide
collection (discontiguous megablast & Models excluded). The best hits and representative sequences for the most abundant OTUs can be accessed via the Figshare online repository
(https://dx.doi.org/10.6084/m9.figshare.2366827). Hierarchical clustering based on all
OTUs was performed using the vegan package in R via the function vegdist
(Bray-Curtis dissimilarity) andhclust (method =average) and subsequently added onto the
phylum fingerprint. As described above, all samples were included in the group-based (i.e., sponge and seawater samples) multivariate community (adonis and betadisper) and ordination (nMDS) analysis. In the subsequent habitat-based (shallow reef slope
vs. deep drop-off) comparison, A. cavernosaandRhaphoxya sp. samples were omitted
from all analyses, and seawater samples from multivariate community analysis and ordination analyses, due to insufficient numbers of replicates in the dataset for the particular habitats. The 97% OTU abundance table combined with the Greengenes classification for each individual OTU can be accessed via the Figshare online repository
(https://dx.doi.org/10.6084/m9.figshare.2063280).
RESULTS
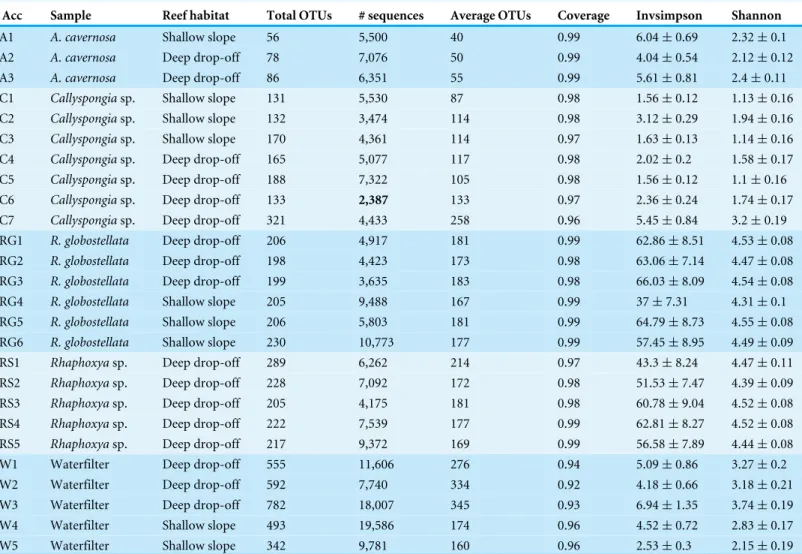
In total, 191,710 sequences were retained after denoising and quality control. Between all sampling groups (four sponge taxa and one seawater group), number of sequences, observed and average 97%-OTUs were higher overall within the seawater group in comparison to the sponge groups (Table 2). Coverage was slightly higher forA. cavernosaandR. globostellata
compared to seawater and Callyspongia sp. samples (Table 2). These group-specific
observations were also reflected in the rarefaction curves (Fig. S1). Across 26 samples (21 sponges and 5 seawater samples), 2247 OTUs (97% cut-off) were determined. After Greengenes classification, these OTUs were assigned to 33 bacterial and two archaeal phyla
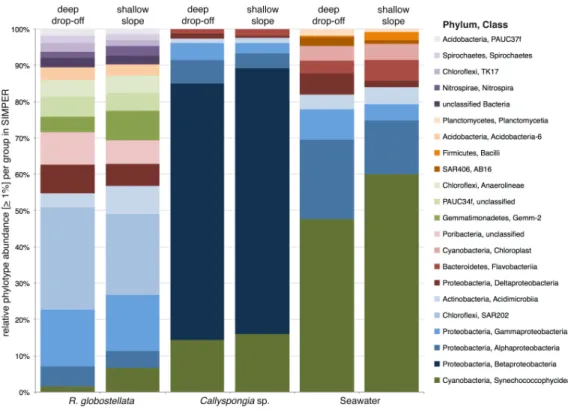
(Fig. 1). Pooled seawater samples showed the highest phylum richness, with 30 bacterial
and two archaeal phyla identified. The observed phylum-level diversity ofR. globostellata
and Rhaphoxyasp. was very similar with 18 and 19 bacterial phyla, respectively, and Crenarchaeota as the archaeal phylum present in both sponge species. The main differences in bacterial composition betweenRhaphoxyasp. andR. globostellatawere in the relative
abundances of Cyanobacteria and Betaproteobacteria (Fig. 1). However, compared to the
other three groups, these two sponges were more similar to each other at microbial phylum
level. In contrast, Callyspongiasp. exhibited an association with Euryarchaeota and 24
Table 2 Sample sequence statistics.Sequence and OTU of 97%-OTUs (subsampling size based on the sample with the fewest sequences emphasized in bold = 2,387 reads). Subsequent coverage, richness, and alpha diversity estimates are based on the subsampled dataset.
Acc Sample Reef habitat Total OTUs # sequences Average OTUs Coverage Invsimpson Shannon
A1 A. cavernosa Shallow slope 56 5,500 40 0.99 6.04±0.69 2.32±0.1
A2 A. cavernosa Deep drop-off 78 7,076 50 0.99 4.04±0.54 2.12±0.12
A3 A. cavernosa Deep drop-off 86 6,351 55 0.99 5.61±0.81 2.4±0.11
C1 Callyspongiasp. Shallow slope 131 5,530 87 0.98 1.56±0.12 1.13±0.16
C2 Callyspongiasp. Shallow slope 132 3,474 114 0.98 3.12±0.29 1.94±0.16
C3 Callyspongiasp. Shallow slope 170 4,361 114 0.97 1.63±0.13 1.14±0.16
C4 Callyspongiasp. Deep drop-off 165 5,077 117 0.98 2.02±0.2 1.58±0.17
C5 Callyspongiasp. Deep drop-off 188 7,322 105 0.98 1.56±0.12 1.1±0.16
C6 Callyspongiasp. Deep drop-off 133 2,387 133 0.97 2.36±0.24 1.74±0.17
C7 Callyspongiasp. Deep drop-off 321 4,433 258 0.96 5.45±0.84 3.2±0.19
RG1 R. globostellata Deep drop-off 206 4,917 181 0.99 62.86±8.51 4.53±0.08
RG2 R. globostellata Deep drop-off 198 4,423 173 0.98 63.06±7.14 4.47±0.08
RG3 R. globostellata Deep drop-off 199 3,635 183 0.98 66.03±8.09 4.54±0.08
RG4 R. globostellata Shallow slope 205 9,488 167 0.99 37±7.31 4.31±0.1
RG5 R. globostellata Shallow slope 206 5,803 181 0.99 64.79±8.73 4.55±0.08
RG6 R. globostellata Shallow slope 230 10,773 177 0.99 57.45±8.95 4.49±0.09
RS1 Rhaphoxyasp. Deep drop-off 289 6,262 214 0.97 43.3±8.24 4.47±0.11
RS2 Rhaphoxyasp. Deep drop-off 228 7,092 172 0.98 51.53±7.47 4.39±0.09
RS3 Rhaphoxyasp. Deep drop-off 205 4,175 181 0.98 60.78±9.04 4.52±0.08
RS4 Rhaphoxyasp. Deep drop-off 222 7,539 177 0.99 62.81±8.27 4.52±0.08
RS5 Rhaphoxyasp. Deep drop-off 217 9,372 169 0.99 56.58±7.89 4.44±0.08
W1 Waterfilter Deep drop-off 555 11,606 276 0.94 5.09±0.86 3.27±0.2 W2 Waterfilter Deep drop-off 592 7,740 334 0.92 4.18±0.66 3.18±0.21 W3 Waterfilter Deep drop-off 782 18,007 345 0.93 6.94±1.35 3.74±0.19 W4 Waterfilter Shallow slope 493 19,586 174 0.96 4.52±0.72 2.83±0.17 W5 Waterfilter Shallow slope 342 9,781 160 0.96 2.53±0.3 2.15±0.19
Chloroflexi, Cyanobacteria, Nitrospirae, Planctomycetes, Proteobacteria, Spirochaetes, Synergistetes, and Verrucomicrobia), but exhibited group-specific variation (Fig. 1). Hierarchical clustering based on Bray-Curtis dissimilarity distances revealed group-specific clades with high between-group and low within-group dissimilarities (Fig. 1&
Fig. S2A). In addition, individual Bray-Curtis dissimilarity clustering of all five groups
separated almost every sample in accordance to the sampled habitat (Figs. S2B–S2E), while subsequent multivariate analyses only confirmed significant differences between habitats forCallyspongiasp. and seawater samples (Table 3).
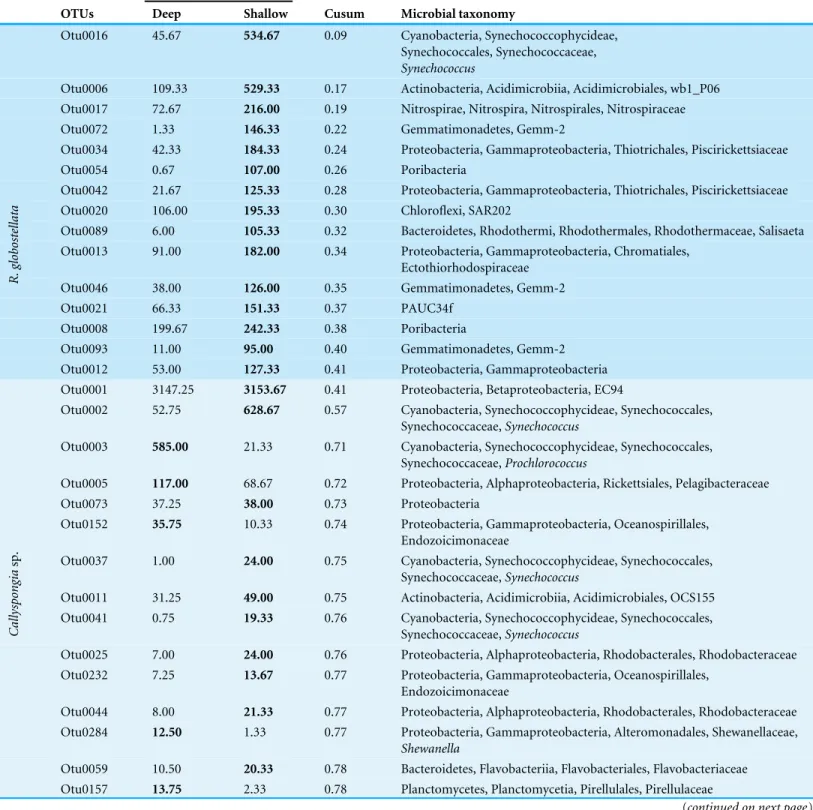
The most abundant OTUs (n=30) included members of the Proteobacteria (Alpha-,
Beta-, Delta-, and Gamma-), Cyanobacteria, Acidobacteria, Chloroflexi, ‘‘Poribacteria’’,
Actinobacteria, Nitrospirae and PAUC34f (Fig. 2). The distribution of the three most
abundant OTUs (OTU0001: Betaproteobacteria, uncultured order EC94; OTU0002:
Cyanobacteria, Synechococcus; OTU0003: Cyanobacteria, Prochlorococcus) was mostly
Figure 2 Most abundant 97%-OTUs.Fingerprint of the 30 most abundant 97%-OTUs (>0.5%) based on relative abundance for each individual OTU. Greengenes classifications from phylum to species level are provided on the left. On the right are relative abundances of the individual 97%-OTUs in relation to all detected 97%-OTUs.
OTUs were representatives of Chloroflexi class SAR202, the candidate phylum ‘‘Poribacteria,’’ various Acidobacteria and Proteobacteria, and the uncultured sponge
symbiont PAUC34f. Interestingly, while most abundant OTUs inR. globostellataand
Rhaphoxyasp. were largely shared, and evenly distributed overall, the abundant OTU0016 (Synechococcus) inR. globostellatawas not detected inRhaphoxyasp. On the contrary, the latter sponge species featured an Acidobacteria OTU (OTU0033) that was predominantly shared withA. cavernosa instead ofR. globostellata(Fig. 2). Additionally, three OTUs
were highly abundant only in A. cavernosa: OTU0004 (Acidobacteria, PAUC26f),
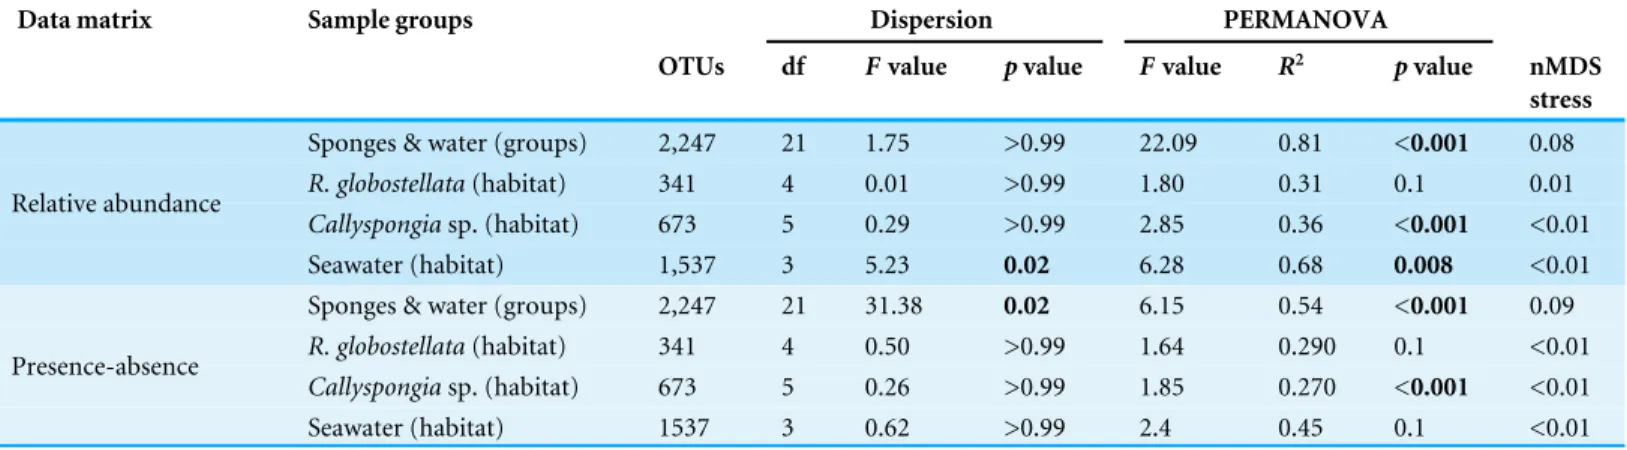
Table 3 Multivariate analyses.Analysis of Bray-Curtis (relative abundance) and Jaccard (presence-absence) dissimilarities among all samples (group based) and theR. globostellata,Callyspongiasp., and seawater specific subsets (habitat based). Results represent the three groups and ordina-tion ellipses fromFigs. 3A–3Cand seawater with the number of 97%-OTUs available in each individual dataset for the betadisper/permutest (Dis-persion) and adonis (PERMANOVA) analyses (1,000 permutations each). Attached are the nMDS stress values of the multivariate ordination from
Figs. 3A–3Cand seawater (seawater ordination not shown). Significant differences in bold.
Data matrix Sample groups Dispersion PERMANOVA
OTUs df Fvalue pvalue Fvalue R2 pvalue nMDS
stress
Sponges & water (groups) 2,247 21 1.75 >0.99 22.09 0.81 <0.001 0.08
R. globostellata(habitat) 341 4 0.01 >0.99 1.80 0.31 0.1 0.01
Callyspongiasp. (habitat) 673 5 0.29 >0.99 2.85 0.36 <0.001 <0.01 Relative abundance
Seawater (habitat) 1,537 3 5.23 0.02 6.28 0.68 0.008 <0.01 Sponges & water (groups) 2,247 21 31.38 0.02 6.15 0.54 <0.001 0.09
R. globostellata(habitat) 341 4 0.50 >0.99 1.64 0.290 0.1 <0.01
Callyspongiasp. (habitat) 673 5 0.26 >0.99 1.85 0.270 <0.001 <0.01 Presence-absence
Seawater (habitat) 1537 3 0.62 >0.99 2.4 0.45 0.1 <0.01
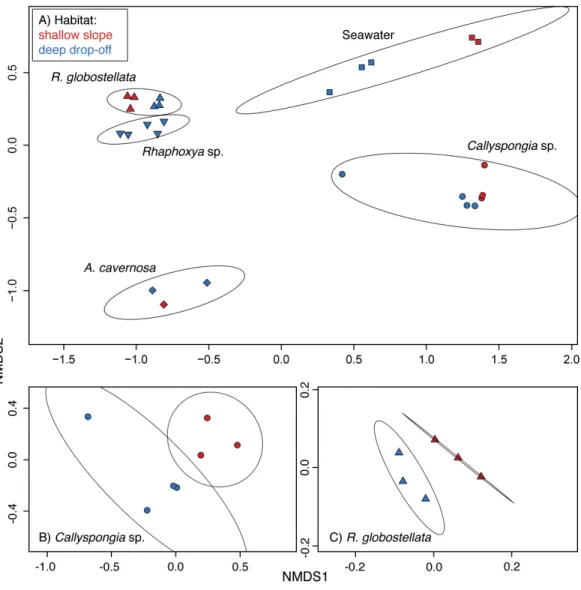
Non-metric multidimensional scaling plots created with all samples showed a high
degree of sample-specific pooling (Fig. 3A). The variation among sample-specific groups
was significant for the relative abundance and presence-absence datasets (Table 3). Pairwise comparisons of mean group dispersions revealed the significant contributions of seawater andCallyspongiasp. samples to the differences between the groups (Tables S2andS3).The habitat-based multivariate analysis of variance was significant forCallyspongia sp. and
seawater samples (Table 3). The nMDS ordination showed apparent habitat-related
community clusters for both (Callyspongiasp. andR. globostellata) sponge taxa (Figs. 3B
and3C). The observation of habitat-specific clusters in the ordination is also present in the individual hierarchical clustering approaches (Figs. S2B–S2D). In addition, for seawater (habitat-based PERMANOVA) the relative abundance, and the sponge & seawater (group-based permanova) presence-absence groups the significant multivariate spread (Dispersion) might contribute to the observed significant variance effects (Table 3).
The graphical summary of the OTUs (collapsed to high taxonomic ranks) with the highest average abundance in SIMPER in each of the sample groups presents three distinct microbial communities, with only slight variations between the two habitats
(Fig. 4). For example,R. globostellataharbours an abundant Chloroflexi community and
is the only sample group containing the candidate phylum ‘‘Poribacteria.’’ In contrast,
Callyspongiasp. was dominated by members of Betaproteobacteria and seawater samples by Cyanobacteria and Gammaproteobacteria. In all three sample types, Cyanobacteria were slightly more abundant in samples from the shallow reef slope habitat. In contrast to the overall balanced taxonomic contribution patterns between habitats at higher taxonomic ranks, the analysis of 97%-OTUs showed individual habitat contributions and that several OTUs with a high abundance among all samples were also main contributors to the
overall dissimilarity among the shallow and very deep sample groups (Table 4). The
Figure 3 97%-OTU community structure.nMDS ordinations based on Bray-Curtis (relative abun-dance) dissimilarities (97%-OTUs). (A) all samples and ordination ellipse for each sample group, (B) only
Callyspongiasp. with ordination ellipse for each habitat, and (C)R. globostellatawith ordination ellipse for each habitat.
Synechococcus(phylum Cyanobacteria) in the shallow reef slope habitats. In the deep drop-offCallyspongiasp. and seawater samples a second cyanobacterium, genusProchlorococcus
(OTU0003), was most dominant. The dominantSynechococcusOTUs were also separated
inR. globostellata(OTU0016) andCallyspongiasp. and seawater (OTU0002, OTU0037,
OTU0041). Additionally, compared to Callyspongia sp. and seawater, which exhibit
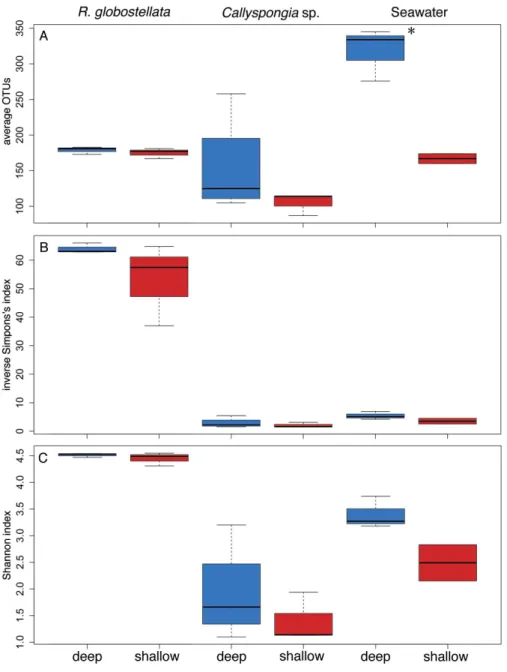
dominant OTUs either in shallow reef slopes or deep habitats, the main contributing OTUs in R. globostellatadominate completely the specimens from shallow habitat (Table 4). The contrasting and habitat-dependent patterns were also prominent in the average species richness and the two alpha diversity indices among the three groups (Figs. 5A–
5C);R. globostellatarepresents the sponge with the highest evenness, richness and OTU
Figure 4 SIMPER contributions to Bray-Curtis dissimilarities between habitats.Mean sequence abun-dances of the 97%-OTUs which contribute the most to overall Bray-Curtis dissimilarities, as calculated by SIMPER among open and deepR. globostellata,Callyspongiasp., and seawater samples. Individual 97%-OTUs were collapsed at class level and only considered with an overall abundance of >1%.
sample groups exhibit higher richness and diversity values in the deep drop-off habitats and individual variations among the shallow reef slopes and deep drop-off habitats.
DISCUSSION
Host specificity of the microbiota of four MCE sponges
In the present study divergent patterns between two different habitats were visible in the
tropical sponge and seawater microbiota.Callyspongiasp. and seawater samples appear
to have an intrinsic microbial community composition, which is variable enough to significantly separate the intra-species communities by their shallow reef slope or deep drop-off habitats. On the other handR. globostellataexhibits an observable difference in community variation that is not significant. In addition, we could also observe significant microbial specificity across all analyzed sponge taxa independent of habitat. Since the shallow collection sites forCallyspongiasp. andR. globostellatainside Apra Harbor represent the same shallow water fore reef slope habitat dominated byPorites ruscorals, it is unlikely that the observed differences in beta diversity between shallow reef slope or deep drop-off habitats are due to collection ofCallyspongiasp. from the two shallow Apra Harbor sites.
Little is known about the R. globostellataandRhaphoxyasp. microbial communities.
Table 4 Most abundant SIMPER OTUs.Average abundance and cumulative contribution of the top 15 dominant 97%-OTUs contributing at least to 70% of the Bray-Curtis dissimilarities (SIMPER). Calculated among shallow reef slopes and deep reef drop-offR. globostellata, Callyspon-giasp. and seawater samples. Microbial taxonomy is based on the Greengenes 97%-OTU classification from phylum to species level (if applicable). Habitat-specific OTU prevalence emphasized in bold; cusum: ordered cumulative contribution.
Average abundance
OTUs Deep Shallow Cusum Microbial taxonomy
Otu0016 45.67 534.67 0.09 Cyanobacteria, Synechococcophycideae, Synechococcales, Synechococcaceae,
Synechococcus
Otu0006 109.33 529.33 0.17 Actinobacteria, Acidimicrobiia, Acidimicrobiales, wb1_P06 Otu0017 72.67 216.00 0.19 Nitrospirae, Nitrospira, Nitrospirales, Nitrospiraceae Otu0072 1.33 146.33 0.22 Gemmatimonadetes, Gemm-2
Otu0034 42.33 184.33 0.24 Proteobacteria, Gammaproteobacteria, Thiotrichales, Piscirickettsiaceae Otu0054 0.67 107.00 0.26 Poribacteria
Otu0042 21.67 125.33 0.28 Proteobacteria, Gammaproteobacteria, Thiotrichales, Piscirickettsiaceae Otu0020 106.00 195.33 0.30 Chloroflexi, SAR202
Otu0089 6.00 105.33 0.32 Bacteroidetes, Rhodothermi, Rhodothermales, Rhodothermaceae, Salisaeta Otu0013 91.00 182.00 0.34 Proteobacteria, Gammaproteobacteria, Chromatiales,
Ectothiorhodospiraceae Otu0046 38.00 126.00 0.35 Gemmatimonadetes, Gemm-2 Otu0021 66.33 151.33 0.37 PAUC34f
Otu0008 199.67 242.33 0.38 Poribacteria
Otu0093 11.00 95.00 0.40 Gemmatimonadetes, Gemm-2
R.
globostellata
Otu0012 53.00 127.33 0.41 Proteobacteria, Gammaproteobacteria Otu0001 3147.25 3153.67 0.41 Proteobacteria, Betaproteobacteria, EC94
Otu0002 52.75 628.67 0.57 Cyanobacteria, Synechococcophycideae, Synechococcales, Synechococcaceae,Synechococcus
Otu0003 585.00 21.33 0.71 Cyanobacteria, Synechococcophycideae, Synechococcales, Synechococcaceae,Prochlorococcus
Otu0005 117.00 68.67 0.72 Proteobacteria, Alphaproteobacteria, Rickettsiales, Pelagibacteraceae Otu0073 37.25 38.00 0.73 Proteobacteria
Otu0152 35.75 10.33 0.74 Proteobacteria, Gammaproteobacteria, Oceanospirillales, Endozoicimonaceae
Otu0037 1.00 24.00 0.75 Cyanobacteria, Synechococcophycideae, Synechococcales, Synechococcaceae,Synechococcus
Otu0011 31.25 49.00 0.75 Actinobacteria, Acidimicrobiia, Acidimicrobiales, OCS155 Otu0041 0.75 19.33 0.76 Cyanobacteria, Synechococcophycideae, Synechococcales,
Synechococcaceae,Synechococcus
Otu0025 7.00 24.00 0.76 Proteobacteria, Alphaproteobacteria, Rhodobacterales, Rhodobacteraceae Otu0232 7.25 13.67 0.77 Proteobacteria, Gammaproteobacteria, Oceanospirillales,
Endozoicimonaceae
Otu0044 8.00 21.33 0.77 Proteobacteria, Alphaproteobacteria, Rhodobacterales, Rhodobacteraceae Otu0284 12.50 1.33 0.77 Proteobacteria, Gammaproteobacteria, Alteromonadales, Shewanellaceae,
Shewanella
Otu0059 10.50 20.33 0.78 Bacteroidetes, Flavobacteriia, Flavobacteriales, Flavobacteriaceae
Callyspongia
sp.
Otu0157 13.75 2.33 0.78 Planctomycetes, Planctomycetia, Pirellulales, Pirellulaceae
Table 4(continued)
Average abundance
OTUs Deep Shallow Cusum Microbial taxonomy
Otu0002 314.00 7548.00 0.34 Cyanobacteria, Synechococcophycideae, Synechococcales, Synechococcaceae,Synechococcus
Otu0003 5147.67 60.00 0.58 Cyanobacteria, Synechococcophycideae, Synechococcales, Synechococcaceae,Prochlorococcus
Otu0005 711.33 630.50 0.60 Proteobacteria, Alphaproteobacteria, Rickettsiales, Pelagibacteraceae Otu0037 3.00 432.50 0.62 Cyanobacteria, Synechococcophycideae, Synechococcales,
Synechococcaceae,Synechococcus
Otu0011 398.33 628.50 0.64 Actinobacteria, Acidimicrobiia, Acidimicrobiales, OCS155 Otu0041 5.00 393.00 0.66 Cyanobacteria, Synechococcophycideae, Synechococcales,
Synechococcaceae,Synechococcus
Otu0025 96.67 462.00 0.67 Proteobacteria, Alphaproteobacteria, Rhodobacterales, Rhodobacteraceae Otu0058 4.33 328.00 0.69 Firmicutes, Bacilli, Bacillales, Bacillaceae, Bacillus
Otu0071 32.67 234.50 0.70 Cyanobacteria, Chloroplast, Chlorophyta, Mamiellaceae Otu0061 198.33 18.50 0.70 Proteobacteria, Deltaproteobacteria, Sva0853, SAR324
Otu0032 257.33 111.00 0.71 Proteobacteria, Alphaproteobacteria, Rickettsiales, Pelagibacteraceae Otu0044 71.67 244.00 0.72 Proteobacteria, Alphaproteobacteria, Rhodobacterales, Rhodobacteraceae Otu0076 177.67 11.50 0.73 Proteobacteria, Alphaproteobacteria, Sphingomonadales,
Erythrobacteraceae,Erythrobacter
Otu0080 131.67 35.00 0.73 Proteobacteria, Alphaproteobacteria, Rhodobacterales, Rhodobacteraceae
Seawater
Otu0148 4.67 102.00 0.74 Planctomycetes, OM190, CL500-15
Steinert et al., 2014). In addition, Lafi et al. (2009) found the candidate phylum
‘‘Poribacteria’’ in this demosponge. While the first high-throughput-sequencing amplicon screening detected 16 bacterial phyla associate withR. globostellata(Schmitt et al., 2012), we can now increase the number to a total of 23 microbial phyla. ForRhaphoxyasp., virtually nothing has been known about the associated microbiota. However, this sponge taxon is already the focus of natural products research, which hints at a chemically active symbiotic
microbiota (Wright et al., 2012). Here we present phylum and OTU composition patterns
in R. globostellataandRhaphoxya sp. that are surprisingly similar. While designation of the two sponge taxa as either high microbial abundance (HMA) or low microbial abundance (LMA) sponges is lacking in the literature, the associated microbial phylotypes are congruent with the microbial phyla commonly found in association with HMA sponges (i.e., Proteobacteria, Chloroflexi, Acidobacteria, Actinobacteria, and the candidate phylum ‘‘Poribacteria’’) (Schmitt et al., 2011;Gloeckner et al., 2014).
Recent transmission electron microscopy, DAPI cell-counting and 16S rRNA gene amplicon sequencing results assigned different members of the demosponges
A.cavernosaandCallyspongiasp. to the LMA group, with abundant Proteobacteria (Alpha,
Beta, & Gamma) and Cyanobacteria (Synechococcus) microbial community members
(Gloeckner et al., 2014;Giles et al., 2013; Jeong, Kim & Park, 2013). We also found that our Callyspongia sp. specimens exhibited an abundant occurrence ofSynechococcus
Figure 5 Alpha diversity comparisons between habitats.Number of (A) average 97%-OTUs and al-pha diversity estimates, (B) inverse Simpson’s and (C) Shannon index for shallow reef slopes and deep reef drop-offR. globostellata,Callyspongiasp. and seawater samples. Top, middle, and bottom lines of the boxes represent the 25th, 50th (median), and 75th percentiles, respectively. The end of the whiskers repre-sent the 5th and 95th percentiles, respectively. Blue and red habitat colors correspond with the color code inFig. 3. Measurements of observed average OTUs, inverse Simpson’s index and Shannon index were an-alyzed using a one-way analysis of variance (ANOVA,p<0.05) using habitat as a fixed factor. Significant
results are marked by an asterisk.
in ourCallyspongiasp. samples and among all OTUs. Reports on this order are rare, but
Overall, sponge and seawater community structures correlated significantly with host identity. This underlines the common view that host identity is an important factor for
the composition of sponge-associated microbial communities (e.g.,Cárdenas et al., 2014;
Cleary et al., 2013;Easson & Thacker, 2014;Pita et al., 2013). Recent studies on several sponge species showed that the microbiota of LMA sponges, in particular, exhibits a low degree of similarity among the investigated sponge species (Giles et al., 2013;Blanquer, Uriz & Galand, 2013). The sponge generaAcanthellaandCallyspongiawere previously found to include LMA sponges (Gloeckner et al., 2014), and the bacterial community ordination, phylum composition and OTU structures of the present study separates these two sponge taxa very distinctly from the other two investigated sponges (Rhabdastrella, Rhaphoxya).
In addition, the observed microbial community patterns in Callyspongiasp. appear to
be more closely related to the seawater samples (see OTU and phylum composition). This high similarity with seawater communities is a well-known feature of LMA sponges (e.g.,Taylor et al., 2007;Schmitt et al., 2011;Blanquer, Uriz & Galand, 2013). In contrast, HMA members are commonly more closely related to each other, especially after the removal of potential environmental sources of variation (Blanquer, Uriz & Galand, 2013). Finally, four sponge samples (twoA. cavernosaand twoCallyspongiasp.) have been sampled at different points in time. However, a temporal effect on the community structure is not evident, which is in accordance with recent research showing the low seasonal variability of the sponge-microbiota (Erwin et al., 2012;Erwin et al., 2015), although other similar studies have indicated the temporal variability of sponge-associated bacteria (White et al., 2012;Anderson, Northcote & Page, 2010).
Depth-dependent microbial community patterns in MCE sponges
Knowledge about variability of the sponge microbiota along environmental gradients on local spatial scales is still scarce (Olson & Kellogg, 2010). A T-RFLP and clone library study on three MCE sponges identified a trend in community composition along a depth gradient, but could not identify the bacteria which caused these variations (Olson & Gao,
2013). Correspondingly, a recent 16S rRNA gene amplicon analysis found significant
shifts in theX. muta-associated microbial community along a depth gradient from 10 to
90 m and demonstrated that environmental factors may influence the sponge microbiota (Morrow, Fiore & Lesser, 2016). A sponge transplantation experiment showed little overall effect between different habitats (Cárdenas et al., 2014), and comparisons between sponges obtained from different habitats (marine lake vs. coastal system & intertidal vs. subtidal) showed the importance of host relatedness and habitat as determinants of microbial community structure (Weigel & Erwin, 2015;Cleary et al., 2013).
In the present study, Callyspongia sp. and seawater microbial communities were
habitats, we focused sampling on ‘‘shallow’’ and ‘‘very deep’’ depths as categorized by
Brazeau, Lesser & Slattery (2013). Irradiance, but also nutrient availability and water temperature, are dependent on both depth and changing environmental factors along spatial gradients from shallow to mesophotic coral reefs (seeLesser, Slattery & Leichter, 2009;Olson & Gao, 2013). The observed temperature difference between shallow reef slope and deep drop-off sites averaged 4 ◦C, similar to that reported byLesser et al. (2010);
difference of 4◦C between 3 m and 91 m depth). While temperature is one indication for
environmental differences between the two habitats, it seems unlikely that the observed difference of 4◦C will affect sponge-microbe communities between the two habitats to the
extent reported in this study. Studies examining the effect of elevated temperatures found no change (at sub-lethal temperatures) in sponge bacterial communities during short-term experiments (Webster, Cobb & Negri, 2008;Simister et al., 2012b). It is likely that other local environmental factors such as light have a considerable effect on the small-scale patterns observed here, especially as similar studies on mesophotic reefs byLesser, Slattery & Leichter (2009)andLesser et al. (2010)did observe pronounced differences in light along similar depth gradients.
WithinCallyspongiasp. and seawater samples, either Cyanobacteria or Proteobacteria
OTUs were mainly responsible for the differences observed by SIMPER. In particular,
cyanobacterialSynechococcusOTUs were among the main contributors to the shallow
microbiota, whereas only one ProchlorococcusOTU was a dominant cyanobacterium
contributing to the deep group from mesophotic depths. The predominance of photoautotrophs in tropical filter-feeding sponges is intuitive given the widespread prevalence of cyanobacteria in the ocean. LMA sponges in particular are known to harbour cyanobacteria in high abundance (Bayer, Kamke & Hentschel, 2014), and cyanobacteria comprise one of the most abundant associated phyla, with well-established sponge-specific symbionts (e.g., Synechococcus spongarium) (Hentschel, Usher & Taylor, 2006;
Taylor et al., 2007;Simister et al., 2012a). Moreover, LMA sponges exhibit higher water filtering capabilities, presumably due to a less dense mesohyl and less complex aquiferous system compared to HMA sponges (Weisz, Lindquist & Martens, 2008). Therefore, the
congruent microbial community patterns betweenCallyspongiasp. and seawater samples
observed here, in contrast to those ofR. globostellata, could be correlated with physiological differences between HMA and LMA sponges (seeWeisz, Lindquist & Martens, 2008;Thacker & Freeman, 2012). Besides the potential phototrophic activities in the sponge pinacoderm (outer tissue) and mesohyl (inner sponge matrix), nitrogen-fixing cyanobacteria may inhabit a niche within the complex nitrogen cycle in sponges, with a mutual benefit due to nutrient supply by the sponge and secondary metabolite production by the cyanobacteria (Taylor et al., 2007;Wilkinson & Fay, 1979;Arillo et al., 1993). Given the dominance of
Cyanobacteria in ourCallyspongiasp. specimens and seawater samples, withSynechococcus
sponges have been observed to varying degrees previously, the combined effect of time and
depth on these and other chlorophototrophs in sponges remains uncertain (White et al.,
2012;Erwin et al., 2012;Hardoim & Costa, 2014;Taylor et al., 2004). A recent analysis on stable isotopes indicated that, with increasing depth, the inorganic nutrients dependency in sponges shifts from photoautotrophy to heterotrophy, in accordance with a significant shift in the associated microbiota (Morrow, Fiore & Lesser, 2016). Conversely, in the same sponge species at a different location an observed stable isotopic enrichment correlated with a larger microbial community similarity across different sampling depths. In addition, other factors should be considered to explain the observed differences. Since the same sponge species show differences in growth rates and species richness at different depths (Lesser, Slattery & Leichter, 2009), different biotic and abiotic niches may be available for symbionts depending on their habitat. Such ecologically-based niche differentiation for symbionts and hosts is known for the tropical corals Seriatopora hystrix (Bongaerts et al., 2010) andMontastraea cavernosa(Lesser et al., 2010;Brazeau, Lesser & Slattery, 2013). Recent oligotyping of Nitrospira symbionts associated with sponges collected along large horizontal and vertical gradients provided further evidence for such patterns of differential enrichment of closely related microbial variants (Reveillaud et al., 2014).
InR. globostellata, one cyanobacterial OTU (OTU0016) is predominant within the deep sheltered communities, but also present at high abundance in the shallow specimens of this species (Table 4). Moreover, it was also largely absent from all other sponge and seawater samples. The BLAST search against the NCBI nucleotide collection revealed
that this particular OTU is highly similar to Candidatus Synechococcus spongiarum,
a symbiotic cyanobacterium found in many sponges (Hentschel, Usher & Taylor, 2006).
Compared to this, the main cyanobacterial OTUs found inCallyspongiasp. and seawater
(OTU0002 & OTU0003) yielded different BLAST results (uncultured Synechococcussp.
CONCLUSION
The present study suggests that sponge-specific communities in tropical coral ecosystems are predominantly influenced by host identity. Moreover, the variance between
Callyspongia-associated microbial communities from two different habitats (i.e., shallow reef slopes and deep drop-off reefs) is large enough to observe significant differences. However, the actual environmental factors contributing to the observed habitat-dependent variances remain uncertain, although we speculate that temperature may be less likely to have caused the variations in the sponge microbiota between shallow and deep specimens. While sponge-microbe communities show an overall stability along large geographic and temporal gradients, local environmental factors may have an effect on the small-scale patterns observed here. To further test the hypothesis of differential sponge-associated microbial communities along local depth gradients, functional and temporal aspects
should be considered in future in situstudies. Moreover, since temporal turnover of
phytoplankton is faster in the tropics (Soininen, 2010), tropical sponges with dominant phototrophic microbial communities most likely provide ideal conditions to design spatio-temporal studies on phototrophic host-symbiont dynamics.
ACKNOWLEDGEMENTS
We thank the UOG Marine Laboratory boat crews and Mr. Jim Pinson for the collection of sponges from the twilight zone. We also thank two anonymous reviewers for valuable comments and suggestions.
ADDITIONAL INFORMATION AND DECLARATIONS
Funding
GS acknowledges funding for microbiological analyses at the University of Auckland in the authors’ laboratory by the German Academic Exchange Service (DAAD) short term fellowship ‘Microbial Symbiosis and Diversity in Marine Sponges’ from 02/2013 to 06/2013. PJS acknowledges funding by the National Cancer Institute (grant 5U56CA096278) and NIH MBRS SCORE (grant S06-GM-44796). The funders had no role in study design, data collection and analysis, decision to publish, or preparation of the manuscript.
Grant Disclosures
The following grant information was disclosed by the authors: German Academic Exchange Service (DAAD).
Microbial Symbiosis and Diversity in Marine Sponges. National Cancer Institute: 5U56CA096278.
NIH MBRS SCORE: S06-GM-44796.
Competing Interests
Author Contributions
• Georg Steinert conceived and designed the experiments, performed the experiments,
analyzed the data, wrote the paper, prepared figures and/or tables.
• Michael W. Taylor and Peter J. Schupp conceived and designed the experiments,
contributed reagents/materials/analysis tools, reviewed drafts of the paper.
• Peter Deines, Rachel L. Simister and Michael Hoggard performed the experiments,
reviewed drafts of the paper.
• Nicole J. de Voogd reviewed drafts of the paper, taxonomic classification of the sponges.
DNA Deposition
The following information was supplied regarding the deposition of DNA sequences: The obtained raw sequence data can be accessed via the NCBI Sequence Read Archive
under accession numberSRX838037.
Data Availability
The following information was supplied regarding data availability:
The 97% OTU abundance table combined with the Greengenes classification for each individual OTU can be accessed via the Figshare online repository—
10.6084/m9.figshare.2063280.
The best hits and representative sequences for the most abundant OTUs can be accessed via the Figshare online repository (10.6084/m9.figshare.2366827).
Supplemental Information
Supplemental information for this article can be found online athttp://dx.doi.org/10.7717/
peerj.1936#supplemental-information.
REFERENCES
Ainsworth TD, Thurber RV, Gates RD. 2010.The future of coral reefs: a microbial perspective.Trends in Ecology & Evolution25:233–240
DOI 10.1016/j.tree.2009.11.001.
Anderson MJ. 2001.A new method for non-parametric multivariate analysis of variance.
Austral Ecology26:32–46DOI 10.1111/j.1442-9993.2001.01070.pp.x.
Anderson MJ. 2006.Distance-based tests for homogeneity of multivariate dispersions.
Biometrics62:245–253 DOI 10.1111/j.1541-0420.2005.00440.x.
Anderson SA, Northcote PT, Page MJ. 2010.Spatial and temporal variability of the bacterial community in different chemotypes of the New Zealand marine sponge
Mycale hentscheli.FEMS Microbiology Ecology72:328–342
DOI 10.1111/j.1574-6941.2010.00869.x.
Arillo A, Bavestrello G, Burlando B, Sarà M. 1993.Metabolic integration between
symbiotic cyanobacteria and sponges: a possible mechanism.Marine Biology
117:159–162DOI 10.1007/BF00346438.
Bayer K, Kamke J, Hentschel U. 2014.Quantification of bacterial and archaeal symbionts
in high and low microbial abundance sponges using real-time PCR.FEMS
Bell JJ. 2008.The functional roles of marine sponges.Estuarine, Coastal and Shelf Science 79:341–353DOI 10.1016/j.ecss.2008.05.002.
Blanquer A, Uriz MJ, Galand PE. 2013.Removing environmental sources of variation to gain insight on symbionts vs. transient microbes in high and low microbial
abundance sponges.Environmental Microbiology 15:3008–3019
DOI 10.1111/1462-2920.12261.
Bongaerts P, Riginos C, Ridgway T, Sampayo EM, Van Oppen MJH, Englebert N, Vermeulen F, Hoegh-Guldberg O. 2010.Genetic divergence across habitats in the
widespread coralSeriatopora hystrixand its associatedSymbiodinium.PLoS ONE
5:e10871DOI 10.1371/journal.pone.0010871.
Brazeau DA, Lesser MP, Slattery M. 2013.Genetic structure in the coral,Montastraea cavernosa: assessing genetic differentiation among and within mesophotic reefs.PLoS
ONE8:e65845DOI 10.1371/journal.pone.0065845.
Cárdenas CA, Bell JJ, Davy SK, Hoggard M, Taylor MW. 2014.Influence of environ-mental variation on symbiotic bacterial communities of two temperate sponges.
FEMS Microbiology Ecology88:516–527 DOI 10.1111/1574-6941.12317.
Cleary DFR, Becking LE, De Voogd NJ, Pires ACC, Polónia ARM, Egas C, Gomes NCM. 2013.Habitat- and host-related variation in sponge bacterial symbiont
communities in Indonesian waters.FEMS Microbiology Ecology 85:465–482
DOI 10.1111/1574-6941.12135.
Easson CG, Thacker RW. 2014.Phylogenetic signal in the community structure of host-specific microbiomes of tropical marine sponges.Frontiers in Microbiology
5:1–11DOI 10.3389/fmicb.2014.00532.
Edgar RC, Haas BJ, Clemente JC, Quince C, Knight R. 2011.UCHIME improves sensitivity and speed of chimera detection.Bioinformatics27:2194–2200
DOI 10.1093/bioinformatics/btr381.
Erwin PM, Coma R, López-Serdino P, Serrano E, Ribes M. 2015.Stable symbionts across the HMA-LMA dichotomy: low seasonal and interannual variation in
sponge-associated bacteria from taxonomically diverse hosts.FEMS Microbiology Ecology
91(10): fiv115DOI 10.1093/femsec/fiv115.
Erwin PM, Pita L, López-Legentil S, Turon X. 2012.Stability of sponge-associated bacteria over large seasonal shifts in temperature and irradiance.Applied and Environmental Microbiology78:7358–7368DOI 10.1128/AEM.02035-12.
Giles EC, Kamke J, Moitinho-Silva L, Taylor MW, Hentschel U, Ravasi T, Schmitt S. 2013.Bacterial community profiles in low microbial abundance sponges.FEMS Microbiology Ecology83:232–241DOI 10.1111/j.1574-6941.2012.01467.x.
Gloeckner V, Wehrl M, Moitinho-Silva L, Gernert C, Schupp PJ, Pawlik JR, Lindquist NL, Erpenbeck D, Wörheide G, Hentschel U. 2014.The HMA-LMA dichotomy revisited: an electron microscopical survey of 56 sponge species.Biological Bulletin 227:78–88.
Hardoim CCP, Costa R. 2014.Temporal dynamics of prokaryotic communities in the marine spongeSarcotragus spinosulus.Molecular Ecology 23:3097–3112
Hentschel U, Piel J, Degnan SM, Taylor MW. 2012.Genomic insights into the marine
sponge microbiome.Nature Reviews Microbiology10:641–654
DOI 10.1038/nrmicro2839.
Hentschel U, Usher KM, Taylor MW. 2006.Marine sponges as microbial fermenters.
FEMS Microbiology Ecology55:167–177 DOI 10.1111/j.1574-6941.2005.00046.x.
Jackson SA, Flemer B, McCann A, Kennedy J, Morrissey JP, O’Gara F, Dobson ADW. 2013.Archaea appear to dominate the microbiome ofInflatella pelliculadeep sea
sponges.PLoS ONE8:e84438DOI 10.1371/journal.pone.0084438.
Jeong I-H, Kim K-H, Park J-S. 2013.Analysis of bacterial diversity in sponges collected off Chujado, an island in Korea, using barcoded 454 pyrosequencing: analysis of a distinctive sponge group containing Chloroflexi.Journal of Microbiology51:570–577
DOI 10.1007/s12275-013-3426-9.
Jeong J-B, Kim K-H, Park J-S. 2015.Sponge-specific unknown bacterial groups detected
in marine sponges collected from Korea through barcoded pyrosequencing.Journal
of Microbiology and Biotechnology25:1–10DOI 10.4014/jmb.1406.06041.
Joachimiak MP, Weisman JL, May BCH. 2006.JColorGrid: software for the visualization
of biological measurements.BMC Bioinformatics7:225
DOI 10.1186/1471-2105-7-225.
Kahng SE, Copus JM, Wagner D. 2014.Recent advances in the ecology of mesophotic
coral ecosystems (MCEs).Current Opinion in Environmental Sustainability7:72–81
DOI 10.1016/j.cosust.2013.11.019.
Lafi FF, Fuerst JA, Fieseler L, Engels C, Goh WWL, Hentschel U. 2009.Widespread
distribution of poribacteria in demospongiae.Applied and Environmental
Microbi-ology75:5695–5699DOI 10.1128/AEM.00035-09.
Lafi FF, Garson MJ, Fuerst JA. 2005.Culturable bacterial symbionts isolated from two distinct sponge species (Pseudoceratina clavataandRhabdastrella globostellata) from the Great Barrier Reef display similar phylogenetic diversity.Microbial Ecology
50:213–220DOI 10.1007/s00248-004-0202-8.
Lee OO, Wang Y, Yang J, Lafi FF, Al-Suwailem A, Qian P-Y. 2011.Pyrosequencing reveals highly diverse and species-specific microbial communities in sponges from the Red Sea.The ISME Journal: Multidisciplinary Journal of Microbial Ecology
5:650–664DOI 10.1038/ismej.2010.165.
Lesser MP, Slattery M, Leichter JJ. 2009.Ecology of mesophotic coral reefs.Journal of Experimental Marine Biology and Ecology375:1–8DOI 10.1016/j.jembe.2009.05.009.
Lesser MP, Slattery M, Stat M, Ojimi M, Gates RD, Grottoli A. 2010. Photoacclimati-zation by the coralMontastraea cavernosain the mesophotic zone: light, food, and
genetics.Ecology 91:990–1003DOI 10.1890/09-0313.1.
Moitinho-Silva L, Bayer K, Cannistraci CV, Giles EC, Ryu T, Seridi L, Ravasi T, Hentschel U. 2014.Specificity and transcriptional activity of microbiota associated
with low and high microbial abundance sponges from the Red Sea.Molecular Ecology
Morrow KM, Fiore CL, Lesser MP. 2016.Environmental drivers of microbial
community shifts in the giant barrel sponge,Xestospongia muta, over a shallow to
mesophotic depth gradient.Environmental Microbiology Epub ahead of print Feb 15
2016 DOI 10.1111/1462-2920.13226.
Naim MA, Morillo JA, Sørensen SJ, Waleed AAS, Smidt H, Sipkema D. 2014.
Host-specific microbial communities in three sympatric North Sea sponges.FEMS
Microbiology Ecology90:390–403DOI 10.1111/1574-6941.12400.
Oksanen J, Blanchet FG, Kindt R, Legendre P, Minchin PR. 2012.vegan: community ecology package. R Packag. version 2.0-2.Available athttp:// cran.r-project.org/
package=vegan.
Olson JB, Gao X. 2013.Characterizing the bacterial associates of three Caribbean sponges
along a gradient from shallow to mesophotic depths.FEMS Microbiology Ecology
85:74–84DOI 10.1111/1574-6941.12099.
Olson JB, Kellogg CA. 2010.Microbial ecology of corals, sponges, and algae in
mesophotic coral environments.FEMS Microbiology Ecology73:17–30
DOI 10.1111/j.1574-6941.2010.00862.x.
Paulay G. 2003.Marine biodiversity of Guam and the Marianas: overview.Micronesica 35–36:653–660.
Pita L, Turon X, López-Legentil S, Erwin PM. 2013.Host rules: spatial stability of bacterial communities associated with marine sponges (Irciniaspp.) in the
Western Mediterranean Sea.FEMS Microbiology Ecology86:268–276
DOI 10.1111/1574-6941.12159.
Quince C, Lanzen A, Davenport RJ, Turnbaugh PJ. 2011.Removing noise from
pyrose-quenced amplicons.BMC Bioinformatics12:38DOI 10.1186/1471-2105-12-38.
R Development Core Team. 2013.R: a language and environment for statistical comput-ing. Vienna: R Foundation of Statistical Computing.Available athttp:// www.r-project.org/.
Reveillaud J, Maignien L, Eren MA, Huber JA, Apprill A, Sogin ML, Vanreusel A. 2014.
Host-specificity among abundant and rare taxa in the sponge microbiome.The ISME
Journal 8:1198–1209DOI 10.1038/ismej.2013.227.
Schloss PD, Gevers D, Westcott SL. 2011.Reducing the effects of PCR amplification
and sequencing artifacts on 16S rRNA-based studies.PLoS ONE6:e27310
DOI 10.1371/journal.pone.0027310.
Schloss PD, Westcott SL, Ryabin T, Hall JR, Hartmann M, Hollister EB, Lesniewski RA, Oakley BB, Parks DH, Robinson CJ, Sahl JW, Stres B, Thallinger GG, Van Horn DJ, Weber CF. 2009.Introducing mothur: open-source, platform-independent, community-supported software for describing and comparing
microbial communities.Applied and Environmental Microbiology 75:7537–7541
DOI 10.1128/AEM.01541-09.
Schmitt S, Angermeier H, Schiller R, Lindquist N, Hentschel U. 2008.Molecular microbial diversity survey of sponge reproductive stages and mechanistic insights
into vertical transmission of microbial symbionts.Applied and Environmental
Schmitt S, Deines P, Behnam F, Wagner M, Taylor MW. 2011.Chloroflexi bacteria are more diverse, abundant, and similar in high than in low microbial abundance
sponges.FEMS Microbiology Ecology78:497–510
DOI 10.1111/j.1574-6941.2011.01179.x.
Schmitt S, Hentschel U, Taylor MW. 2012.Deep sequencing reveals diversity and community structure of complex microbiota in five Mediterranean sponges.
Hydrobiologia687:341–351 DOI 10.1007/s10750-011-0799-9.
Schmitt S, Tsai P, Bell J, Fromont J, Ilan M, Lindquist N, Perez T, Rodrigo A, Schupp PJ, Vacelet J, Webster N, Hentschel U, Taylor MW. 2012.Assessing the complex sponge microbiota: core, variable and species-specific bacterial communities in
marine sponges.The ISME Journal6:564–576DOI 10.1038/ismej.2011.116.
Simister RL, Deines P, Botté ES, Webster NS, Taylor MW. 2012a.Sponge-specific clusters revisited: a comprehensive phylogeny of sponge-associated microorganisms.
Environmental Microbiology14:517–524DOI 10.1111/j.1462-2920.2011.02664.x.
Simister RL, Taylor MW, Rogers KM, Schupp PJ, Deines P. 2013.Temporal molecular and isotopic analysis of active bacterial communities in two New Zealand sponges.
FEMS Microbiology Ecology85:195–205 DOI 10.1111/1574-6941.12109.
Simister RL, Taylor MW, Tsai P, Fan L, Bruxner TJ, Crowe ML, Webster N. 2012b.
Thermal stress responses in the bacterial biosphere of the Great Barrier Reef
sponge,Rhopaloeides odorabile.Environmental Microbiology14:3232–3246
DOI 10.1111/1462-2920.12010.
Slattery M, Lesser MP, Brazeau D, Stokes MD, Leichter JJ. 2011.Connectivity and stability of mesophotic coral reefs.Journal of Experimental Marine Biology and Ecology 408:32–41DOI 10.1016/j.jembe.2011.07.024.
Soininen J. 2010.Species turnover along abiotic and biotic gradients: patterns in space equal patterns in time?Bioscience60:433–439 DOI 10.1525/bio.2010.60.6.7.
Steinert G, Whitfield S, Taylor MW, Thoms C, Schupp PJ. 2014.Application of
diffusion growth chambers for the cultivation of marine sponge-associated bacteria.
Marine Biotechnology16:594–603DOI 10.1007/s10126-014-9575-y.
Taborosi D, Jenson JW, Mylroie JE. 2003.Zones of enhanced dissolution and associated cave morphology in an uplifted carbonate island karst aquifer, northern Guam, Mariana Islands.Speleogenesis and Evolution of Karst Aquifers1:1–16.
Taylor MW, Radax R, Steger D, Wagner M. 2007.Sponge-associated microorganisms: evolution, ecology, and biotechnological potential.Microbiology and Molecular Biology Reviews71:295–347DOI 10.1128/MMBR.00040-06.
Taylor MW, Schupp PJ, Dahllöf I, Kjelleberg S, Steinberg PD. 2004.Host specificity in marine sponge-associated bacteria, and potential implications for marine microbial
diversity.Environmental Microbiology6:121–130
DOI 10.1046/j.1462-2920.2003.00545.x.
Taylor MW, Schupp PJ, De Nys R, Kjelleberg S, Steinberg PD. 2005.Biogeography of
bacteria associated with the marine spongeCymbastela concentrica.Environmental
Taylor MW, Tsai P, Simister RL, Deines P, Botte E, Ericson G, Schmitt S, Webster NS. 2013.‘‘Sponge-specific’’ bacteria are widespread (but rare) in diverse marine environments.The ISME Journal: Multidisciplinary Journal of Microbial Ecology
7:438–443DOI 10.1038/ismej.2012.111.
Thacker RW, Freeman CJ. 2012.Sponge-microbe symbioses: recent advances and new directions.Advances in Marine Biology62:57–111
DOI 10.1016/B978-0-12-394283-8.00002-3.
Webster NS, Cobb RE, Negri AP. 2008.Temperature thresholds for bacterial symbiosis
with a sponge.The ISME Journal2:830–842DOI 10.1038/ismej.2008.42.
Webster NS, Taylor MW, Behnam F, Lücker S, Rattei T, Whalan S, Horn M, Wagner M. 2010.Deep sequencing reveals exceptional diversity and modes of
transmis-sion for bacterial sponge symbionts.Environmental Microbiology12:2070–2082
DOI 10.1111/j.1462-2920.2009.02065.x.
Weigel BL, Erwin PM. 2015.Intraspecific variation in microbial symbiont communities of the sun sponge,Hymeniacidon heliophila, from intertidal and subtidal habitats.
Applied and Environmental Microbiology 82:650–658DOI 10.1128/AEM.02980-15.
Weisz JB, Lindquist N, Martens CS. 2008.Do associated microbial abundances impact
marine demosponge pumping rates and tissue densities?Oecologia155:367–376
DOI 10.1007/s00442-007-0910-0.
White JR, Patel J, Ottesen A, Arce G, Blackwelder P, Lopez JV. 2012.Pyrosequencing of bacterial symbionts withinAxinella corrugatasponges: diversity and seasonal
variability.PLoS ONE7:e38204DOI 10.1371/journal.pone.0038204.
Wilkinson CR, Fay P. 1979.Nitrogen fixation in coral reef sponges with symbiotic
cyanobacteria.Nature279:527–529 DOI 10.1038/279527a0.
Wright AD, Schupp PJ, Schrör J-P, Engemann A, Rohde S, Kelman D, De Voogd N, Carroll A, Motti CA. 2012.Twilight zone sponges from Guam yield theonellin
isocyanate and psammaplysins I and J.Journal of Natural Products75:502–506
DOI 10.1021/np200939d.
Zeng Y, Feng F, Medová H, Dean J, Koblížek M. 2014.Functional type 2 photosynthetic
reaction centers found in the rare bacterial phylum Gemmatimonadetes.Proceedings
of the National Academy of Sciences of the United States of America111:7795–7800