Gender Roles, Gender (In)equality and Fertility:
An Empirical Test of Five Gender Equity Indices
Melinda Mills
Department of Sociology/ICS University of Groningen Groningen, The Netherlands E-mail: [email protected]
Abstract
The division of gender roles in the household and societal level gender (in)equality have been situated as one of the most powerful factors underlying fertility behaviour. Despite continued theoretical attention to this issue by demographers, empirical research integrating gender roles and equity in relation to fertility remains surprisingly sparse. This paper first provides a brief review of previous research that has examined gender roles and fertility followed by a comparison of six prominent gender equality indices: Gender-related Development Index (GDI), Gender Empowerment Measure (GEM), Gender Gap Index (GGI), Gender Equality Index (GEI), the European Union Gender Equality Index (EU-GEI) and the Social Institutions and Gender Index (SIGI). The paper then tests how five of these indices impact fertility intentions and behaviour using a series of multilevel (random-coefficient) logistic regression models, applying the European Social Survey (2004/5). The GDI, with its emphasis on human development, adjusted for gender, has the strongest and significant effect on fertility intentions. The EU-GEI, which focuses on the universal caregiver model, uncovers that more equity significantly lowers fertility intentions, but only for women. The remaining indicators show no significant impact. The paper concludes with a reflection and suggestions for future research.
Key Words: Fertility, gender roles, gender inequality, household division of labour, measurement
_______ ______________________________________________________________________________________________________________________________________
_____________________________________________________________________________________________________________________________________________ 445
Canadian Studies in Population, Vol. 37.3-4, Fall/Winter, pp. 445-474
Résumé
La division entre les rôles des sexes dans les ménages et l’(in)égalité au niveau social a été identifiée comme étant un des facteurs les plus importants qui sous-tendent les comportements de fécondité. Malgré l'attention théorique accordée à cette question par les démographes, une recherche empirique intégrant les rôles des sexes et l'équité en matière de fécondité reste étonnement rare. L’article présente d’abord un bref aperçu des recherches antérieures qui ont examiné les rôles des sexes et la fécondité, puis, offre une comparaison de six indicateurs reconnus de l’égalité des sexes: l’indicateur sexospécifique du développement humain (SDH), l’indicateur de la participation des femmes (IPF), l’indicateur de disparité entre les sexes (IDS), l’indicateur de la participation des femmes de l’Union européenne (IPF-UE) et l’indicateur de l’inégalité homme-femme dans les institutions sociales (IIIS). Enfin, l’article teste la manière dont cinq de ces indices impactent les intentions et les comportements de fécondité en utilisant des modèles de régression logistique multiniveau (coefficient aléatoire) et en appliquant les données du European Social Survey (2004/2005). Le SDH, avec son emphase sur le développement humain, ajusté par sexe, représente l'impact le plus fort et le plus important sur les intentions de fécondité. L’IPF-EU, qui se concentre sur le modèle universel du fournisseur de soins, démontre que plus il y a d’équité plus cela entraîne une sérieuse baisse des intentions de fécondité, mais seulement chez les femmes. Les autres indicateurs ne démontrent aucun impact important. L’article conclut avec une réflexion et des suggestions pour la recherche future.
Mots-clés : Fécondité, rôles des sexes, inégalité des sexes, division du travail dans les ménages, mesure
Introduction
Gender systems may be one of the most crucial aspects underlying fertility patterns (McDonald 2000a), yet despite continued warnings of this omission (e.g., Watkins 1993; Presser 1997), empirical applications remain surprisingly sparse. As Harriet Presser (1997: 295) argued over a decade ago: “gender issues have become central in the policy arena while remaining marginal in demographic research.” The 1994 International _____________________________________________________________________________________________________________________________________________
_____________________________________________________________________________________________________________________________________________ 446
Melinda Mills
Conference on Population and Development pushed gender into the centre of demographic discussions, but empirical research on this topic has gained considerably less momentum.
When gender is included in explanations of fertility in industrialized societies, it is often exclusively in relation to the changing educational and employment position of women. Women’s increased participation in education and the labour force and the availability of reliable forms of contraception has been central in understanding decreases in fertility (Rindfuss et al. 1996; van de Kaa 1987), yet it provides only a partial explanation. As also described in broader frameworks, such as the second demographic transition (Lesthaeghe and van de Kaa 1986; van de Kaa 1987), there are additional factors that impact fertility including health, the broader economic context and opportunities for women, household division of labour, and empowerment within a society to make individual choices.
The more narrow focus of the majority of literature, which has focused on gains in women’s education and labour force participation in relation to fertility, means that research has suffered from four serious shortcomings. First, there are institutions beyond education and the labour market that remain highly powerful yet continue to evade equalization, such as the household division of labour, tax systems and societal and political empowerment. Second, the focus almost exclusively on women in fertility research has resulted in the grave omission of considering men and couple fertility decisions (Puur et al. 2008). Third, although women across many Western countries now achieve high levels of educational and labour market participation, women’s role and the division of household labour within the family has remained relatively constant (Hook 2010). This ‘stalled revolution’ (Hochschild 1989) in the household appears to be a crucial factor inhibiting fertility. Finally, the importance of gender roles, equity and systems has often been argued in purely theoretical terms, based on the pioneering work of researchers such as Folbre (1983), Oppenheimer (1994) and Mason (1997) and extended in the work of McDonald (2000a; 2000b; 2006). Although gender roles has been operationalized and examined (Olah 2003; Miller, Torr and Short 2004; Mills et al. 2010), societal gender equity has less often been evaluated empirically in relation to fertility. This paper provides a unique contribution to the literature by engaging in an exploratory empirical analysis to test which measures of societal gender equity impact fertility decisions and behaviour.
After providing a brief definition of gender systems, the paper turns to a review of previous fertility studies that have integrated these aspects. This is then followed by a description of the six most prominent _____________________________________________________________________________________________________________________________________________
_____________________________________________________________________________________________________________________________________________ Gender Roles, Gender (In)equality and Fertility: An Empirical Test of Five Gender Equity Indices
and international gender (in)equality indices. To empirically test whether gender equity has an impact on fertility an exploratory analysis is carried out within 24 European countries, which compares the impact of each of these indices on fertility intentions and behaviour. The paper concludes with a critical reflection about the use of macro-level gender (in)equality indices in quantitative fertility research and directions for future research.
Defining Gender Systems:
Gender Roles and Gender Equity
Over two decades ago, Folbre (1983: 267) argued that ignoring household power relations was a “fatal error of omission” in fertility theory. Recent policy directives also appear to overlook this aspect. Even at the height of the lowest-low fertility discussion in Europe (Kohler, Billari and Ortega 2002), the European Union (2004) introduced a mandate to increase women’s paid labour market participation and failed to fully recognize that women in many countries continue to engage in a substantial ‘second shift’ (Hochschild 1989). This reflects McDonald’s (2000a) main premise that very low fertility is the result of a hiatus of sustained gender inequity in family-oriented social institutions.
It appears that the unequal division of household labour is relatively persistent in many countries, with men consistently doing less and women involved in particular types of household activities (Hook 2010). Examining time-use surveys from 1965–2003, Hook (2010) demonstrated that although there was a decrease in gender specialization since the 1960s in selected countries, it was more attributed to the institutional context (e.g., public child care, parental leave) and changes in the nature of housework. Although there was less time spent in cooking, however, this was likely attributed to lower standards and use of services or prepared substitutes than the take-up of these activities by men (van der Lippe, Tijdens and de Ruijter 2004). Hook (2010) also found that a higher prevalence of part-time work of women and long parental leaves increased the sex specialization in household labour.
Oppenheimer (1994) argued that more equal or overlapping gender-roles might in fact, strengthen family relationships, whereas role-specialization is risky and makes the family vulnerable whenever the abilities of one or both partners to provide their particular contribution (earnings or care) diminish. Or as Hook (2010: 1480) maintains, inequality in household labour is: “at the heart of gender inequality in modern welfare states.”
Previous Empirical Research
Over the past years, several empirical studies have shown that the unequal distribution of household labour can impact fertility. In the United States, Miller Torr and Short (2004) also examined the impact of the division of housework on fertility and found a u-shape effect. Both modern couples (i.e., women doing less than 54 percent of the housework) and traditional couples (i.e., women doing more than 80 percent of housework) were more likely to progress to a second birth. Finally, using data from a survey conducted in five urban areas in Italy, Mencarini and Tanturri (2004) found a higher likelihood of having a
_____________________________________________________________________________________________________________________________________________
_____________________________________________________________________________________________________________________________________________ Gender Roles, Gender (In)equality and Fertility: An Empirical Test of Five Gender Equity Indices
second child among working women if the father increased his involvement in housework after a first birth, and if the mother did not reduce her working hours after the first child.
opportunities of men, but these opportunities are then severely restricted by having children, women will react by having less and later children. Core institutional factors related to societal level gender equity are: the level of educational attainment, economic participation and opportunity, health and survival, political empowerment of women and social institutions. This section first describes the problems and misconceptions about measuring gender equity at a societal level, followed by description and reflection on the six most prominent international composite indices. As discussed previously, an operationalization and empirical test of how societal gender inequality impacts fertility has been rarely – if ever – undertaken (for an exception see Mills and Begall 2010). This is likely attributed to two underlying reasons. First, as we will describe shortly, there are several competing indices often consisting of quite different measures or difficult weighting systems, making it difficult for researchers to choose the appropriate measure. Second, the operationalization and empirical measurement of gender inequality suffers from a legacy of confusion and misinterpretation. Perhaps the largest misinterpretation in this field of research is the use of the United Nation Development Programme’s (UNDP) Gender-related Development Index (GDI) and the Gender Empowerment Index (GEM) to measure gender inequality. Although they are often touted as key measures of gender (in)equality, most experts agree that they are in fact not measures of gender inequality at all (Schüler 2006; Klasen 2006; Permanyer 2010). As Dijkstra (2006: 275) argues, these indices are misleading to the extent that they were a “false start” in the measurement of gender equity. Schüler (2006) illustrates how both indices have been abused and misinterpreted in both academic and policy research. As described shortly, the main problem with both the GDI and the GEM is that they do not measure the relative position and status of women in relation to men, but rather mix (and some argue overwhelmingly measure) absolute levels of income per capita or human development (Dijkstra 2006). We first turn to these indicators, since they are the most prominent and oldest measures, followed by indices that have been more recently developed. The ranking of countries according to gender equality between the different indices is then compared and discussed.
_____________________________________________________________________________________________________________________________________________
_____________________________________________________________________________________________________________________________________________ Gender Roles, Gender (In)equality and Fertility: An Empirical Test of Five Gender Equity Indices
Gender-related Development Index (GDI)
The GDI is an index based on the Human Development Index (HDI) and thus predominantly measures the development levels in a country, corrected by the existing gender inequalities. As summarized in Table 1, it consists of three simple dimensions from the HDI of health, educational attainment and educational resources, but split by the sexes. It was developed by Anand and Sen (1995) to ‘penalize’ the HDI if gender inequality existed in any of the three dimensions. The GDI is therefore actually the HDI, but adjusted for gender disparities and can therefore not be strictly interpreted separately from the HDI. As Schüler (2006: 163) argues, this gap between the HDI and GDI should be interpreted as: “the loss of human development due to gender inequality and the size of penalty given to gender inequality.” Although it has often been applied as such, it is not a gender inequality measure in itself. The popularity of the GDI is likely due to its simplicity and wide 157 country coverage. In addition to the problematic aspects of interpretation, the earned income variable is highly problematic and carries significant weight in the index (Jütting et al. 2008).
Gender Empowerment Measure (GEM)
The GEM is another prominent index developed by the UNDP, which measures a very different component of inequality and focuses on whether women have access to certain levels of power. As summarized in Table 1, the GEM has four indicators of economic and political empowerment, which are grouped into the three dimensions of political participation and making, economic participation and decision-making, and power over economic resources. As Table 1 demonstrates, it suffers from the shortcoming of limited and specific measures; lack of health and knowledge measures, includes only 93 countries, and is therefore more appropriate as a complementary indicator. Or as Dijkstra (2006: 276) argues: “The GEM is an odd combination of relative female and male empowerment.”
Gender Equity Index (GEI)
Another prominent measure is the Gender Equity Index (GEI) (Social Watch 2005), which focuses on socio-economic opportunities. In contrast to the GDI and thus similar to the GEM, it introduces political empowerment in addition to education and economic participation.
_____________________________________________________________________________________________________________________________________________
_____________________________________________________________________________________________________________________________________________ Melinda Mills
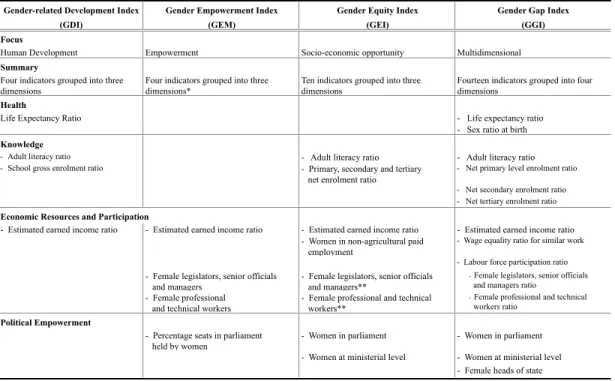
Table 1. A Comparison of Four Prominent Gender Equality Indices.
Gender-related Development Index Gender Empowerment Index Gender Equity Index Gender Gap Index
(GDI) (GEM) (GEI) (GGI)
Focus
Human Development Empowerment Socio-economic opportunity Multidimensional Summary
Four indicators grouped into three dimensions
Four indicators grouped into three dimensions*
Ten indicators grouped into three dimensions
Fourteen indicators grouped into four dimensions
Health
- Life expectancy ratio - Sex ratio at birth Knowledge
- Adult literacy ratio - Adult literacy ratio - Adult literacy ratio
- School gross enrolment ratio - Primary, secondary and tertiary net enrolment ratio
- Net primary level enrolment ratio - Net secondary enrolment ratio - Net tertiary enrolment ratio
- Estimated earned income ratio - Estimated earned income ratio - Estimated earned income ratio - Estimated earned income ratio - Women in non-agricultural paid
employment
- Wage equality ratio for similar work
- Labour force participation ratio
- Female legislators, senior officials and managers
- Female legislators, senior officials and managers**
- Female legislators, senior officials and managers ratio
- Female professional and technical workers
- Female professional and technical workers**
- Female professional and technical workers ratio
Political Empowerment
- Percentage seats in parliament held by women
- Women in parliament - Women in parliament
- Women at ministerial level - Women at ministerial level - Female heads of state
Source: Adapted from Jütting, et al. (2008) in addition to original index sources listed in text.
Notes: * GEM: The two dimensions of ‘Economic participation and decision-making’ and ‘power over economic resources’ (i.e., earned income) is grouped here under one dimension ** GEI: This indicator is listed under ‘empowerment’ in the original indicator and moved here for ease of comparison.
Life Expectancy Ratio
Economic Resources and Participation
_______________________________________________ _______________________________________________ _______________________________________________ _______________________________________________ _______________________________________________ _______________________________________________
Gender Roles, Gender (In)equality
and Fertility:
An Empirical
Test of Five
Gender Equity
Indices
CSP 2010, 37.3-4: 445-474
Although it includes more comprehensive indicators of empowerment and has a broad coverage of 154 countries, as with the GEM, it has the problematic omission of the health dimension.
Gender Gap Index (GGI)
The last column of Table 1 shows the Gender Gap Index (GGI), developed by the World Economic Forum (Hausmann, Tyson and Zahidi 2006), which also builds upon and improves previous measures. It is a multidimensional indicator that uses 14 single indicators to measure the level of economic participation and opportunity, educational attainment, health and survival and political empowerment of women. It has a broad coverage of 115 countries and is comprehensive in its coverage. Jütting et al. (2008) argue that it is more appropriate for developed countries, which is apparent in the chosen measures. It relies less heavily on health indicators, for instance, which are also more equalized and thus less relevant in industrialized nations. In a recent study of gender preferences of children and the transition to third birth in Europe, Mills and Begall (2010) applied the GGI. They found that in societies where there is lower gender equity, both men and women have a significant child preference for boys.
European Union Gender Equality Index (EU-GEI)
Mounting criticisms have resulted in the addition of several innovative gender equity indices in the last few years. These measures diverge from the existing composite indices and are therefore presented separately in Table 2. The European Union Gender Equality Index (EU-GEI), developed by Plantenga et al. (2009) is unique in the sense that it is based upon the universal caregiver model of Fraser (1997). It consists of four dimensions of equal sharing of: paid work, money, decision-making power and time. In contrast to the indices discussed to this point, it not only includes inequality in employment, wages, occupations and the political arena, but also the gender gap in caring time for children and leisure time, the latter of which are unique. It does not include health dimensions, which as discussed previously, are not as relevant within the European context. A shortcoming is that since it is only available for countries within the European Union (EU), it is limited to a few countries and misses some relevant countries in Europe (e.g., Norway, Switzerland) that have not joined the EU.
_____________________________________________________________________________________________________________________________________________
_____________________________________________________________________________________________________________________________________________ Melinda Mills
EU Gender Equality Index
(EU-GEI)
Focus
Social institutions Universal caregiver model
Summary
Twelve indicators grouped into four dimensions Eight indicators grouped into four dimensions
Family Code Equal Sharing of Paid Work
- Early marriage - Gender employment gap
- Polygamy - Gender unemployment gap
- Parental authority
- Inheritance
Physical Integrity Equal Sharing of Money
- Female genital mutilation - Gender pay gap
- Violence against women - Gender poverty gap among
- Missing women single-headed households
Ownership Rights Equal Sharing of Decision Making
Power
- Access to land - Gender gap in parliament
- Access to bank loans - Gender gap in ISCO1
- Access to property other than land
Civil Liberties Equal Sharing of Time
- Restriction to freedom of dress - Gender gap in caring time for children
- Freedom of movement - Gender gap in leisure time
for EU Gender Equality Index
Source: Summary of Jütting, et al. (2008) for SIGI and Plantenga et al. (2009) Table 2
A Summary of Recent Alternative Gender Equity Indicators
Social Indicators Gender Index (SIGI)
_____________________________________________________________________________________________________________________________________________
_____________________________________________________________________________________________________________________________________________ Gender Roles, Gender (In)equality and Fertility: An Empirical Test of Five Gender Equity Indices
Social Indicators Gender Index (SIGI)
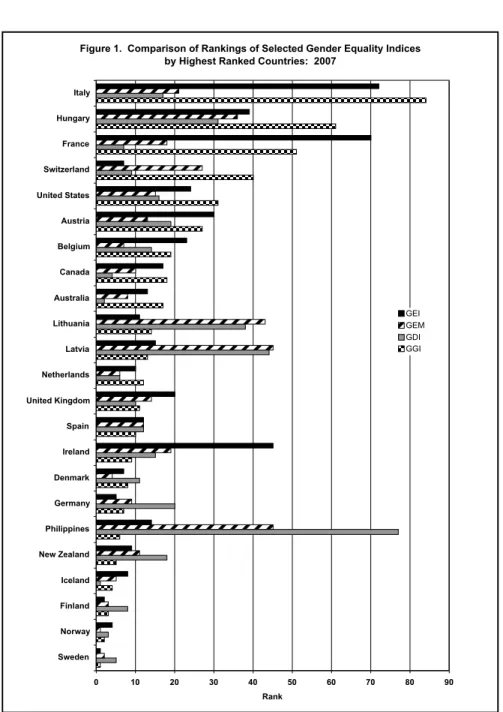
Source: Created by author from: GEI (Social Watch 2007); GDI and GEM (United Nations 2008); GGI (Hausmann, Tyson and Zahidi 2008);
figures are for 2007.
Note: Number of countries ranked: GEI, 154; GGI, 128; GEM and GDI, 177.
Figure 1. Comparison of Rankings of Selected Gender Equality Indices by Highest Ranked Countries: 2007
0 10 20 30 40 50 60 70 80 90
Sweden Norway Finland Iceland New Zealand Philippines Germany Denmark Ireland Spain United Kingdom Netherlands Latvia Lithuania Australia Canada Belgium Austria United States Switzerland France Hungary Italy
Rank
GEI GEM GDI GGI
_____________________________________________________________________________________________________________________________________________
_____________________________________________________________________________________________________________________________________________ Gender Roles, Gender (In)equality and Fertility: An Empirical Test of Five Gender Equity Indices
dimensions shows that it is likely related to low (or high) scores on several indicators and to differences in the weighting of the importance of different aspects. Ireland and France, for instance, appear to be outliers in the sense that they score very low on the pay dimension and political power. As touched upon once again in the conclusions, a more thorough analysis would require deeper comparisons of the construction of each index and separate analyses of the separate indicators, which goes beyond the auspices of this paper.
Empirical Application:
Does Gender Inequality impact Fertility?
The more interesting question is whether these measures of gender inequality can serve as a predictor of fertility intentions and behaviour. Since this is the first empirical comparison of these composite indicators on fertility, we enter unexplored theoretical territory. For this reason, this analysis remains exploratory and no specific hypotheses about expected differences between the indicators are proposed.
To measure the impact of gender inequality on fertility, two different measures are selected: fertility intentions and fertility behaviour in the form of the transition to one or higher order parity. Fertility intentions have been demonstrated to differ considerably between men and women, likely due to different opportunity costs (e.g., Mills and Begall 2010). We also know, however, that intentions do not always translate into behaviour. It is therefore useful to also include a measure of behaviour. The focus of whether individuals make the transition from no to either one or more children is chosen as a basic indicator of behaviour in this first exploratory analysis. The transition to at least one child is a highly pivotal transition, which often results in women reducing their labour market participation or exiting the labour market in many European countries. As touched upon in the final discussion, the analysis by parity would be a useful extension, but goes beyond this initial exploratory analysis.
This analysis applies five of the six indices discussed previously, namely the GDI, GEM, GGI, GEI and EU-GEI. Since the focus will be on 24 European countries, it is not possible to include the SIGI. We should also acknowledge that the GDI is more a measure of human development, and not gender inequality, but is included for comparison in this study.
_____________________________________________________________________________________________________________________________________________
_____________________________________________________________________________________________________________________________________________ 458
Melinda Mills
Data
The individual-level survey data used in this study come from the second wave of the European Social Survey (ESS), which is a large-scale quantitative survey administered in 2004/5 across Europe. The 24 countries that are included in the analysis are shown in the Appendix in Table A1. Several countries are not included that were in the original ESS (Turkey, Ukraine) due to large fertility behaviour differences or lack of comparable variables. As Table A1 shows, several of the indices also miss indicators for some of the countries, which are then not included in the analysis for that particular index. In each country of the ESS, a representative random probability sample was drawn with strict quality controls employed to ensure that all national samples met the requirements. The 2004/5 wave of the ESS contained a module on family, work, and well-being comprising of information on family life and fertility intentions, making this questionnaire particularly suitable. The total sample consisted of 49,066 respondents, which was reduced to examine fertility intentions for those of reproductive age and living with a partner, discussed in detail shortly. The descriptive statistics are not shown here due to space limitations, but are available upon request.
Measures
The two dependent variables in this analysis are fertility intentions for all individuals of reproduction age living with a partner and transition to having one or more children. The dependent variable of fertility intentions was measured by the question of whether the respondent intended to have another child within the next three years. The original variable contained a five-point scale, but is dichotomised in this analysis (Definitely and probability not = 0; Probably yes and definitely yes = 1). Models were also run using the full five-point scale as an ordered logit model, with no significant differences. The second dependent variable measures behaviour by examining the actual transition to having at least one child.
The central explanatory variables are the five different gender indices, which are included in separate models for comparison, also controlling for relevant factors. As described previously, these are the Gender Gap Index (GGI), Gender-related Development Index (GDI), Gender Empowerment Measure (GEM), Gender Equality Index (GEI) and the European Union Gender Equality Index (EU-GEI). The value of each of these gender indices by country and the sources are shown in Appendix Table A1.
_____________________________________________________________________________________________________________________________________________
_____________________________________________________________________________________________________________________________________________ Gender Roles, Gender (In)equality and Fertility: An Empirical Test of Five Gender Equity Indices
A series of control variables are also added in addition to the macro-level gender inequality measures to make the models as realistic as possible. For the fertility intentions model, models are run first both sexes, with men as the reference category. The models are then run separately for men and women. Age of respondents at the time of the interview is included in 5-year dummy variables to account for the non-linear effect.
Educational attainment of the respondent is added as a control and measured in years of full time education, once again as a centred variable. In previous models (not shown here), educational attainment of the partner was also examined but due to high levels of correlation between individuals’ and partners’ education and a lack of difference in the direction of the findings, partners’ education was not included in the final models. Educational attainment is considered as a proxy for the economic ability and higher resources that would enable an individual to have a child. Although income would be a more direct indicator, it could not be included as a control due to the large amount of missing values. Employment status was also added in initial models (not shown here) but due to non-significant results and lack of change in the variables, is not shown in the final models. Home ownership is included as an additional proxy for economic resources and measures whether the house is owned by one of the members of the household.
Methods of Analysis
The first analysis estimates fertility intentions using a sub-sample of all respondents that resided with their partner at the time of the interview (including both married and non-marital cohabiting couples) and were 18– 40 (women) and 18–45 years of age (men). This sample was chosen to ensure that fertility intentions were as realistic as possible. Above the age of 40, relatively few respondents reported the desire to have an additional child. After accounting for missing values, this leaves a subsample of 9,708. The model is then estimated separately for men (N=4,939) and women (N=4,769).
For the analysis of the transition to at least one child, the sub-sample is considerably larger at 22,147 as the only restriction beyond missing values is that it includes all respondents that had children born after 1958. It was only possible to include respondents with one or more children born after 1958. This restriction was necessary because the year of birth was only recorded for children living in the household after this time. Year of birth was recorded for all children living in the household, respondents born before 1958 have children which have moved out _____________________________________________________________________________________________________________________________________________
_____________________________________________________________________________________________________________________________________________ Melinda Mills
already are likely to have grown up children not living in the household. An additional control of whether individuals had children outside of the household was therefore also included in the model. Since the second model examines behaviour and not intentions, models are not run separately for men and women since there is no theoretical or logical expectation that they would have different birth outcomes. One indicates that at least one child was born with zero indicating no transition to at least one child.
Due to the nested structure of individuals within countries, a multilevel logistic regression model is run for both analyses, which is a two-level random coefficient model with respondents (i) nested in the country cluster j, which includes a random intercept uj for clusters in the latent response model (Rabe-Hesketh and Skrondal 2008).
Results
Gender Equity and Fertility Intentions
Since the goal of this analysis was to explore the viability of different composite gender equality indices on fertility outcomes, the focus of the interpretation of results will be solely on the indices with little attention paid to the control variables entered into the model.
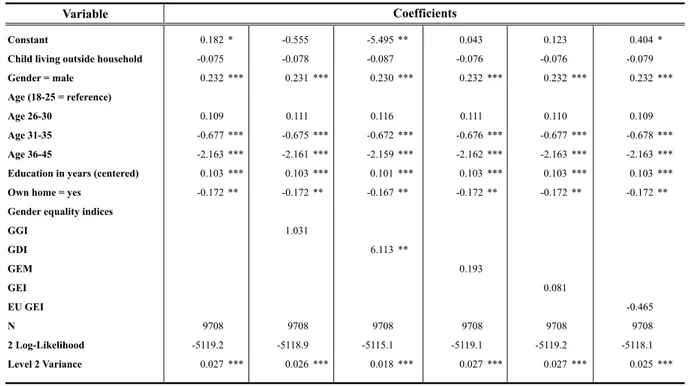
There are two key observations that emerge from examining the full model of both sexes in Table 3. First, the only composite gender index variable that has any significant effect is the Gender-related Development Index (GDI). The GDI is not only significant, but operates in a highly different manner in relation to fertility intentions than the other indicators. There is a strong and significant effect that can be interpreted as the higher the level of human development, controlling for gender differences, the higher the fertility intentions. The GGI also has a strong effect, which is however, only borderline significant. Both the GEM and GEI have small effects, which are not significant. The EU-GEI is the only index that shows a negative (but again not significant) effect, meaning that the higher the level of gender equity, the lower the fertility intentions. We will return to further interpretation of these differences in the final discussion section.
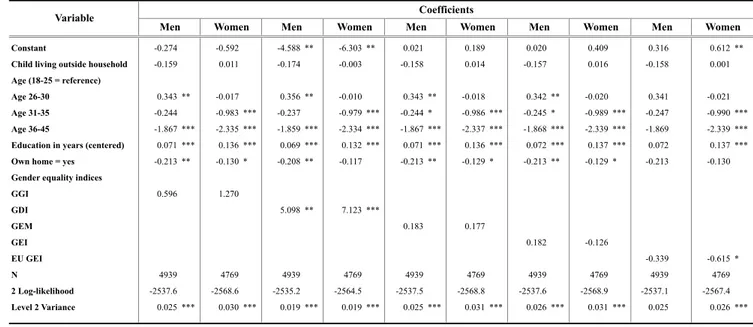
Turning to Table 4, which divides the analyses by sex, we see that the overall effects of the composite gender indices in Table 3 are often driven by women’s fertility intentions. This is the case for the GGI, to a certain extent for the GDI (where the effect is stronger for women, but still significant for men), and very clearly for the EU-GEI. In the case of the EU-GEI, the negative effect of gender equality in the household even
_____________________________________________________________________________________________________________________________________________
_____________________________________________________________________________________________________________________________________________ Gender Roles, Gender (In)equality and Fertility: An Empirical Test of Five Gender Equity Indices
Table 3. Multilevel (random-coefficients) Logistic Regression Model of Intention to have a Child in the next Three Years, both Sexes for 24 European Countries
Variable
Constant 0.182 * -0.555 -5.495 ** 0.043 0.123 0.404 *
Child living outside household -0.075 -0.078 -0.087 -0.076 -0.076 -0.079
Gender = male 0.232 *** 0.231 *** 0.230 *** 0.232 *** 0.232 *** 0.232 ***
Age (18-25 = reference)
Age 26-30 0.109 0.111 0.116 0.111 0.110 0.109
Age 31-35 -0.677 *** -0.675 *** -0.672 *** -0.676 *** -0.677 *** -0.678 ***
Age 36-45 -2.163 *** -2.161 *** -2.159 *** -2.162 *** -2.163 *** -2.163 ***
Education in years (centered) 0.103 *** 0.103 *** 0.101 *** 0.103 *** 0.103 *** 0.103 ***
Own home = yes -0.172 ** -0.172 ** -0.167 ** -0.172 ** -0.172 ** -0.172 **
Gender equality indices
GGI 1.031
GDI 6.113 **
GEM 0.193
GEI 0.081
EU GEI -0.465
N 9708 9708 9708 9708 9708 9708
2 Log-Likelihood -5119.2 -5118.9 -5115.1 -5119.1 -5119.2 -5118.1
Level 2 Variance 0.027 *** 0.026 *** 0.018 *** 0.027 *** 0.027 *** 0.025 ***
Source: Calculations by author from European Social Survey, 2004/2005.
Notes: Includes only women aged 18-40 years and men aged 18-45 years living with a partner. *p < .1, **p < .05, ***p < .001
Coefficients
_______________________________________________
_______________________________________________
_______________________________________________
_______________________________________________
_______________________________________________
_______________________________________________
Melinda Mills
CSP 2010, 37.3-4: 445-474
Table 4. Multilevel (random-coefficients) Logistic Regression Model of Intention to have a Child in the next Three Years, by Men and Women,
Constant -0.274 -0.592 -4.588 ** -6.303 ** 0.021 0.189 0.020 0.409 0.316 0.612 **
Child living outside household -0.159 0.011 -0.174 -0.003 -0.158 0.014 -0.157 0.016 -0.158 0.001
Age (18-25 = reference)
Age 26-30 0.343 ** -0.017 0.356 ** -0.010 0.343 ** -0.018 0.342 ** -0.020 0.341 -0.021
Age 31-35 -0.244 -0.983 *** -0.237 -0.979 *** -0.244 * -0.986 *** -0.245 * -0.989 *** -0.247 -0.990 ***
Age 36-45 -1.867 *** -2.335 *** -1.859 *** -2.334 *** -1.867 *** -2.337 *** -1.868 *** -2.339 *** -1.869 -2.339 ***
Education in years (centered) 0.071 *** 0.136 *** 0.069 *** 0.132 *** 0.071 *** 0.136 *** 0.072 *** 0.137 *** 0.072 0.137 ***
Own home = yes -0.213 ** -0.130 * -0.208 ** -0.117 -0.213 ** -0.129 * -0.213 ** -0.129 * -0.213 -0.130
Gender equality indices
GGI 0.596 1.270
GDI 5.098 ** 7.123 ***
GEM 0.183 0.177
GEI 0.182 -0.126
EU GEI -0.339 -0.615 *
N 4939 4769 4939 4769 4939 4769 4939 4769 4939 4769
2 Log-likelihood -2537.6 -2568.6 -2535.2 -2564.5 -2537.5 -2568.8 -2537.6 -2568.9 -2537.1 -2567.4
Level 2 Variance 0.025 *** 0.030 *** 0.019 *** 0.019 *** 0.025 *** 0.031 *** 0.026 *** 0.031 *** 0.025 0.026 ***
Source: Calculations by author from European Social Survey, 2004/2005.
Notes: Includes only women aged 18-40 years and men 18-45 years living with a partner. *p < .1, **p < .05, ***p < .001
Women for 24 European Countries
Coefficients
Men
Men Women Women
Variable
Men Women Men Women Men
_______________________________________________
_______________________________________________
_______________________________________________
_______________________________________________
_______________________________________________
_______________________________________________
Gender Roles, Gender (In)equality
and Fertility:
An Empirical
Test of Five
Gender Equity
Indices
CSP 2010, 37.3-4: 445-474
becomes significant for women. As we will discuss in more detail shortly, a bold interpretation would be that higher household gender equity appears to free women from caregiving and reproduction and thus lower their overall fertility intentions.
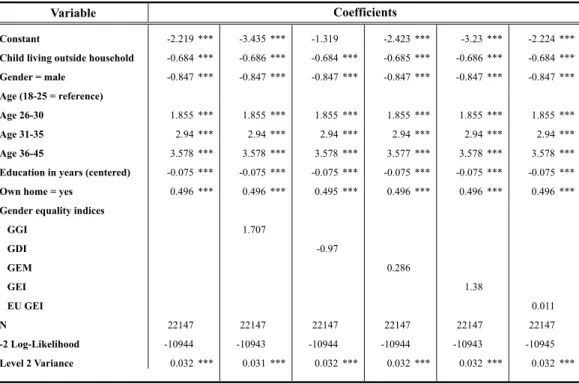
Gender Equity and Transition to at least One Child
Table 5 provides the results for the analysis of the transition to at least one child where we will once again only focus on the findings related to the composite gender equality indices. In contrast to the analysis of fertility intentions, none of the gender indices are significant or appear to provide a clear improvement to the fit of the model. Both the GDI and GEI, which are borderline significant, demonstrate that higher levels of societal gender equality translate into the transition to having at least one child in Europe. The GEM and EU-GEI do not provide conclusive effects. The GDI is also not significant and even has a negative effect, suggesting that higher levels of human development, adjusted for gender, result in lower levels of the transition to at least one child. In a previous analysis examining only the transition to third births (and not at least one child as shown here), Mills and Begall (2010) found that the GDI was a significant predictor, which suggests that more detailed analyses by parity might uncover further distinctions and effects. We now turn to this and further reflections.
Discussion
Summary and Interpretation of Results
This paper contributes to existing literature by conducting the first exploratory analysis to establish whether the theoretical suppositions about the impact of societal gender inequality on fertility empirically hold. Although the importance of gender systems, in the form of gender roles and societal gender stratification, are often emphasized in theoretical terms in existing demographic literature, there have been few empirical applications to test these assumptions. A review of previous research shows a significant link between unbalanced gender roles in the form of unequal division of household labour on fertility intentions and behaviour. Relatively no empirical research has been conducted using individual-level survey data to connect societal levels of gender inequality to fertility decisions and outcomes.
_____________________________________________________________________________________________________________________________________________
_____________________________________________________________________________________________________________________________________________ 464
Melinda Mills
Variable
Constant -2.219 *** -3.435 *** -1.319 -2.423 *** -3.23 *** -2.224 ***
Child living outside household -0.684 *** -0.686 *** -0.684 *** -0.685 *** -0.686 *** -0.684 ***
Gender = male -0.847 *** -0.847 *** -0.847 *** -0.847 *** -0.847 *** -0.847 ***
Age (18-25 = reference)
Age 26-30 1.855 *** 1.855 *** 1.855 *** 1.855 *** 1.855 *** 1.855 ***
Age 31-35 2.94 *** 2.94 *** 2.94 *** 2.94 *** 2.94 *** 2.94 ***
Age 36-45 3.578 *** 3.578 *** 3.578 *** 3.577 *** 3.578 *** 3.578 ***
Education in years (centered) -0.075 *** -0.075 *** -0.075 *** -0.075 *** -0.075 *** -0.075 ***
Own home = yes 0.496 *** 0.496 *** 0.495 *** 0.496 *** 0.496 *** 0.496 ***
Gender equality indices
GGI 1.707
GDI -0.97
GEM 0.286
GEI 1.38
EU GEI 0.011
N 22147 22147 22147 22147 22147 22147
-2 Log-Likelihood -10944 -10943 -10944 -10944 -10943 -10945
Level 2 Variance 0.032 *** 0.031 *** 0.032 *** 0.032 *** 0.032 *** 0.032 ***
Source: Calculations by author from European Social Survey, 2004/2005.
* p <.1 ** p < .05 *** p <.001
Table 5. Multilevel (random-coefficients) Logistic Regression Model of Transition to having One or more
Coefficients
Notes: Includes all respondents who had either no children (reference) or 1 or more children by the survey date born after 1958. Children for 24 European Countries
_______________________________________________
_______________________________________________
_______________________________________________
_______________________________________________
_______________________________________________
_______________________________________________
Gender Roles, Gender (In)equality
and Fertility:
An Empirical
Test of Five
Gender Equity
Indices
CSP 2010, 37.3-4: 445-474
A review of the six prominent gender inequality indices revealed that there are multiple choices and considerable confusion about what these indices measure. They often measure different aspects of gender equality, with some more focussed on human development (GDI) and others serving as more complementary measures of certain aspects of gender inequality such as empowerment (GEM), social institutions (SIGI) or the universal caregiver model (EU-GEI). Even when they measure similar aspects, however, they appear to rank certain countries quite disparately, which requires a deeper analysis into the different components, construction of the indices and the separate effect of different dimensions.
An empirical test of these indices was then undertaken to examine the impact of societal gender inequality on fertility intentions and behaviour across 24 European countries. A central result was that a higher level on the GDI score indicated both significantly higher fertility intentions. This striking finding is likely attributed to the fact that the GDI is more related to human development and economic prosperity than gender equity itself (Jüttting et al. 2008). It also suggests that measures more related to economic security may be the driving factors behind fertility, also found in previous research (e.g., Mills, Blossfeld and Klijzing 2005).
When the analysis was split by the sexes, an interesting difference emerged between men and women when modelling the impact of the EU-GEI. Recall that the most unique aspect of this indicator, built upon Fraser’s (1997) universal caregiver model, was the introduction of equal sharing of time in the form of gaps in caring time for children and leisure time (Plantenga et al. 2009). There was a negative and significant coefficient for women, which suggests that women in more gender equal societal contexts operate in a more equal manner to men (also in terms of employment, wages, political empowerment), which also frees them from reproduction and results in lower fertility intentions. It remains important to not over interpret this finding as it measures intentions and not actual behaviour, with fertility remaining a couple decision.
The final analysis examined the transition to at least one child. None of the gender indices showed any significant effect, but with the GDI and GEI measures bordering on significance with a large effect of higher gender equity translating into the transition to at least one child. GDI was not significant and even had a negative sign in this model. It may be that in the higher equity contexts, which have strong work-family policy reconciliation, women are able to combine employment with high fertility. In other words, it is not a choice of ‘either a family’ or ‘a career’.
_____________________________________________________________________________________________________________________________________________
_____________________________________________________________________________________________________________________________________________ 466
Melinda Mills
Shortcomings and Future Directions for Research
This paper was an initial exploratory analysis that answered some questions, but raised additional issues. The main question remains: Did this analysis empirically demonstrate that gender inequality impacts fertility? The answer is a nuanced one of yes and no.
First, it may be that the lack of significant findings for some indices (and significant results for others) was due to the focus on fertility intentions for all and the more global transition to at least one child. Future analyses could focus on fertility intentions not of all individuals or transitions to at least one birth, but divide them by parity.
A second limitation is that the analysis only includes the full composite indicator of each gender equity measure. Since each of these measures consist of multiple dimensions, it would be useful to examine how each of these dimensions impact fertility in a different manner. This would allow, for example, for economic or health factors to be separated from economic factors and more precision could be paid to determining the strength of these different dimensions.
This exploratory analysis only included 24 European countries, which are relatively homogeneous in their levels of gender equity and are generally middle to high-income countries. A third extension could therefore be to include a much broader variety of countries, also from non-OECD and developing nations. It would also be interesting to test the SIGI social institutions index (Jütting et al. 2008), which would require a focus on non-OECD countries. It may be that gender equity has a considerably stronger effect on fertility in developed countries.
A fourth concern is the need to reflect about what we are measuring with these broad macro gender equity measures and whether it in fact captures gender inequality in relation to fertility within Europe. These macro-level measures remain at the societal level and we know that effects are often more nuanced, based on regions, municipalities or affiliation to a particular group.
A fifth and related question is not what we are measuring, but
actually: What are we not measuring? Gender equity often materializes at
the national state level inherent in income transfer systems, services, educational systems and industrial relations (McDonald 2000b; Esping-Andersen 1996; Hofmeister, Blossfeld and Mills 2006). With their focus on broader internationally comparable indicators, often skewed in the direction of developing countries, most of the indicators miss social institutional measures relevant for many industrialized nations. Many advanced economies, particularly in Europe, maintain income transfer arrangements that support the male-breadwinner model. This occurs in the form of employment or occupationally-based social insurance,
_____________________________________________________________________________________________________________________________________________
_____________________________________________________________________________________________________________________________________________ Gender Roles, Gender (In)equality and Fertility: An Empirical Test of Five Gender Equity Indices
earnings-based benefits, or joint taxation rules. For example, some joint-taxation rules can operate as an employment disincentive for one partner such as when tax rebates are provided for a dependent spouse (Gustavsson and Stafford 1994). Whereas the Nordic countries such as Sweden have ‘gender neutral’ tax systems, traditionally male-breadwinner countries such as Germany, the Netherlands and Belgium maintain tax systems that punish a second earner (Esping-Andersen 1996). Another body of research has shown that fertility tends to be higher in countries that have more family-friendly working conditions. This includes the provision of childcare, availability of part-time work, flexibility of hours, maternity and paternity leave and more open conditions for absence (Rindfuss and Brauner-Otto 2008).
A sixth related criticism is that some of the macro-level measures remain almost as a caricature of the national situation. If we take political empowerment for example, it remains a question as to whether the representation of women in politics is actually a proxy for women’s individual empowerment. Germany may have Chancellor Angela Merkel, for example, but this is counteracted by a tax system that supports the male-breadwinner/female caregiver model and has highly limited childcare for children under 3.
If pressed to give an answer about whether macro-level gender equity measures should be used in future research and which gender equality index should be applied, the answer would be that it highly depends on the choice of the country or countries under study and the specific research question. If more detailed analyses were undertaken examining differences by parity and exploring variation outside of Europe, the existing indices may perform better. The more multidimensional GGI seems to capture more nuances in developed nations. The EU-GEI may also be useful when examining more work-family related issues and outcomes beyond fertility. Other research questions may demand a focus on women’s empowerment, health or social institutions, demanding more focus and appropriate indices in this respect. Although preliminary, this analysis provides a first empirical window into how societal gender equity might impact fertility intentions and outcomes in developed countries.
Acknowledgement
Responsibility for any errors rests with the author.
_____________________________________________________________________________________________________________________________________________
_____________________________________________________________________________________________________________________________________________ Melinda Mills
References
Anand, S. and A. Sen. 1995. Gender inequality in human development: Theories and measurement. Occasional Paper 19, UNDP, New York.
Anxo, D., L. Flood, L. Mencarini, A. Pailhé, A. Solaz, and M. L. Tanturri. 2007. Time Allocation between Work and Family Over the Life-Cycle: A Comparative Gender Analysis of Italy, France, Sweden and the United States. IZA Discussion Paper, No. 3193 (November). Available at SSRN:
http://ssrn.com/abstract=1049381.
Becker, G. S. 1981. A Treatise on the Family. Cambridge, MA: Harvard University Press.
European Commission. 2004. Employment in Europe 2004: Recent Trends and Prospects. Luxembourg: Office for Official Publications of the European Communities.
Folbre, N. 1983. Of patriarchy born: The political economy of fertility decisions. Feminist Studies 9(2): 261-284.
Fraser, N. 1997. After the family wage: A postindustrial thought experiment, in Crossing Borders. Gender and Citizenship in Transition, edited by B. Hobson and A. M. Berggren. Sweden: Swedish Council for Planning and Coordination of Research, pp. 21-55.
Gustafsson, S. and F. P. Stafford. 1994. Three Regimes of Child Care: The United States, the Netherlands, and Sweden, in
Social Protection versus Economic Flexibility: Is There a Trade-Off? National Bureau of Economic Research, Inc., pp. 333-362.
Hausmann, R., L. D. Tyson, and S. Zahidi. 2006. The Global Gender Gap Report 2006. World Economic Forum: Geneva, Switzerland.
Hochschild, A. R. and A. Machung. 1989. The Second Shift: Working Parents and the Revolution at Home. New York: Viking.
Hofmeister, H., H.-P. Blossfeld and M. Mills. 2006. Globalization, uncertainty and women’s mid-career life courses: a theoretical framework, in Globalization, Uncertainty and Women’s Careers: An International Comparison, edited by H.-P. Blossfeld and H. Hofmeister. Cheltenham, UK/Northampton, USA: Edward Elgar, pp. 3-31.
Hook, J. L. 2010. Gender inequality in the welfare state: Sex segregation in housework, 1965-2003. American Journal of Sociology 115(5): 1480-1523.
Jütting, J. P., C. Morrisson, J. Dayton-Johnson and D. Drechsler. 2008. Measuring gender (in)equality: The OECD gender, institutions and development data base. Journal of Human Development 9(1): 65-86.
_____________________________________________________________________________________________________________________________________________
_____________________________________________________________________________________________________________________________________________ Melinda Mills
Klasen, S. 2006. UNDP’s Gender-related measures: Some conceptual problems and possible solutions. Journal of Human Development 7(2): 243-274.
Kohler, H. P., F. C. Billari and J. A. Ortega. 2002. The emergence of the lowest-low fertility in Europe during the 1990s. Population and Development Review 28: 641-680.
Lesthaeghe, R. and D. J. van de Kaa. 1986. Twee demografische transities? in Bevolking: groei en krimp, edited by D. J. van de Kaa and R. Lesthaeghe. Van Loghum Slaterus, Deventer, pp. 9-24.
Mason, K. Oppenheim. 1997. Gender and demographic change: What do we know? in The Continuing Demographic Transition, edited by G.W. Jones et al. Oxford: Clarendon Press, pp. 158-182.
McDonald, P. 2000a. Gender equity in theories of fertility transition. Population and Development Review 26(3): 427-439.
McDonald, P. 2000b. Gender equality, social institutions and the future of fertility. Journal of Population Research 17(1): 1-16.
McDonald, P. 2006. Low fertility and the state: The efficacy of policy, Population and Development Review 32(3): 485-510.
Mencarini, L. and M.L. Tanturri. 2004. Time use, family role-set and childbearing among Italian working women. Genus 60: 111-137.
Miller Torr, B. M. and S. E. Short. 2004. Second births and the second shift: A research note on gender equity and fertility. Population and Development Review 30: 109-130.
Mills, M. and K. Begall. 2010. Preferences for the sex-composition of children in Europe: A multilevel level examination of its effect on progression to a third child. Population Studies 64: 77-95.
Mills, M., H.-P. Blossfeld and E. Klijzing. 2005. Becoming an Adult in Uncertain Times: A 14-Country Comparison of the Losers of Globalization, in Globalization, Uncertainty and Youth in Society, edited by H.-P. Blossfeld, E. Klijzing, M. Mills and K. Kurz. London: Routledge Advances in Sociology Series, pp. 393-411.
_____________________________________________________________________________________________________________________________________________
_____________________________________________________________________________________________________________________________________________ Gender Roles, Gender (In)equality and Fertility: An Empirical Test of Five Gender Equity Indices
Mills, M., L. Mencarini, M. L. Tanturri and K. Begall. 2008. Gender equity and fertility intentions in Italy and the Netherlands. Demographic Research 18: 1-26.
Mills, M., R. R. Rindfuss, P. McDonald and E. te Velde. 2010. Why people postpone parenthood? Reasons and social policy incentives (unpublished manuscript).
Olah, L. S. 2003. Gendering fertility: Second births in Sweden and Hungary. Population Research and Policy Review 22: 171-200.
Oppenheimer, V.K. 1994. Women’s rising employment and the future of the family in industrial societies. Population and Development Review 20 (2): 293- 342.
Permanyer, I. 2010. The measurement of multidimensional gender inequality: Continuing the debate. Social Indicators Research 95: 181-98.
Plantenga, J., C. Remery, H. Figueiredoand M. Smith. 2009. Towards a European union gender equality index. Journal of European Social Policy 19: 19-33.
Presser, H. B. 1997. Demography, feminism and the science-policy nexus. Population and Development Review 23(2): 295-331.
Puur, A., L. S. Oláh, M. I. Tazi-Preveand J. Dorbritz. 2008. Men's childbearing desires and views of the male role in Europe at the dawn of the 21st century. Demographic Research 19(56): 1883 – 1912.
Rabe-Hesketh, S. and A. Skrondal. 2008. Multilevel and Longitudinal Modeling Using Stata. (Second Edition). College Station, TX: Stata Press.
Rindfuss, R.R. and S. Brauner-Otto. 2008. Institutions and the transition to adulthood: Implications for fertility tempo in low-fertility
settings. Vienna Yearbook of Population Research 2008: 57-87.
Rindfuss, R. R., K. L. Brewster and A. L. Kavee. 1996. Women, work and children: Behavioural and attitudinal change in the United States. Population and Development Review 22(3): 457-482.
_____________________________________________________________________________________________________________________________________________
_____________________________________________________________________________________________________________________________________________ Melinda Mills
Schüler, D. 2006. The uses and misuses of the gender-related
development index and gender empowerment measure: A review of the literature. Journal of Human Development 7(2): 161-181.
Sen, A. 1999. Development as Freedom. New York: Knopf.
Social Watch. 2005. Roars and whispers gender and poverty: Promises versus action. Social Watch: Montevideo.
Social Watch. 2007. Gender Equity Index. http://www.socialwatch.org/
Tazi-Preve, I., D. Bichlbauer and A. Goujon. 2004. Gender trouble and Its impact on fertility intentions. Yearbook of Population Research in Finland 40: 5-24.
United Nations. 2009. Human Development Report. Geneva: UNDP.
van de Kaa, D. J. 1987. Europe’s second demographic transition. Population Bulletin 42(1): 1-59.
Van der Lippe, T., K. Tijdens and E. De Ruijter. 2004. Outsourcing of domestic tasks and time-saving effects. Journal of Family Issues 25: 216-240.
Watkins, S. Cotts. 1993. If all we knew about women was what we read in Demography,what would we know? Demography 30(4): 551-577.
_____________________________________________________________________________________________________________________________________________
_____________________________________________________________________________________________________________________________________________ 473
Gender Roles, Gender (In)equality and Fertility: An Empirical Test of Five Gender Equity Indices
Country GGI GDI GEM GEI EU-GEI
Austria 0.6986 0.934 0.788 0.72 0.52
Belgium 0.7078 0.940 0.850 0.74 0.61
Switzerland 0.6997 0.946 0.660 0.67 –
Czech Republic 0.6712 0.887 0.627 0.69 0.51
Germany 0.7524 0.931 0.831 0.80 0.59
Denmark 0.7462 0.944 0.875 0.79 0.69
Estonia 0.6944 0.944 0.637 0.74 0.55
Spain 0.7319 0.944 0.794 0.77 0.37
Finland 0.7958 0.947 0.887 0.84 0.74
France 0.6520 0.950 0.718 0.64 0.56
United Kingdom 0.7365 0.944 0.783 0.74 0.56
Greece 0.6540 0.922 0.622 0.67 0.26
Hungary 0.6698 0.872 0.569 0.70 0.56
Ireland 0.7335 0.940 0.699 0.69 0.44
Iceland 0.7813 0.962 0.862 0.79 –
Luxembourg 0.6671 0.924 – 0.60 0.53
Netherlands 0.7250 0.951 0.859 0.77 0.65
Norway 0.7994 0.957 0.910 0.83 –
Poland 0.6802 0.867 0.614 0.72 0.53
Portugal 0.6922 0.895 0.692 0.73 0.55
Sweden 0.8133 0.955 0.906 0.89 0.72
Slovenia 0.6745 0.914 0.611 0.72 0.55
Slovakia 0.6757 0.860 0.630 0.70 0.47
Italy 0.6456 0.936 0.693 0.63 0.41
Source: GGI (Hausmann, Tyson, and Zahidi 2006); GGI (United Nations 2009, Table 28); GEM (United Nations 2009, Table 29); GEI (Social Watch 2008);
EU-GEI (Plantenga et al. 2009, Table 5).
Notes: Period of measures from: GGI (2006); GGI/GEM (2007/8); GEI (2007);
EU-GEI (data taken from varying years in early 2000s). – means that country is not included. Appendix Table A1
Summary of Gender Index Values by Country
_____________________________________________________________________________________________________________________________________________
_____________________________________________________________________________________________________________________________________________ 474
Melinda Mills