Research Data in Core Journals in Biology,
Chemistry, Mathematics, and Physics
Ryan P. Womack*
Rutgers University Libraries, Rutgers-The State University of New Jersey, New Brunswick, New Jersey, United States of America
Abstract
This study takes a stratified random sample of articles published in 2014 from the top 10 journals in the disciplines of biology, chemistry, mathematics, and physics, as ranked by impact factor. Sampled articles were examined for their reporting of original data or reuse of prior data, and were coded for whether the data was publicly shared or otherwise made available to readers. Other characteristics such as the sharing of software code used for analysis and use of data citation and DOIs for data were examined. The study finds that data sharing practices are still relatively rare in these disciplines’top journals, but that the disciplines have markedly different practices. Biology top journals share original data at the highest rate, and physics top journals share at the lowest rate. Overall, the study finds that within the top journals, only 13% of articles with original data published in 2014 make the data available to others.
Introduction
Recent years have seen an increased emphasis on the research data used to develop findings in published scholarly articles. Several related concepts have emerged, including data citation, data sharing, reproducibility, data publication, and open data. The current study will provide empirical evidence for the presence or absence of these practices in leading scientific journals in four fundamental disciplines: biology, chemistry, mathematics, and physics. First, these con-cepts are reviewed.
Data citation
Data citation, meaning a direct link or reference to a data source, as distinct from citing an arti-cle that uses data, is increasingly recommended as a way of ensuring the discoverability and reusability of research data supporting published articles [1–3]. Enhanced data citation with machine-actionable links can support a more complex ecosystem of scholarship that makes a wider range of types of publications and discussions available [4]. DataCite (https://www. datacite.org) and other initiatives are encouraging the widespread adoption of digital object identifiers (DOIs) and standard citation practices for data.
PLOS ONE | DOI:10.1371/journal.pone.0143460 December 4, 2015 1 / 22
a11111
OPEN ACCESS
Citation:Womack RP (2015) Research Data in Core Journals in Biology, Chemistry, Mathematics, and Physics. PLoS ONE 10(12): e0143460. doi:10.1371/ journal.pone.0143460
Editor:Pablo Dorta-González, Universidad de Las Palmas de Gran Canaria, SPAIN
Received:August 29, 2015
Accepted:November 4, 2015
Published:December 4, 2015
Copyright:© 2015 Ryan P. Womack. This is an open access article distributed under the terms of the
Creative Commons Attribution License, which permits unrestricted use, distribution, and reproduction in any medium, provided the original author and source are credited.
Data Availability Statement:Spreadsheets containing information on the sampling process, references to all articles sampled and their coding, calculation of the data in the tables above, and R code used to generate samples and graphics have been deposited in openICPSR (http://doi.org/10.3886/ E45052V1).
Funding:The author has no support or funding to report.
Data sharing
The trend towards greater emphasis on data sharing is driven by many influences [5]. Funders of research, including the major US agencies such as the National Science Foundation (NSF) and National Institutes of Health (NIH), are under increasing pressure to demonstrate the impact and relevance of their efforts, and are requiring data sharing in order to ensure trans-parency and reusability in research. Along with prior requirements for grant applicants to sub-mit data management plans, the recent agency responses to the White House’s Office of Science and Technology Policy mandate strong efforts to make research data that results from federal funding publicly available. A compilation of these responses is available athttp:// guides.library.oregonstate.edu/federaloa. Publishers and researchers are also seeking to maxi-mize the visibility, influence, and impact of their research products by extending availability from the written article to the associated data behind the publication. When data is expensive to gather or unique, its preservation and availability to other researchers is essential to encour-age scientific progress. Since virtually all astronomical, climatological, and biological observa-tional data represents a capture of a unique, historical window of time, the amount of data that falls into this category is quite large.
In many disciplines, major repositories have been created to share data that is of common interest to the research community, such as the Protein Data Bank (http://www.rcsb.org/) or the Planetary Data System (https://pds.jpl.nasa.gov/). As one example, Williams describes dis-ciplinary efforts to create data sharing repositories in chemistry [6]. As big science paradigms that use large heterogeneous data sources across large research teams are increasingly impor-tant in scientific research, direct and automated access to underlying research data sets is becoming even more significant, and many of the data repositories have been created to sup-port these needs [7]. The re3data service (http://www.re3data.org) provides a searchable direc-tory of major data repositories.
Also, more and more journals themselves are taking steps to make data available. One nota-ble example is the Public Library of Science (PLoS) policy introduced in 2014, which requires authors to state where the data associated with the research can be accessed [8]. Regulative pressure from journals to make data available, via a data sharing policy or other methods, has been found to strongly influence author behaviors [9].
Scientists are gradually adopting their own data-sharing practices, in spite of challenges [10,
11]. At the same time, some may be reluctant to share data, although this could be related to the weakness of the authors’findings [12]. Attitudes towards sharing may differ by faculty rank [13]. Fecher documents the ongoing structural barriers in attitudes to data sharing and argues for the need to greater incentivize data sharing via recognition and reimbursement [14]. Mak-ing data available only via direct contact with the author, the minimal requirement for most grant-funded research, has been found to be ineffective, while mandated data sharing alongside the published article greatly improves access to data [15]. The“contact the author”method is also associated with rapidly decreasing data availability over time [16].
Librarians also need to keep up with the developments in data sharing in order to support researchers who are adapting to the changing nature of data-driven research [17]. The entire scholarly ecosystem is affected by data sharing.
Reproducibility
Reproducibility involves transparency about research methods and tools used, and is an impor-tant assurance of the reliability of the findings in any single publication.
Data publication
Data publication refers to a more formal process of making data permanently available. The
“data journal”has emerged as one vehicle for recognized data publishing, where data is released with an associated descriptive article. Nature’sScientific Data(http:www.nature.com/sdata/) is a leading example, although repositories such as Dryad (http://datadryad.org) also serve a data publication role by working in partnership with journals to release data alongside articles. Insti-tutional repositories at universities may also play a role in making data available in a reliable and discoverable manner. Data curation initiatives such as the Data Preservation Alliance for the Social Sciences (DATA-PASS) seek to preserve research data which may or may not be linked to article publication, placing emphasis on best practices for the long-term stewardship of the data [19].
While there is a lack of consensus on what constitutes data publication [20], work is ongoing to develop more extensive standards and criteria for data publication associated with journals, to ensure openness and reduce barriers to use [21], and to ensure the long-term stewardship of significant data [22].
Open Data
Open data in the broad sense refers to data that is freely accessible, reusable, and sharable. This involves both public accessibility and usage rights that enable others to work with and build upon the data. The rights issues surrounding open data are an important part of making the data fully open [23]. This study will examine whether data is freely accessible, but does not delve into rights issues. None of the journal websites examined here explicitly describe the rights for available data on their associated download pages. Data sharing and data publication are steps toward fully open data, but may be incomplete without ensuring that the data is well-documented, formatted, and not subject to rights restrictions.
Prior work
While an exhaustive literature review is not presented here, it is important to note a few prior studies of the availability of research data. Recognition of the issues involved in data sharing dates back decades, a notable example being the 1985 Report of the Committee on National Statistics,Sharing Research Data[24], along with discussion of the necessary transition to shar-ing via the Internet [25]. However, these studies did not attempt to directly measure the avail-ability of data via examination of research output, an approach taken by more recent studies.
Nicholson and Bennett examined the availability of data in dissertations in selected disci-plines [26]. They found that although two-thirds of the dissertations sampled had some data component that was made available, none of the dissertations in biology, sociology, mechanical engineering, or education made available the full raw data used to generate the dissertation. This is suggestive of patterns of data sharing that will be further examined in the current study.
the current study. Other studies have examined data sharing in fields such as sociology [28] and genomics [29].
While the trend towards and the benefits of data sharing are clear, particularly for the advancement of statistical science, the process is by no means simple and getting to the goal of greater sharing requires settling many unresolved issues [30].
Methods
Objectives
The goal of the current study is to examine data use, data citation, and data sharing practices in leading journals in key scientific disciplines. Factors affecting reproducibility and openness, such as the free public availability of data and software code are also examined. The fundamen-tal disciplines of biology, chemistry, mathematics, and physics were chosen because of their wide-ranging significance in science. For the purpose of the paper, data is defined as primarily numeric or raw measurement information that can be accessed in machine-actionable form. Since the intended purpose of data sharing is for other researchers to be able to make use of the information in their own work, data intended for illustration and observation only, such as vid-eos, or tables reproduced only in PDF, are not coded as“data”in this study.
By using a fully randomized sampling method, statistically valid estimates of proportions of the variables of interest (such as the proportion of articles using and sharing data) can be gen-erated, along with confidence intervals on the estimates. Treating the four disciplines as sepa-rate strata allows the use of stratified sampling techniques to combine the individual
disciplinary estimates into a more precise estimate for the group of top journals as a whole. The primary emphasis of this study is on understanding the disciplinary patterns among the most influential journals, and does not, for the most part, seek to characterize the practices of individual journals. To study individual journal patterns in more detail would require larger sample sizes and a different approach to sampling. Here, sample sizes are limited due to time constraints on the analysis, and the methodology is chosen to derive useful information from the limited sample size. This study differs from other work in its focus on specific scientific dis-ciplines and its use of statistical sampling techniques to generate more reliable parameter estimates.
Definition of Target Population
The target population are“articles in leading scientific journals”, which are specified as follows. In each of four foundational science disciplines (biology, chemistry, mathematics, and physics), the top 10 journals are ranked according to the 5-year impact factor using the InCites Journal Citation Reports from Thomson Reuters [31].
advantage of being reproducible, not subjective, and applicable across disciplines. The use of a top 10 rather than a selection based on the number of journals in the discipline (such as the top-ranked two or three percent of journals) is arbitrary, but avoids the subjectivity inherent in defining which journals belong to the discipline and which do not. Some of the issues with the journals that result will be discussed later in the paper.
InCites Journal Citation Reports provides two category schema,“Web of Science”and the
“Essential Science Indicators”. Because the Web of Science categories are too fine-grained, we use the“Essential Science Indicators”, which allow us to look at broad categories such as phys-ics, mathematphys-ics, and chemistry. The category used for biology is actually“biology and bio-chemistry”. We use the 5-year impact factor measure to smooth out short-term variations in the impact factor.
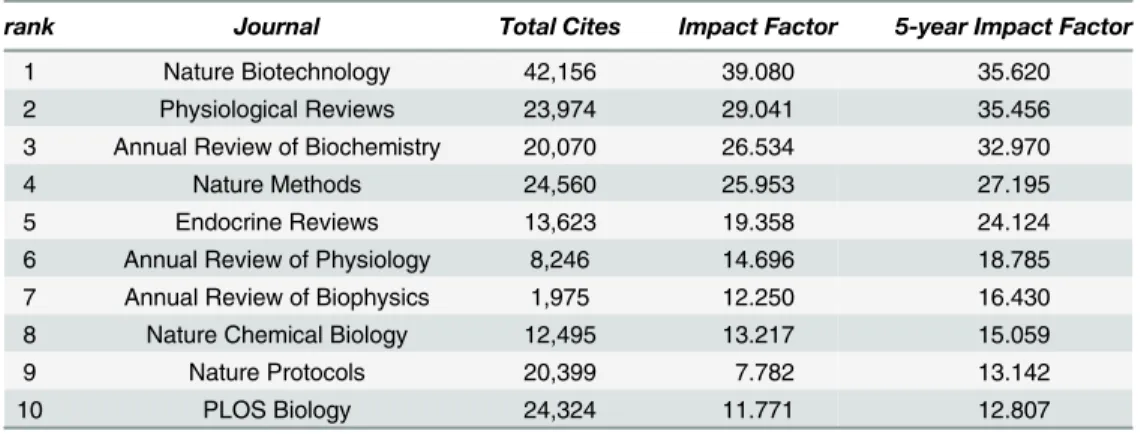
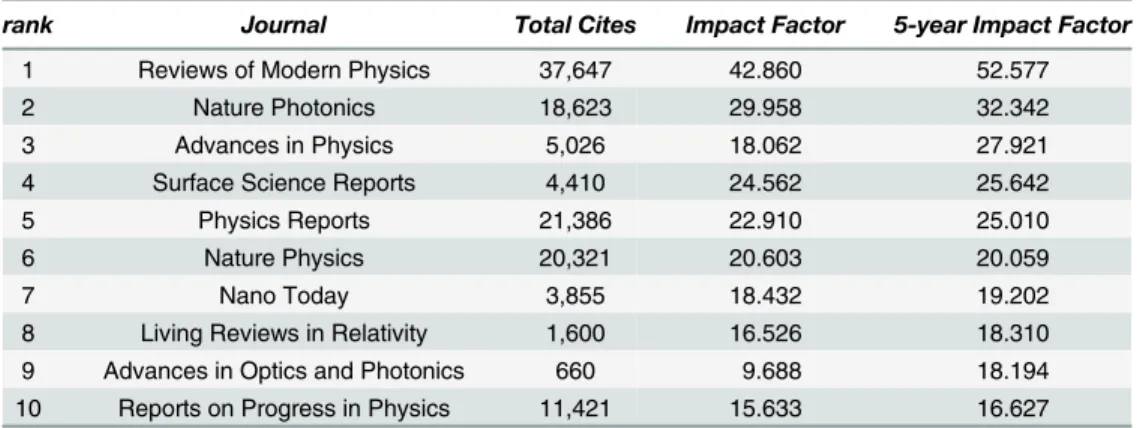
Using the InCites category schema“Essential Science Indicators”, the top 10 journals ranked by the 5-year Impact Factor from Journal Citation Reports using 2013 data (the latest available at the time of the research) are shown in Tables1,2,3and4.
Sampling Methods
The sampling frame consists of all articles published in these 40 journals in 2014, the most recent complete year at the time of research. Selection and review of articles was conducted in
Table 1. Biology top 10 journals by Impact Factor, 2013.
rank Journal Total Cites Impact Factor 5-year Impact Factor
1 Nature Biotechnology 42,156 39.080 35.620
2 Physiological Reviews 23,974 29.041 35.456
3 Annual Review of Biochemistry 20,070 26.534 32.970
4 Nature Methods 24,560 25.953 27.195
5 Endocrine Reviews 13,623 19.358 24.124
6 Annual Review of Physiology 8,246 14.696 18.785
7 Annual Review of Biophysics 1,975 12.250 16.430
8 Nature Chemical Biology 12,495 13.217 15.059
9 Nature Protocols 20,399 7.782 13.142
10 PLOS Biology 24,324 11.771 12.807
doi:10.1371/journal.pone.0143460.t001
Table 2. Chemistry top 10 journals by Impact Factor, 2013.
rank Journal Total Cites Impact Factor 5-year Impact Factor
1 Chemical Reviews 124,463 45.661 48.832
2 Progress in Polymer Science 17,446 26.854 34.000
3 Chemical Society Reviews 63,071 30.425 33.159
4 Accounts of Chemical Research 47,005 24.348 26.002
5 Nature Chemistry 12,440 23.297 24.537
6 Acta Crystallographica Sect. A 12,476 2.069 17.237
7 Annual Review of Physical Chemistry 7,570 15.678 15.500
8 J. of Photochemistry & Photobiology C 2,239 11.625 14.424
9 ACS Nano 58,446 12.033 13.774
10 Aldrichimica Acta 1,066 16.333 13.667
March and April of 2015. Since we also want to assess the different patterns present in each dis-cipline, we stratify by discipline and sample 50 articles for each discipline. The element and sampling unit is the journal article. BIOSIS was used to identify articles from the Biology jour-nals. Web of Science, which covers all of the remaining top journals, was used to generate the remaining three groups of disciplinary listings.
The sample design is a stratified random sample. We stratify by discipline and not by jour-nal, since each journal within the discipline will have different numbers of articles published and different data usage patterns. The intention is to gain an understanding of the overall pat-tern among influential journals in the discipline rather than to evaluate specific journals. This goal is reflected in our sampling method. While other more sophisticated and complex sam-pling schemes could be considered, this study presents no unusual issues in the nature of the data, or the difficulty and cost of conducting the survey, that would warrant a more complex design. In order to evaluate patterns at the journal level or to stratify at the journal level, a larger sample size would be required and a more complex formula to compute variances would be needed. Since this study’s sample size was limited by the time and resources available for the study, analysis beyond the disciplinary level is not feasible.
Table 3. Mathematics top 10 journals by Impact Factor, 2013.
rank Journal Total
Cites
Impact Factor
5-year Impact Factor
1 SIAM Review 5,484 4.791 9.833
2 J. Royal Statistical Society Series B 14,568 5.721 6.016
3 Annals of Statistics 13,953 2.442 4.209
4 Acta Mathematica 3,096 3.033 4.185
5 Appl. and Comp. Harmonic Analysis 2,086 3.000 3.904
6 J. of the American Mathematical Society 2,398 3.061 3.713
7 Annals of Mathematics 8,926 2.822 3.478
8 Foundations of Computational Mathematics 706 2.152 3.423
9 Statistical Science 3,503 1.690 3.411
10 Communications on Pure and Applied Math.
6,904 3.080 3.373
doi:10.1371/journal.pone.0143460.t003
Table 4. Physics top 10 journals by Impact Factor, 2013.
rank Journal Total Cites Impact Factor 5-year Impact Factor
1 Reviews of Modern Physics 37,647 42.860 52.577
2 Nature Photonics 18,623 29.958 32.342
3 Advances in Physics 5,026 18.062 27.921
4 Surface Science Reports 4,410 24.562 25.642
5 Physics Reports 21,386 22.910 25.010
6 Nature Physics 20,321 20.603 20.059
7 Nano Today 3,855 18.432 19.202
8 Living Reviews in Relativity 1,600 16.526 18.310
9 Advances in Optics and Photonics 660 9.688 18.194
10 Reports on Progress in Physics 11,421 15.633 16.627
Using the population size of articles published for each discipline, a random listing of inte-gers up to the maximum population size was generated for each group (using R software). The first 50 numbers in each group’s list were matched to the sequential list of articles generated by the search in the index to identify the articles selected in the sample. This method generates a probability of selection for each journal that is proportional to the number of articles published by the journal in that year. Therefore, journals that publish more articles are more likely to be selected in the sample. Articles were sampled without replacement.
Each article identified by the sampling process was downloaded in PDF form and was also examined on the publisher’s web portal for associated materials.
Measurements
Articles were coded for the following primary characteristics:
• Whether the article contained data or not. If the article contained or used more than a trivial amount of data, it was considered a data article. If there was a reasonable expectation of some reader having a use for the underlying data, it was considered a data paper for the purpose of this article. For example, if a standard mathematical function was plotted using a limited amount of simulated or generated data, this was not considered a data paper, since an inter-ested reader would not need the raw data to perform a similar task. But if a paper contained a mathematical algorithm whose validity was tested via a moderate amount of simulated data, this was considered a data paper, since an interested reader might want to test whether the author’s conclusions were peculiar to the particular data used. This initial coding is intended to reflect the use of data in the research for the article, regardless of how data is presented in the article itself. For example, if experimental data was presented in a graph, with no associ-ated numeric tables or files, this was considered a data paper for the purposes of the study. In most cases the distinction between data papers and non-data papers was obvious.
• If the article contained data,
• Whether the data was original to the article(i.e., generated by the research described in the article), or reused from other sources. If both original and reused data were present, the article was coded as having original data.
• Whether the data was available to the reader, and if so, the method of access (journal, exter-nal site, other) and whether it was freely available or available only to subscribers. This study considers direct access to the data via links to be available data, and considers“ con-tact the author”instructions as data that is not available.
• Whether the article was a review article. Review articles had distinctive characteristics that will be described later.
• Whether a DOI or other citation method was provided linking directly to the data, as distinct from the DOI or citation provided to the article itself.
Articles by Discipline
The selection procedure for articles is described in more detail in this section. The focus on the individual disciplines of biology, chemistry, mathematics, and physics, results in the exclusion of highly influential cross-disciplinary journals such asCell,Nature, andSciencefrom the sam-ple. Also, a number of the high-impact journals in each discipline are review journals, which naturally have different characteristics since they are surveying existing research rather than reporting original findings.
One of the biology journals in the top 10 by impact factor,Nature Protocols, was not indexed by BIOSIS, so the author identified these 219 articles published in 2014 as a separate list appended to the list generated by BIOSIS for the purpose of the random sample. In other disciplines, the Web of Science index was able to generate a complete listing of all articles pub-lished in the journals in 2014. In retrospect, it would have been possible to use Web of Science to generate all of the biology sample, but the sample had already been collected via the supple-mented BIOSIS list described above.
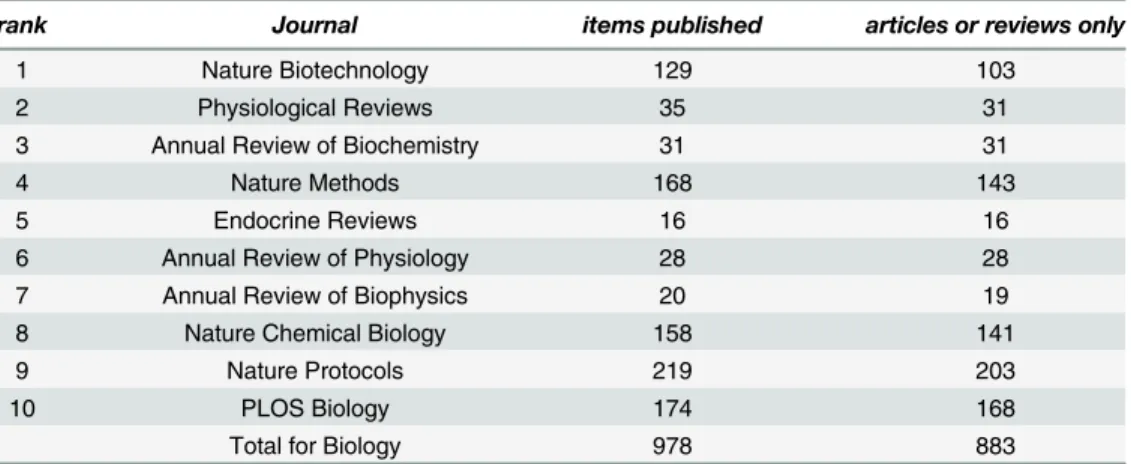
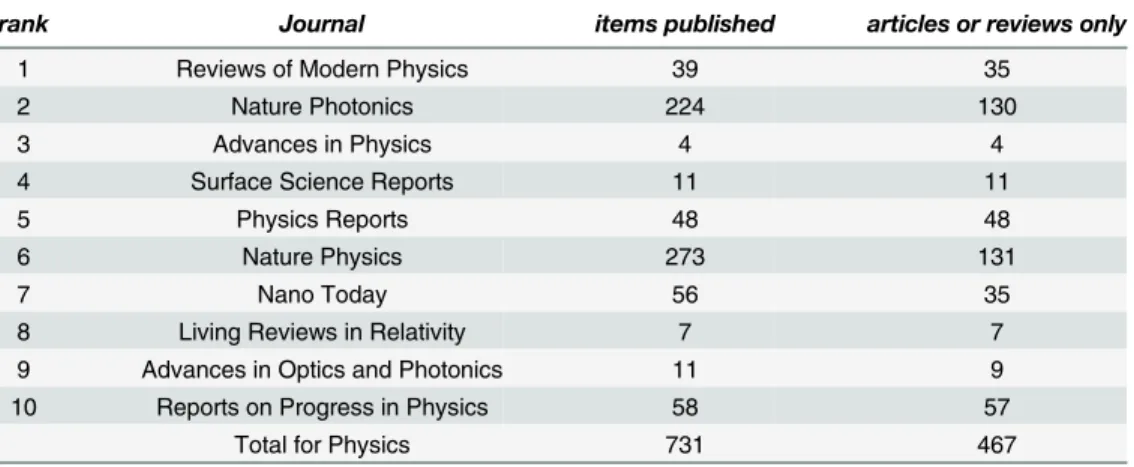
Categories of publication such as“addendum”,“corrigendum”,“editorial”,“news”,“ correc-tion”,“retraction”, and so on were excluded from consideration. Only items tagged by the index as“articles”,“reviews”, or, in the case ofNature Protocols,“protocols”, were considered part of the final sampling frame. The resulting numbers of articles are listed in Tables5,6,7
and8.
The population sizes of substantive articles and reviews published in 2014 for each disci-pline are Biology, 883; Chemistry, 2,606; Mathematics, 414; Physics, 467. Our total population of articles and reviews is therefore 4,370. We can see that within each discipline there are some journals that only publish a few articles a year, notably among the review journals, while some
journals publish many more.ACS Nanodominates the chemistry sample with 50.9% of the
articles. In fact,ACS Nanoaccounts for 30.4% of the entire population of articles in the
sam-pling frame. When combined,Nature PhotonoicsandNature Physicsaccount for 55.9% of the
physics sample. The fourNaturetitles, along withPLoS Biology, lead the biology sample in numbers of articles. Mathematics is more balanced, althoughAnnals of Statisticsleads in num-ber of articles. It is important to keep these patterns in mind when interpreting the results, which only provide an overall picture of the top journals. The results do not portray the data availability at the journal level, only an estimate of the typical article published in the set of top journals.
Table 5. Biology article counts, 2014.
rank Journal items published articles or reviews only
1 Nature Biotechnology 129 103
2 Physiological Reviews 35 31
3 Annual Review of Biochemistry 31 31
4 Nature Methods 168 143
5 Endocrine Reviews 16 16
6 Annual Review of Physiology 28 28
7 Annual Review of Biophysics 20 19
8 Nature Chemical Biology 158 141
9 Nature Protocols 219 203
10 PLOS Biology 174 168
Total for Biology 978 883
Table 6. Chemistry article counts, 2014.
rank Journal items published articles or reviews only
1 Chemical Reviews 294 281
2 Progress in Polymer Science 67 64
3 Chemical Society Reviews 399 380
4 Accounts of Chemical Research 359 353
5 Nature Chemistry 256 133
6 Acta Crystallographica Sect. A 15 14
7 Annual Review of Physical Chemistry 28 27
8 J. of Photochemistry & Photobiology C 22 20
9 ACS Nano 1382 1328
10 Aldrichimica Acta 6 6
Total for Chemistry 2828 2606
doi:10.1371/journal.pone.0143460.t006
Table 7. Mathematics article counts, 2014.
rank Journal items published articles or reviews only
1 SIAM Review 26 19
2 J. Royal Statistical Society Series B 39 38
3 Annals of Statistics 92 83
4 Acta Mathematica 15 15
5 Appl. and Comp. Harmonic Analysis 59 59
6 J. of the American Mathematical Society 26 26
7 Annals of Mathematics 46 46
8 Foundations of Computational Mathematics 39 38
9 Statistical Science 62 44
10 Communications on Pure and Applied Math. 49 46
Total for Mathematics 453 414
doi:10.1371/journal.pone.0143460.t007
Table 8. Physics article counts, 2014.
rank Journal items published articles or reviews only
1 Reviews of Modern Physics 39 35
2 Nature Photonics 224 130
3 Advances in Physics 4 4
4 Surface Science Reports 11 11
5 Physics Reports 48 48
6 Nature Physics 273 131
7 Nano Today 56 35
8 Living Reviews in Relativity 7 7
9 Advances in Optics and Photonics 11 9
10 Reports on Progress in Physics 58 57
Total for Physics 731 467
Results
We are primarily interested in the proportions of articles in several categories, so within each disciplinary category, we estimate the overall proportion by the sample proportion inEq (1):
^
p¼
Pn i¼1yi
n ð1Þ
whereyi= 1 if the characteristic of interest is present,Nis the population total (number of
arti-cles published in the top 10 disciplinary journals in 2014), andnis the sample size (50 for each of the four disciplines). Sampling formulae and methods used in this article follow Lohr’s Sam-pling: Design and Analysis[33]. The variance is then estimated by using the estimate of the pro-portion, according toEq (2):
^
Vð^pÞ ¼ 1 n
N
^pð1 ^pÞ
n 1 ð2Þ
The component 1 n
N
is thefinite population correction, orfpc, and accounts for the reduction in variance caused by sampling without replacement and shrinking the remaining pool of articles to be sampled from.
To show an example of a specific calculation, in physics, the sample proportion of articles with data is44
50¼0:88:For physics, the fpc is computed by 1 50 467
¼0:893, and the variance
of the estimate of the proportion of articles with data is computed as
^
Vdata¼0:893
0:880:12
49 ¼0:00192. The standard error of the estimate is given by the square
root of the variance,SE^data¼
ffiffiffiffiffiffiffiffiffiffiffiffiffiffiffiffi 0:00192
p
¼0:0439. A 95% confidence interval is given by ^
pdata2:01 ^
SEdata, where 2.01 is the.975 quantile for a t-distribution with 49 degress of
free-dom (t.975,49= 2.01). We use the t-distribution in preference to the normal approximation
because the sample size is relatively small. In the case of physics, the 95% confidence interval of the estimate of the proportion of all articles (in the top 10 journals) with data is 0.88 ± 0.088, or (0.792, 0.968).
Proportion Estimates
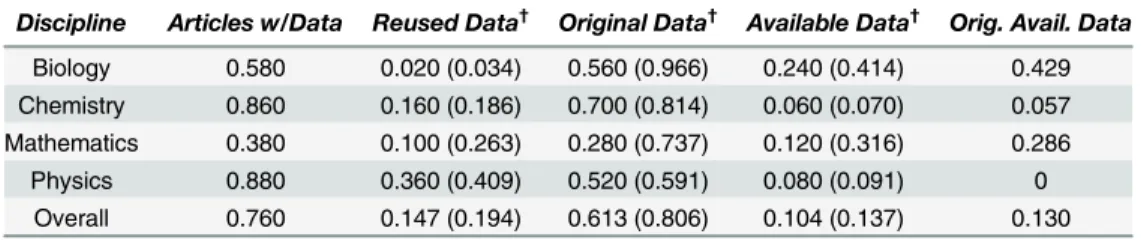
Table 9shows the proportion estimates by discipline and overall for the following parameters: the proportion of articles with data, the proportion of articles that reuse other data sources, the proportion of articles with original data, the proportion of articles that make their data avail-able, and the proportion of articles with original data that make the data available. The method of computing the overall stratified sample estimates is discussed later. The numbers reported
Table 9. Sample proportions/estimates of population proportions (n = 50 for each discipline, N = 200 overall).
Discipline Articles w/Data Reused Data† Original Data† Available Data† Orig. Avail. Data
Biology 0.580 0.020 (0.034) 0.560 (0.966) 0.240 (0.414) 0.429 Chemistry 0.860 0.160 (0.186) 0.700 (0.814) 0.060 (0.070) 0.057 Mathematics 0.380 0.100 (0.263) 0.280 (0.737) 0.120 (0.316) 0.286 Physics 0.880 0.360 (0.409) 0.520 (0.591) 0.080 (0.091) 0
Overall 0.760 0.147 (0.194) 0.613 (0.806) 0.104 (0.137) 0.130 †
expressed as proportion of all articles (proportion of data articles in parentheses)
in parentheses are the proportions recomputed by dividing by the number of articles with data, not the total sample size. We are not only interested in the absolute proportions of the data cat-egories, but in the characteristics of articles with data. It is more important for original research data to be made available than reused data, since the reused data is presumably already avail-able from an alternative source. So, the proportion of original data articles that make their data available is perhaps the most important indicator of data sharing by discipline.
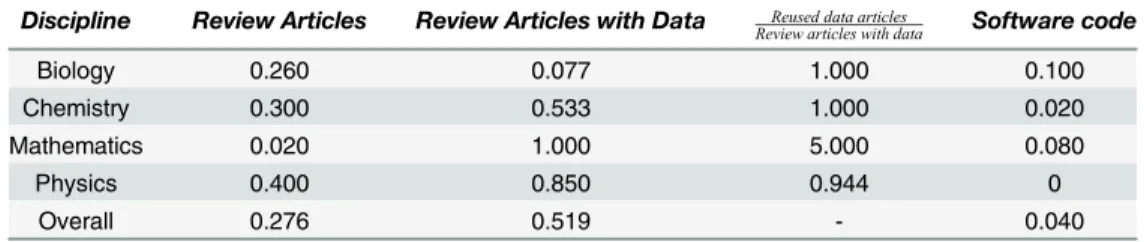
Table 10reports additional parameters of interest: the proportion of review articles, the pro-portion of review articles with data, a ratio of the reused data articles to review articles with data, and the proportion of articles providing software code. The ratio of reused data articles to review articles with data reflects the fact that in three of the disciplines, the review articles were the major source of reused data. Only in mathematics were there several articles that reused data in the service of an original research project, as reflected by the ratio being larger than one. Also, mathematics is the one discipline with few review articles among its high-impact publica-tions. This ratio is not computed for the overall population of articles, since it is not meaningful outside of the disciplinary context. The number and function of review articles differ dramati-cally by discipline.
It will be noted that no estimate of the proportion of articles with DOIs or other data cita-tion is provided in the tables. This is becausenoneof the articles examined cited data separately or provided unique identifiers. In a few journals, supplementary data files could be accessed by using the article’s DOI in combination with a postpended location marker, but this is not con-sidered as full data citation according to the ideals of those promoting enhanced data citation. The percentage of articles made available by means other than the journal website is also not reported in the tables. The number of cases in which this occurred was small, and will be noted in the individual disciplinary discussions in the section on Disciplinary Differences.
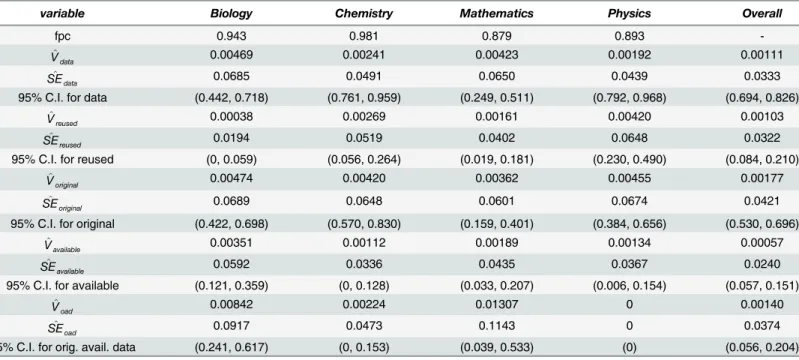
Estimates of Variance and Standard Error
The variance estimates, standard error estimates, and 95% confidence intervals on the popula-tion parameters are provided inTable 11. These are reported for articles with data (V^data,
^
SEdata), articles with reused data ( ^
Vreused, ^
SEreused), articles with original data ( ^
Voriginal, ^
SEoriginal),
articles with available data (V^available, ^
SEavailable), and for the proportion of original data articles
that make the data available (V^oad, ^
SEoad). We do not compute these estimates for the secondary
proportions inTable 10partially because these sample sizes and proportions are too small for the confidence intervals to be of interest.
Most of the variances and confidence intervals are computed usingEq (2), as described above.
In order to compute the variance and confidence interval for the proportion of original data articles that make the data available, we must use a slightly different procedure, since the
Table 10. Sample proportions for additional variables.
Discipline Review Articles Review Articles with Data Reused data articles
Review articles with data Software code
Biology 0.260 0.077 1.000 0.100
Chemistry 0.300 0.533 1.000 0.020
Mathematics 0.020 1.000 5.000 0.080
Physics 0.400 0.850 0.944 0
Overall 0.276 0.519 - 0.040
population sizes of articles with original data are themselves random variables. We use the technique of ratio estimation within population domains, where the domains are articles with data and articles without data. We computes2
oadas the sample variance with the following
for-mula, whereSdatais the set of articles with original data,yiis the indicator variable for available
data, and^p
dataandndataare as before.
s2
oad¼ P
i2Sdataðyi
^
pdataÞ
2
ndata 1
ð3Þ
Using this sample variance, we can computeV^
oadwith the following formula:
^
Voad¼ 1
n N
n
n2
data
ðndata 1Þs
2
oad
n 1 ð4Þ
To illustrate with the numerical example of biology,s2
oadis
12ð1 ð3=7ÞÞ2þ16ð0 ð3=7ÞÞ2
27 ¼:254, and
^
Voad¼0:943
50 282ð
27Þ:254
49 ¼0:084. We uset.975,27= 2.05, so the 95% confidence interval is slightly
wider. The t-statistic used varies according to each discipline’s sample size of articles with data (Chemistry,t.975,34= 2.03; Mathematics,t.975,13= 2.16; Physics,t.975,25= 2.06; and for the
over-all,t.975,102= 1.98). However, wefind that in most cases adjusting for the proportion within a
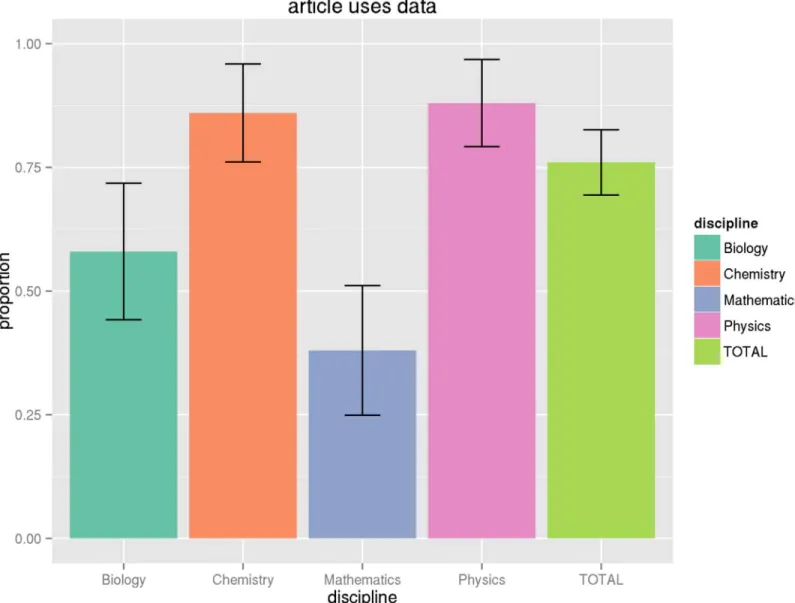
domain does not greatly increase the variance, so we will not repeat this exercise for all of the proportions in parentheses reported inTable 9. See the Figures at the end of the article for graphical illustrations of the proportions and their associated 95% confidence intervals (Figs1,
2,3,4and5).
Table 11. Estimates of variance, standard error, and confidence intervals.
variable Biology Chemistry Mathematics Physics Overall
fpc 0.943 0.981 0.879 0.893
-^
Vdata 0.00469 0.00241 0.00423 0.00192 0.00111
^
SEdata 0.0685 0.0491 0.0650 0.0439 0.0333
95% C.I. for data (0.442, 0.718) (0.761, 0.959) (0.249, 0.511) (0.792, 0.968) (0.694, 0.826)
^
Vreused 0.00038 0.00269 0.00161 0.00420 0.00103
^
SEreused 0.0194 0.0519 0.0402 0.0648 0.0322
95% C.I. for reused (0, 0.059) (0.056, 0.264) (0.019, 0.181) (0.230, 0.490) (0.084, 0.210)
^
Voriginal 0.00474 0.00420 0.00362 0.00455 0.00177
^
SEoriginal 0.0689 0.0648 0.0601 0.0674 0.0421
95% C.I. for original (0.422, 0.698) (0.570, 0.830) (0.159, 0.401) (0.384, 0.656) (0.530, 0.696)
^
Vavailable 0.00351 0.00112 0.00189 0.00134 0.00057
^
SEavailable 0.0592 0.0336 0.0435 0.0367 0.0240
95% C.I. for available (0.121, 0.359) (0, 0.128) (0.033, 0.207) (0.006, 0.154) (0.057, 0.151)
^
Voad 0.00842 0.00224 0.01307 0 0.00140
^
SEoad 0.0917 0.0473 0.1143 0 0.0374
95% C.I. for orig. avail. data (0.241, 0.617) (0, 0.153) (0.039, 0.533) (0) (0.056, 0.204)
Disciplinary Differences
Biology. Biology top journals use data frequently, and data when used is almost always
original to the article. However, only 42.9% of articles with original data make that data avail-able. This is the highest rate among the four disciplines, but it is still far from a universal culture of data sharing. In fact, many of the articles examined provide only a few downloadable tables of data, so the estimate of 42.9% overstates the reality that far fewer articles make the complete research data package available.
Biology journals provide a variety of other data outputs. In the sample of 50 articles, five vid-eos are available, and five articles make software code freely available (10% of the total). Biology is the only discipline to make widespread use of official external repositories for data sharing,
Fig 1. Proportion of articles using data.This graph shows the proportion of articles by discipline that make some use of data as part of the research, along with the confidence interval of this estimate for the general population, based on the sample size. See Tables9and11for numeric values.
with the Protein Data Bank (6 articles) (http://rscb.org), ProteomeXchange (2 articles) (http:// www.proteomexchange.org), and Sequence Read Archive (2 articles) (http://www.ncbi.nlm. nih.gov/sra) represented. Five make use of figshare as integrated into the publisher’s website (http://figshare.com) to make tabular data downloadable. Additionally, 11 articles provide sup-plementary data only in PDF form, which were not counted as data since it is not in a form directly usable by another researcher. Only one article made data available through the author’s website.
Chemistry. In chemistry top journals, review articles use data about half of the time, but
this is below the rate of data use for regular chemistry articles. Some review articles just sum-marize theory and stylized facts. Overall, 70% of articles use original data, the highest rate of the four disciplines. In fact, all of the sampled non-review articles use data, and all of that data
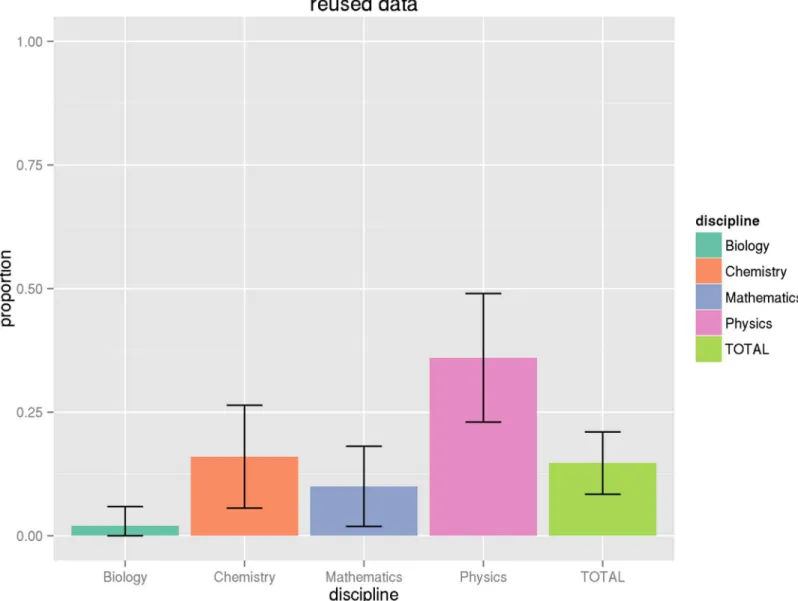
Fig 2. Proportion of articles with only reused data.This graph shows the proportion of articles with reused data, that is data taken from other studies and not original to the article in question, along with associated confidence intervals. See Tables9and11for numeric values.
is original. In terms of classification, if an article merely pictured a molecule, for example, it was not counted as a data article, but if a corpus of images was analyzed for patterns, it would be considered a data article. Some articles in chemistry presented images and graphics without supporting data alongside tables that summarized numerical chemical properties such as boil-ing point, molecular weight. These were considered articles with available data, although only part of the research data associated with the article was being shared.
Three articles of the 50 sampled articles made video available, and 16 articles put data into PDF formats, which did not count towards data availability. One of the articles contained soft-ware code that was reproduced only in PDF format, but was publicly available. Overall, chemis-try articles made available only 5.7% of original data. Even considering the confidence interval, an upper bound on this estimate of data sharing is only 15.3%. So, in spite of the widespread use of data in top chemistry journals, the data is for the most part not made available. There
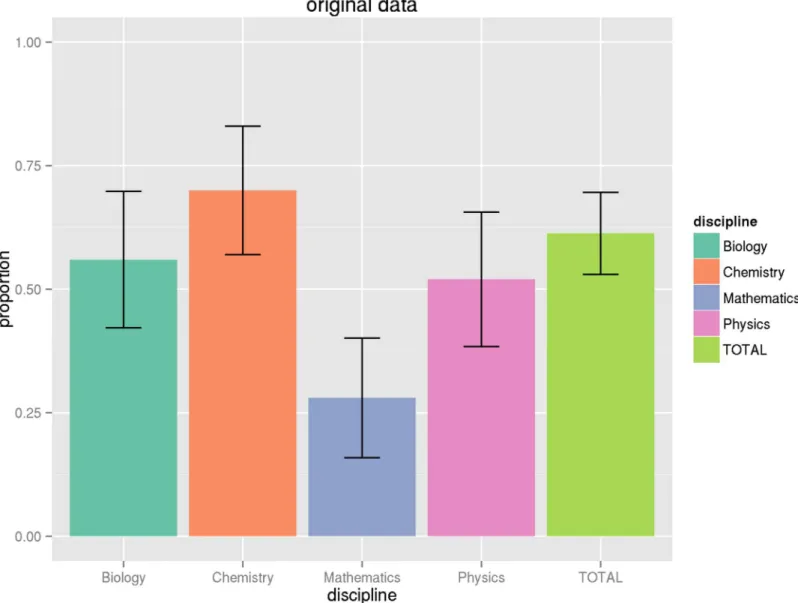
Fig 3. Proportion of articles with original data.This graph shows the proportion of articles by discipline with original data generated by the research described in the article, along with associated confidence intervals. See Tables9and11for numeric values.
are many graphs that visually summarize experimental results, but the underlying data tends not to be shared.
Mathematics. Many of the high-impact journals in mathematics report primarily
theoreti-cal results. The top 10 journals also include journals of mathematitheoreti-cal statistics that may use data to illustrate applications of the methods developed in the article. While only 28% of all articles contained original data, 73.7% of the data articles used original data. The availability of data to readers was second highest of the four disciplines at 31.6%. In the sample of 50 articles, of the six articles with available data, four made the data freely available, while two kept the data behind the journal’s paywall. Two of the articles with freely available data used external websites to share the data. All of the 8% of articles that provided software code made the code freely available. Only one of the articles was a review article, a very different pattern than the other disciplines.
Fig 4. Proportion of articles that share data.This graph shows the proportion of all articles by discipline that share data, making it available to the reader via any indicated mechanism, along with associated confidence intervals. See Tables9and11for numeric values.
Several papers use simulated or synthetic data to illustrate functions and concepts. If these formed a substantial part of the argument of the paper, they were coded as data papers. The reasoning was that it would be desirable for a reader to access the data that these arguments were based on, so they could verify the results or test other theories with it. Since the number of math articles with data is relatively small, the estimate for the proportion of data articles that make the data available has a wide variance. The upper bound of the confidence interval on the percentage of papers that make data available is still only 53.3%.
Physics. The articles in the top ten physics journals are more likely to use data compared
to the other three disciplines, with 88% of the articles using some data. Physics articles reuse other previously published data at a higher rate than the other disciplines, but the majority of articles still contain original data. Despite the prevalance of data, only 8% of the physics articles
Fig 5. Proportion of original data articles that share data.This graph shows the proportion of articles by discipline that share data, among articles with original research data, along with associated confidence intervals. See Tables9and11for numeric values.
make data available, and of these four articles, only one has freely available data. The other three have data behind the paywall, only available to journal subscribers. By comparison, Mathematics has two articles with data behind the paywall, and Chemistry and Biology have one each. One of these paywalled articles has only a small portion of the data the article is based on available for download. None of these articles with available data were original research articles, so there is no data sharing in the area of greatest interest.
Two of the 50 articles sampled contain videos, but these are not the primary data sources for the articles. Three articles reproduced tables in PDF format only. As in chemistry journals, physics articles print many graphics that summarize the research data, but do not provide direct access to the underlying data. None of the sampled articles used links to outside websites or repositories, nor was any software code made available. In general, physics does little to share research data in a systematic way, at least in the top journals by impact factor.
Combined stratified estimates
In order to obtain overall statistics on the data sharing practices in these four core science disci-plines, we will combine the disciplinary estimates into one overall estimate using the tech-niques of stratified random sampling.
To estimate the overall proportions for articles for each variable under consideration, we will use the disciplinary estimates as our strata proportions,^p
h. We weight these estimates by
the article counts for each of the four strata, and useformula (5)to estimate the overall propor-tion,^p
str. In the equations below,nhrefer to the strata sample size, andNhrefers to the strata
population, here the total number of articles published in the discipline. Weighting the strata proportions by the number of articles in the discipline is in this case equivalent to other com-mon technique of applying weights at the article level prior to averaging. Here we use the fol-lowing formula:
^
pstr¼ XH
h¼1 Nh
N
^
ph ð5Þ
As a numerical example, to compute the proportion of articles with data, we useN= 883 + 2606 + 414 + 467 = 4370, and so^p
str¼
883 43700:58þ
2606 43700:86þ
414 43700:38þ
467
43700:88¼0:76.
Table 9reports the combined estimates of proportions in theOverallcolumn. When combining strata, the variance is estimated by usingEq (6).
^
Vstrðp^strÞ ¼ XH
h¼1
1 nh
Nh
N
h
N
2^p
hð1 p^hÞ
nh 1
ð6Þ
Note that within each strata, this equation is the same as the variance reported for individual disciplines inTable 11, multiplied by Nh
N 2
. The confidence interval multiplies the standard error by the t-distribution critical value withn−Hdegrees of freedom, or 200-4 = 196 degrees of
free-dom in this case (t.975,196= 1.97).Table 11reports the combined variance and standard error
esti-mates in theOverallcolumn, along with the 95% confidence intervals they generate on the proportion estimates. As with the individual disciplines, the estimate of the variance for overall original available data is computed using ratio estimation within a domain usingEq (4). See the Supplementary Information for the spreadsheet containing this calculation. In this case, the con-fidence interval is based on a t-statistic of 1.98 on 102 degrees of freedom (t.975,102= 1.98).
61.3% generate original data (80.6% of the data articles), but only 10.4% of articles make data available. Only 13% of articles with original data make at least some of that data available in machine-actionable form to the reader. This 13% rate is not very different from the 9% found by Alsheikh-Ali et. al. [27], suggesting only slow progress in the growth of data sharing.
Discussion
It is important to keep in mind what this study demonstrates and where its limits lie. It is a sta-tistically valid portrait of a set of the top 40 journals in four disciplines as ranked by impact fac-tor. The combined estimates describe the total population at the article level. To illustrate, if we put all articles (and reviews) published by these 40 journals in 2014 into a pile and randomly selected one, our expectation that it would use data is 76%, that it would have data available would be 10.4%, and so on. The confidence intervals as constructed are valid when applied to this population, but cannot be easily generalized to other contexts. This study is suggestive about data sharing practices in these disciplines as a whole, if we believe that the high-impact factor journals are influential and lead the disciplines’scholarly practices. Ultimately, however, this study provides no information on the data sharing behavior in the vast majority of journals in these disciplines, and of course no information at all on other disciplines. It does, however, allow direct comparisons among the four disciplines, something not done in prior work.
The presence and behavior of review articles, primarily appearing in the leading review jour-nals, is another issue. These articles do not use original, newly generated research data, but most often describe and draw on the data from many prior studies to establish their summary views. While it would also be desirable if this data was well-cited and shared, it is of greater importance for ongoing research that the truly novel data in original articles be shared at the time of its creation. Future studies may wish to exclude review journals or consider them as an entirely separate category.
Data availability policies are another factor which may influence data sharing behaviors. All Naturejournals require authors“to make materials, data, code and associated protocols promptly avaialable to readers without undue qualifications”(http://www.nature.com/authors/ policies/availability.html). Among the 40 journals in this study, this includesNature Biotech-nology, Nature Chemical Biology, Nature Chemistry, Nature Methods, Nature Photonics, and Nature Physics.Nature Protocolsdoes not really ask for data due to the nature of the protocols described.Naturealso encourages parallel publication of significant data sets in the journal Sci-entific Data.
Other journals that ask that data be made available arePhysiological Reviews, Journal of the Royal Statistical Society Series B (Statistical Methodology), andACS Nano.PLOS Biology imple-mented its data availability policy (http://journals.plos.org/plosbiology/s/data-availability) on March 3, 2014.
Despite the presence or phasing in of these policies, the availability of data has not grown much in the top journals. However, this is an area deserving of more detailed study to deter-mine how many articles are compliant with policy and how influential these policies have been. The present study was not designed with those goals in mind, so it is only suggestive on this topic.
resource] without providing any precision on the location of the data, date of access, compo-nents of the data used, or any other detail. Sharing of software code is also rare, inhibiting reproducibility of results.
Data sharing itself is not prevalent at all in the top physics and chemistry journals. There is more data sharing in the top journals in mathematics and biology, but even here it is not as widespread as could be hoped. The most conservative statement that can be made, by taking the maximum upper bound of the 95% confidence interval on the proportion estimates, is that not more than 61.7% of biology articles in the top 10 journals that use data take any steps to make the data available to readers. This is in the case of biology, but the estimates in other dis-ciplines are far lower. This“upper bound”on data sharing is only 20.4% across all top 40 jour-nals. Also, these upper bounds overstate the extent of data sharing in an important way, since many articles qualified as sharing data when only a small portion of tabular data was available for download. Very few articles in any discipline included links to the kind of large-scale origi-nal raw data envisioned by data sharing advocates. This is similar to the findings of Nicholson and Bennett, referenced earlier, that none of the dissertations in their sample provided com-plete original datasets [26]. The large bundle of raw data is rarely found in the top 40 high-impact journals, at least in 2014 in biology, chemistry, mathematics, and physics. Federal man-dates for data sharing may increase these rates in the future, but as of 2014 this impact was not being felt yet.
One hypothesis is that greater data sharing and citation may be occurring at less highly-ranked journals that are more fluid in their practices. Journals that focus on publishing a high volume of relevant results rather than selectivity may also behave differently, although even journals created with an emphasis on openness such asPLoS Biologydo not yet exhibit advanced data sharing behaviors. Regardless of these potential explanations, the current study provides clear evidence on the practices in the top 40 journals sampled.
The confidence intervals on the proportion estimates are not narrow, given the small sample sizes within each discipline. In spite of this, most of the confidence intervals are widely sepa-rated and often do not overlap at all. So we can use the estimates inTable 11to make unambig-uous and reliable statements such as“chemistry articles use data more often than mathematics articles”and“biology data articles share their data more often than physics data articles”, with the caveat that we are always discussing articles appearing in the top 10 high-impact journals in each discipline. We should also remember that the results are heavily influenced by the jour-nals with a high volume of articles, such asACS Nano. The other caveat we should keep in mind is that this study is based on 2014 articles only, and that earlier or later time periods may have different patterns. With these caveats noted, the differing proportions and confidence intervals are clear evidence of disciplinary differences in data sharing behavior.
It is important to keep in mind the limitations of this study and the nature of its design. Due to time and resource constraints, only a limited number of articles could be sampled and stud-ied closely for the presence of data. This sample size is sufficient to draw some conclusions about the disciplinary differences among the top journals as discussed above, and there is noa priorireason to think that the sample is biased or unrepresentative of the disciplines. However, those with more discipline-specific knowledge may wish to see more detail about specific jour-nals or to ensure their balanced representation if particular jourjour-nals are known to have differ-ent patterns. For example, given the dominant role of the high volume ofACS Nanoarticles, it would be good to know chemists’opinions of whether this journal is typical or atypical of data-sharing patterns, and whether it makes sense to weight it in proportion to the number of arti-cles published.
cost of some complexity in sample design and computation. It would also be interesting to make comparisons over time by sampling several years of articles.
In that sense, the current study could be viewed as an exploratory study establishing some initial findings that could be refined by further work. By relying on objective criteria for sample construction and methodology, however, this study does provide a factual baseline for other potential studies using expert judgment to refine the sampling and population to be studied.
This research could be extended in several different ways. The confidence intervals are pro-portional to the square root of the sample size, so if one wanted to double the precision of the estimates, a sample of four times the size could be constructed. The same sampling techniques could be applied to other disciplines such as engineering and medicine, or to a wider range of journals, or used to provide more detailed estimates at the level of the individual journal, by using the journals as strata as indicated above. Those more familiar with disciplinary practices may delve more deeply into the individual disciplines of biology, chemistry, mathematics, and physics to reveal and explain more of the reasons behind the data citation practices observed.
Acknowledgments
The author wishes to thank Laura Mullen and Joseph Naus of Rutgers University, as well as two anonymous reviewers and the editor, for their valuable feedback on earlier versions of this manuscript.
Author Contributions
Conceived and designed the experiments: RW. Performed the experiments: RW. Analyzed the data: RW. Contributed reagents/materials/analysis tools: RW. Wrote the paper: RW.
References
1. Altman M, Crosas M. The Evolution of Data Citation: From Principles to Implementation. IASSIST Quar-terly. 2013; 37(1–4): 62–70. url:http://www.iassistdata.org/downloads/iqvol371_4_altman.pdf 2. Hourclé JA. Advancing the Practice of Data Citation: A To-Do List. Bulletin of the American Society for
Information Science & Technology. 2012; 38(5): 20–22. doi:10.1002/bult.2012.1720380507 3. Mooney H. A Practical Approach to Data Citation: The Special Interest Group on Data Citation and
Development of the Quick Guide to Data Citation. IASSIST Quarterly. 2014; 37(1–4): 71–73. url:http:// iassistdata.org/downloads/iqvol371_4_mooney.pdf
4. Mons B, van Haagen H, Chicester C, Hoen P, den Dunnen JT, van Ommen G, et al. The value of data. Nature Genetics. 2011; 43(4): 281–283. doi:10.1038/ng0411-281PMID:21445068
5. Borgman CL. The conundrum of sharing research data. Journal of the American Society for Information Science & Technology. 2012; 63(6): 1059–1078. doi:10.1002/asi.22634
6. Williams A, Tkachenko V. The Royal Society of Chemistry and the delivery of chemistry data reposito-ries for the community. Journal of Computer-aided Molecular Design. 2014; 28(10): 1023–1030. doi: 10.1007/s10822-014-9784-5PMID:25086851
7. Light R, Polley D, Börner K. Open data and open code for big science of science studies. Sciento-metrics. 2014; 101(2): 1535–1551. doi:10.1007/s11192-014-1238-2
8. Ganley E. PLOS data policy: Catalyst for a better research process. College & Research Libraries News. 2014; 75(6): 305–308. url:http://crln.acrl.org/content/75/6/305.full
9. Kim Y, Stanton JM. Institutional and Individual Factors Affecting Scientists’Data-Sharing Behaviors: A Multilevel Analysis. Journal of the American Society for Information Science and Technology. 2015. doi:10.1002/asi.23424
10. Douglass K, Allard S, Tenopir C, Wu L, Frame M. Managing scientific data as public assets: Data shar-ing practices and policies among full-time government employees. Journal of the Association for Infor-mation Science & Technology. 2014; 65(2): 251–262. doi:10.1002/asi.22988
12. Wicherts JM, Bakker M, Molenaar D. Willingness to Share Research Data Is Related to the Strength of the Evidence and the Quality of Reporting of Statistical Results. PLoS One. 2011; 6(11). doi:10.1371/ journal.pone.0026828PMID:22073203
13. Akers KG, Doty J. Differences among Faculty Ranks in Views on Research Data Management. IAS-SIST Quarterly. 2012; 36(2): 16–20. url:http://www.iassistdata.org/downloads/iqvol36_2_doty_0.pdf 14. Fecher B, Friesike S, Hebing M. What Drives Academic Data Sharing?. PLoS ONE. 2015; 10(2). doi:
10.1371/journal.pone.0118053PMID:25714752
15. Vines TH, Andrew RL, Bock DG, Franklin MT, Gilbert KJ, Kane NC, et al. Mandated data archiving greatly improves access to research data. FASEB Journal. 2013; 27(4): 1304–1308. doi:10.1096/fj. 12-218164PMID:23288929
16. Vines TH, Albert AYK, Andrew RL, Débarre F, Bock DG, Franklin MT, et al. The Availability of Research Data Declines Rapidly with Article Age. Current Biology. 2014; 24(24): 94–97. doi:10.1016/j.cub.2013. 11.014PMID:24361065
17. MacMillan D. Data Sharing and Discovery: What Librarians Need to Know. Journal of Academic Librari-anship. 2014; 40(5): 541–549. doi:10.1016/j.acalib.2014.06.011
18. Hayden EC. Rules rewrite aims to clean up scientific software. Nature. 2015; 520: 276–277. doi:10. 1038/520276a
19. Altman M, Adams M, Crabtree J, Donakowski D, Maynard M, et. al. Digital Preservation Through Archi-val Collaboration: The Data Preservation Alliance for the Social Sciences. The American Archivst. 2009; 72(1): 170–184. url:http://www.jstor.org/stable/40294601doi:10.17723/aarc.72.1. eu7252lhnrp7h188
20. Kratz JE, Strasser C. Researcher Perspectives on Publication and Peer Review of Data. PLoS ONE. 2015; 10(2). doi:10.1371/journal.pone.0117619
21. Moles N. Data-PE: a framework for evaluating data publication policies at scholarly journals. Data Sci-ence Journal. 2014; 13: 192–202. doi:10.2481/dsj.14-047
22. Peng G, Privette J, Kearns E, Ritchey N, Ansari S. A unified framework for measuring stewardship prac-tices applied to digital environmental datasets. Data Science Journal. 2014; 13: 231–253. doi:10. 2481/dsj.14-049
23. Murray-Rust P. Open Data in Science. Serials Review. 2008; 34(1): 52–64. doi:10.1080/00987913. 2008.10765152
24. Fienberg SE, Martin ME, Straf ML, editors. Sharing Research Data. Washington, DC: National Acad-emy Press; 1985. url:http://www.nap.edu/catalog/2033.html
25. Rockwell RC. An Integrated Network Interface Between the Researcher and Social Science Data Resources: In Search of a Practical Vision. Social Science Computer Review. 1994; 12(2): 202–214. doi:10.1177/089443939401200205
26. Nicholson SW, Bennett TB. Data Sharing: Academic Libraries and the Scholarly Enterprise. portal: Libraries & the Academy. 2011; 11(1): 505–516. url:http://muse.jhu.edu/journals/portal_libraries_and_ the_academy/v011/11.1.nicholson.html
27. Alsheikh-Ali AA, Qureshi W, Al-Mallah MH, Ioannidis JPA. Public Availability of Published Research Data in High-Impact Journals. PLoS ONE. 2011; 6(9). doi:10.1371/journal.pone.0024357PMID: 21915316
28. Zenk-Möltgen W, Lepthien G. Data sharing in sociology journals. Online Information Review. 2014; 38 (6): 709–722. doi:10.1108/OIR-05-2014-0119
29. Piwowar HA. Who Shares? Who Doesn’t? Factors Associated with Openly Archiving Raw Research Data. PLoS ONE. 2011; 6(7): 1–13. doi:10.1371/journal.pone.0018657
30. Sedransk N, Young LJ, Kelner KL, Moffitt RA, Thakar A, Raddick J, et al. Make research data public?–
Not always so simple: A dialogue for statisticians and science editors. Statistical Science. 2010; 25(1): 41–50. doi:10.1214/10-STS320
31. InCites Journal Citation Reports [Internet]. Thomson Reuters. Available from https://jcr-incites-thomsonreuters-com
32. Varin C, Cattelan M, Firth D. Statistical Modelling of citation exchange between statistics journals [pre-print]. Journal of the Royal Statistical Society A. 2016; 179(1): 1–33. url:http://www.rss.org.uk/Images/ PDF/publications/rss-preprint-varin-may-2015.pdf