A Data Mining view on Class Room Teaching Language
Umesh Kumar Pandey1, S. Pal2
1
Research Scholar,
Singhania University, Jhunjhunu, Rajasthan, India
2
Dept. of MCA, VBS Purvanchal University Jaunpur – 222001, Uttar Pradesh, India
Abstract
From ancient period in India, educational institution embarked to use class room teaching. Where a teacher explains the material and students understand and learn the lesson. There is no absolute scale for measuring knowledge but examination score is one scale which shows the performance indicator of students. So it is important that appropriate material is taught but it is vital that while teaching which language is chosen, class notes must be prepared and attendance. This study analyses the impact of language on the presence of students in class room. The main idea is to find out the support, confidence and interestingness level for appropriate language and attendance in the classroom. For this purpose association rule is used.
Keywords:Data mining, Association rule, KDD
1. Introduction
Higher education has attained a key position in the knowledge society under globalize economy [12].
Students’ academic performance hinges on diverse factors like personal, socio-economic, psychological and other environmental variables. The prediction of students with high accuracy is beneficial to identify the students with low academic achievement [14].
Data mining involves many different tasks. So it is a complex process but it has a high degree of accuracy [9]. An association rule data mining model identifies specific types of data association. Association rule mining finds all rules that satisfy some minimum support and confidence constraint that it is the target of on mining is not predetermined [4].
Before the globalization most of the education program run in Hindi or in regional language. But after the globalization of Indian economy several professional courses started in English language. Students are bound to study these courses in English language. The real problem arises in the classroom i.e. which language a teacher must use to communicate knowledge to student because in a day long students converses in Hindi or any other regional language.
In this paper it is tried to find out the association of language and attendance.
2. Background and related work
Due to high accuracy and prediction quality data mining technique is widely used in different areas. Education sector is also enriched with the help of this technique. A number of journal and literature are available containing educational data mining. Few of them are listed below for reference.
Merceron A et al. concluded that association technique requires not only that adequate thresholds be chosen for the two standard parameters of support and confidence, but also that appropriate measures of interestingness be considered to retain meaning rules that filter uninteresting ness ones out[10].
Tan P N, kumar V and srivastava J proposed that many measures provide conflicting information provide the interestingness of a pattern and the best metric to use for a given application domain is rarely known. They made a comparative study on all interestingness measures and present a small set of table such that an expert can select a desirable measure [16].
Merceron A et al. investigated the interestingness of the association rules found in the data to look for mistakes often made together while solving an exercise, and found strong rules associating three specific mistakes [11]. Oladipupo O.O. and Oyelade O.J. study has bridge the gap in educational data analysis and shows the potential of the association rule mining algorithm for enhancing the effectiveness of academic planners and level advisers in higher institutions of learning [13].
Pandey U. K. and Pal S. conducted study on the student performance based by selecting 600 students from different colleges of Dr. R. M. L. Awadh University, Faizabad, India. By means of Bayes Classification on category, language and background qualification, it was found that whether new comer students will performer or not [19].
Bray conducted a comparative study to find out private tutoring percentage in different countries. He revealed that India has highest percentage of student’s compare to Malaysia, Singapore, Japan, China and Sri Lanka [3]. Al Raddaideh et al. applied, decision tree model to predict the final grade of students, who studied the C++ course [1].
3. Data Mining
The research in database and information technology has given rise to an approach to store and manipulate these data for further decision making [2]
Data mining is often set in the broader context of knowledge discovery in database or KDD. The KDD process involves several stages: selecting the target, processing data, transforming them if necessary, performing data mining to extract pattern and relationship and then interpreting and assessing the discovered structures [5].
Han and kamber describes data mining software that allows the users to analyze data from different dimensions and categorize it [6].
Higher education institutions face lack of deep and adequate knowledge which is root cause for low achievement of defined quality objectives. This gap can be bridged by using data mining technique. It will fill up the gaps found in educational environment.
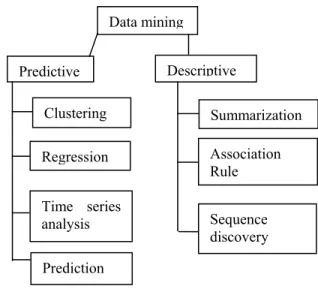
Dunham [9] categorized various models and tasks of data mining into two groups: predictive and descriptive. Figure 1 shows most commonly used data mining models and tasks:
Figure 1: Data Mining Models
4. Association rule
One of the popular descriptive data mining is association rule owing to its extensive use in marketing and retail communities in addition to many other diverse fields [18]. Association rule mining is one of the important technique which aims at extracting, interesting correlation, frequent patterns, associations or casual structures among set of items in the transaction databases or other data mining repositories [17].
Association rules are used to show the relationships between item sets. An association rule is accompanied with two measures support and confidence. These terms can be defined as:
Association rule: Given a set of items I={ I1,I2,….Im} and a database of transaction D={t1,t2,….tn} where ti=(Ii1,Ii2,………Iik} and IijI, an association rule is an implication of the form XY where X,Y I are sets of items called item sets and XY= [9].
It is a fact that strong association rules are not necessarily interesting [16]. Following table has list of interestingness measures for association rule:
Data mining
Predictive Descriptive
Clustering
Regression
Time series analysis
Prediction
Summarization
Association Rule
Figure 2 interestingness measures for association pattern [16]
5. Data mining techniques used in this paper
Support: The support (s) for an association rule XY is the percentage of transaction that contain XY [9].
Confidence: The confidence or strength () for an association rule XY is the ratio of the number of transaction that contain X [9].
Cosine: Consider two vectors X and Y and the angle they form when they are placed so that their tails coincide. When this angle nears 0°, then cosine nears 1, i.e. the two vectors are very similar: all their coordinates are pair wise the same (or proportional). When this angle is 90°, the two vectors are perpendicular, the most dissimilar, and cosine is 0.
)
(
*
)
(
)
,
(
)
(
sin
Y
P
X
P
Y
X
P
Y
X
e
Co
The usual form that is given for cosine of an association rule is X, Y. The closer cosine (XY) is to 1, the more
transactions containing item X also contain item Y, and vice versa. On the contrary, the closer cosine (XY) is to 0, the more transactions contain item X without containing item Y, and vice versa. This equality shows that transactions not containing neither item X nor item Y have no influence on the result of Cosine (XY). This is known as the null-invariant property. Note also that cosine is a symmetric measure [10, 11].
Added value: The added value of the rule X→Y is denoted by AV (X Y) and measures whether the proportion of transactions containing Y among the transactions containing X is greater than the proportion of transactions containing Y among all transactions. Then, only if the probability of finding item Y when item X has been found is greater than the probability of finding item Y at all can we say that X and Y are associated and that X implies Y.
)
(
)
(
)
(
X
Y
conf
X
Y
P
Y
AV
A positive number indicates that X and Y are related, while a negative number means that the occurrence of X prevents Y from occurring. Added Value is closely related to another well-known measure of interest, the lift [10].
Lift:
)
(
)
(
)
(
Y
P
Y
X
conf
Y
X
Lift
An equivalent definition is:
)
(
*
)
(
)
,
(
Y
P
X
P
Y
X
P
. Lift is a
symmetric measure. A lift well above 1 indicates a strong correlation between X and Y. A lift around 1 says that P(X, Y) = P(X)*P(Y). In terms of probability, this means that the occurrence of X and the occurrence of Y in the same transaction are independent events, hence X and Y not correlated. It is easy to show that the lift is 1 exactly when added value is 0; the lift is greater than 1 exactly when added value is positive and the lift is below 1 exactly when added value is negative [10, 11].
Correlation:
)
(
1
(
*
)
(
1
(
*
)
(
*
)
(
)
(
*
)
(
)
,
(
Y
P
X
P
Y
P
X
P
Y
P
X
P
Y
X
P
n
Correlatio
around 1, correlation can still be significantly different from 0 [11].
Conviction:
))
(
1
(
)
(
1
(
)
(
Y
X
conf
Y
P
Y
X
Conviction
Conviction is not a symmetric measure. A conviction around 1 says that X and Y are independent; while conviction is infinite as conf (X→Y) is tending to 1. Note that if P(Y) is high, 1 − P(Y) is small. In that case, even if conf(X, Y) is strong, conviction (XY) may be small [10].
6. Application
In this study data gathered from a degree college named PSRIET, Ranjeetpur Chilbila Pratapgarh, UP, affiliated with Dr. RMLA University, Faizabad, India from the period august 2010 to January 2011. These data are analyzed using Association rule to find the interestingness of student in opting class teaching language. In order to apply this following steps are performed in sequence:
6.1 Data set: The data set used in this study was obtained from a degree college of computer science department of course PGDCA of session 2010-11. Initial size of the data is 60.
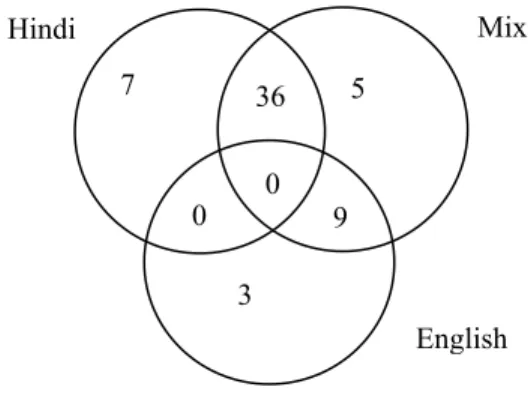
6.2 Data selection and transformation: In this step data selected from various table to extract the information. College organized the classes in three different languages to attract the student that is Hindi, English, and Mix. Hindi medium class contains 80 percent of the lecture in local language and 20 percent English. English medium class contains more than 90 percent in English. Mix medium class contains English and Hindi in almost equal ratio. Class notes provided in each class only English medium. As the course is available in only English medium college tried to find out the student interestingness in opting classroom teaching language. Following Venn diagram (fig. 3) shows the complete attendance picture of student in different medium class.
Figure 3: attendance in different medium of classes
So, college tried to find out the student interestingness of class teaching language. In this sequence college focused on the attendance register. It identified that there is some common interest in the student. On the basis of available attendance college prepared the support of each language. Following table 1 shows the support level for each language. It describes that he mix medium class had higher percentage of support. Most of the students participate in this classroom. Lowest percentage of support is for English medium class.
Table 1: Support analysis
Class medium Support
Hindi 0.70 English 0.20 Mix (Hindi & English) 0.83
{Hindi, Mix} 0.60
(English, Mix) 0.15
6.3 Result and analysis: In this step data selected from various table to extract the information.
Table 2 describes that the most of the students (85.7%) who attend the Hindi medium class also joins the mix medium class because it has highest confidence. 72% of mix medium class students also join the Hindi medium class. 75 % of English medium class students also join the Mix medium class. Only 18 % of mix medium class students joins English medium.
Table 2: Confidence analysis
Association Confidence
HindiMix 0.857
Mix Hindi 0.720
EnglishMix 0.750
Mix English 0.180
Table 3 shows the cosine analysis valve. It is a symmetric analysis. It means two sets give same results in either
Hindi Mix
English
7 36 5
0 9 0
direction. In this research paper it shows the angular value between two different medium of class. Table shows that Hindi and Mix medium class has lower angle (38.216) in comparison to English and Mix medium. It can be concluded as the Hindi and Mix medium class has more similarity of student than the English and Mix medium class.
Table 3: Cosine analysis
Association Cosine Angle
HindiMix 0.786 38.210
Mix Hindi 0.786 38.210
EnglishMix 0.367 68.416
Mix English 0.367 68.416
Table 4 shows the added value analysis. In this table HindiMix and Mix Hindi has positive number which shows that they are related to each other. Occurrence of Hindi does not prevent Mix from occurring similarly occurrence of Mix does not prevent Hindi from occurring. EnglishMix and Mix English has negative number which shows that the occurrence of English prevents occurring of Mix similarly occurrence of Mix prevents occurrence of English.
Table 4: Added value analysis
Association Added value
HindiMix 0.024
Mix Hindi 0.020
EnglishMix -0.083
Mix English -0.020
Table 5 contains lift analysis. It is a symmetric analysis. It shows the occurrence of one item to another item. In this table HindiMix and MixHindi relation has similar positive value (1.029) grater than 1 which shows that occurrence of first is strongly correlated with the other. In the case of EnglishMix and Mix English, it has also same positive value but less than 1 which shows that they are negatively correlated.
Table 5: Lift analysis
Association Lift
HindiMix 1.029
Mix Hindi 1.029
EnglishMix 0.900
Mix English 0.900
Table 6 contains correlation value. In this table HindiMix and MixHindi has similar positive value and EnglishMix and Mix English has similar negative value because it is a symmetric measurement. This table shows that is positively correlated whereas EnglishMix and Mix English is negatively correlated to each other.
Table 6: Correlation analysis Association Correlation(efficient)
HindiMix 0.098 Mix Hindi 0.098 EnglishMix -0.112 Mix English -0.112
Table 7 shows conviction analysis. It shows that highest conviction is found in the association of HindiMix medium class with value 1.167. Lowest conviction is found in association of EnglishMix with value 0.667.
Table 7: Conviction analysis
Association Conviction
HindiMix 1.167
Mix Hindi 1.071
EnglishMix 0.667
Mix English 0.976
7. Conclusions
Association rules are useful to find the association between two elements and shows interestingness between them. In this paper seven different interestingness parameters are used to find the interestingness between two different medium of class. From the above analysis it can be concluded that the Mix medium class is more preferred over Hindi and English medium class. Another conclusion is extracted from confidence, cosine, AV analysis, lift, correlation and conviction analysis is that most of the Hindi medium class students are showing their interest towards Mix medium class as well as English medium class students also has greater interest in Mix medium class. So college has to organize a Mix medium class to keep attendance at high point.
References
[1] Al-Radaiedh O A, A;-Shawakfa E M and Al-najjar M I, “Mining student data using Decision tree.”, International Arab Conference on information technology (ACIT 2006), Yarmouk University, Jordan, 2006.
[2] Bharati S., Ramagaeri, “Data Mining Technique and Application”, IJCSE vol 1 no.4 301-305.
[3] Bray M, “The Shadow education system: private tutoring and its implications for planners (2nd edition) UNESCO, PARIS France.
[4] Cristobal Romero, Sebastian Ventura Ekaterina vasilyeva and Mykola pechenizkiy, “Class asoociation rule mining from students’ test data.
[5] David Hand, heikki Mannila, Padhraic smyth, “Principles of Data Mining”, PHI, ISBN 978-81-203-2457-2.
[6] Han J and Kamber M 2006, “Data Mining: concepts and techniques”, 2nd edition. The Morgan Kaufmann series in database management syste, Jim Gray series editor. [7] Hijazi S T and Naqvi R S M M, “ Factors affecting
[8] Krüger A, Merceron A and Wolf B, “When Data Exploration and Data Mining meet while Analyzing Usage Data of a Course”,
[9] Margret H Dunham, “Data Mining Introductory and Advanced Topics”, Pearson education ISBN 978-81-7758-785-2.
[10] Merceron A and Yacef K, “Interestingness Measures for Association Rules in Educational Data”,
[11 ]Merceron A, Yacef K, “Revisiting interestingness of strong symmetric association rules in educational data”, Proceedings of the International Workshop on Applying Data Mining in e-Learning 2007.
[12] Mithilesh kumar, “Challenges of globalization on Indian Higher education”.
[13] Oladipupo O.O., Oyelade O.J., “ Knowledge Discovery from students’ Result repository: association rule mining approach”, IJCSS Vol 4: issue 2.
[14] Ramaswami M and Bhaskaran R, “A CHAID Based performance Prediction model in Educational Data Mining”, IJCSI Vol. 7 issue no. 1 January 2010. ISSN 1694-0784.
[15]Suthn G P Baboo S., “Hybrid CHAID a key for MUSTAS Framework in Educational Data Mining”, IJCSI Vol 8 issue 1 January 2011.
[16] Tan P N, Kumar V Srivastav J., “Selecting the right interestingness measure for association pattern”, 8th ACM SIGKDD International Conference on KDD 2001 san Francisco USA 67-76.
[17] V.Umarani, Dr. M. Punithavalli, “Sampling based Association Rules Mining- A Recent Overview” , (IJCSE) International Journal on Computer Science and Engineering Vol. 02, No. 02, 2010, 314-318
[18] V.Umarani, Dr.M.Punithavalli, “A STUDY ON EFFECTIVE MINING OF ASSOCIATION RULES FROM HUGE DATABASES”, IJCSR International Journal of Computer Science and Research, Vol. 1 Issue 1, 2010 ISSN : 2210-9668
[19] U. K. Pandey, S. Pal, “Data Mining: A prediction of performer or underperformer using classification”, (IJCSIT) International Journal of Computer Science and Information Technology, Vol. 2(2), 2011, 686-690, ISSN:0975-9646.
Umesh Kumar Pandey is Assistant Professor in the
Department of Computer Applications, PSRIET, Pratapgarh, India. He obtained his M.C.A degree from IGNOU (2004) and M.Phil. in Computer Science from PRIST University, Tamilnadu. He is currently doing research in Data Mining and Knowledge Discovery from Singhaniya University, Rajasthan.
Saurabh Pal received his M.Sc. (Computer Science) from
Allahabad University, UP, India (1996) and obtained his Ph.D. in
![Figure 2 interestingness measures for association pattern [16]](https://thumb-eu.123doks.com/thumbv2/123dok_br/16329110.188059/3.918.85.451.101.652/figure-interestingness-measures-association-pattern.webp)