Mesencephalon and Neuronal Primary Cultures
Dario Greco1*, Floriana Volpicelli2, Antonio Di Lieto3, Damiana Leo2¤, Carla Perrone-Capano2,4, Petri Auvinen1, Umberto di Porzio2
1Institute of Biotechnology, University of Helsinki, Helsinki, Finland,2Institute of Genetics and Biophysics, CNR, Naples, Italy,3Neuroscience Center, University of Helsinki, Helsinki, Finland,4University of Naples ‘‘Federico II’’, Naples, Italy
Abstract
In the mammalian central nervous system (CNS) an important contingent of dopaminergic neurons are localized in the substantia nigra and in the ventral tegmental area of the ventral midbrain. They constitute an anatomically and functionally heterogeneous group of cells involved in a variety of regulatory mechanisms, from locomotion to emotional/motivational behavior. Midbrain dopaminergic neuron (mDA) primary cultures represent a useful tool to study molecular mechanisms involved in their development and maintenance. Considerable information has been gathered on the mDA neurons development and maturationin vivo, as well as on the molecular features of mDA primary cultures. Here we investigated in
detail the gene expression differences between the tissue of origin and ventral midbrain primary cultures enriched in mDA neurons, using microarray technique. We integrated the results based on different re-annotations of the microarray probes. By using knowledge-based gene network techniques and promoter sequence analysis, we also uncovered mechanisms that might regulate the expression of CNS genes involved in the definition of the identity of specific cell types in the ventral midbrain. We integrate bioinformatics and functional genomics, together with developmental neurobiology. Moreover, we propose guidelines for the computational analysis of microarray gene expression data. Our findings help to clarify some molecular aspects of the development and differentiation of DA neurons within the midbrain.
Citation:Greco D, Volpicelli F, Di Lieto A, Leo D, Perrone-Capano C, et al. (2009) Comparison of Gene Expression Profile in Embryonic Mesencephalon and Neuronal Primary Cultures. PLoS ONE 4(3): e4977. doi:10.1371/journal.pone.0004977
Editor:Arto Urtti, University of Helsinki, Finland
ReceivedAugust 2, 2008;AcceptedFebruary 26, 2009;PublishedMarch 23, 2009
Copyright:ß2009 Greco et al. This is an open-access article distributed under the terms of the Creative Commons Attribution License, which permits unrestricted use, distribution, and reproduction in any medium, provided the original author and source are credited.
Funding:This study has been funded by the Institute of Biotechnology, University of Helsinki (Finland) and by COFIN MIUR/PRIN 2007 (Italy). Dario Greco was funded by the Suomen Kulttuurirahasto (Finland) and by the Ehrnrooth Foundation (Finland). Damiana Leo was recipient of a FEBS summer fellowship. The funders had no role in study design, data collection and analysis, decision to publish, or preparation of the manuscript.
Competing Interests:The authors have declared that no competing interests exist. * E-mail: dario.greco@helsinki.fi
¤ Current address: Department of Pharmacology, Faculty of Medicine, University of Montreal, Montreal, Canada
Introduction
In the mammalian brain, dopaminergic (DA) neurons are mainly located in the ventral midbrain (mesencephalon, Mes) in which they are arranged in three distinct nuclei: substantia nigra (SN, A10), the ventral tegmental area (VTA, A9) and the retrorubral formation (A8). Neurons originating in the SN project abundantly to the dorsolateral striatum, forming the nigrostriatal pathway. DA neurons of the VTA project mainly to the ventromedial striatum, nucleus accumbens and frontal lobe, forming the mesocorticolimbic pathway. Although midbrain dopamine neurons (mDA) are relatively few (20000–40000 in the rodent), they play an important role in regulating several aspects of basic brain function. Alterations of development or survival, or impairment in DA signalling are involved in a variety of behavioural, movement, and psychiatric disorders. Specifically, nigrostriatal pathway has been implicated in Parkinson disease [1] and Huntington disease [2], as well as in drug abuse toxicity [3]. Instead, alterations in VTA outputs are involved in schizophrenia[4], depression [5], attention deficit hyperactive disorder [6] and addiction [7].
Analyses of mouse mutants defective in mDA development have highlighted several transcription factors contributing the specifi-cation of the neurotransmitter identity [8–10], as well as neuronal
identity and maintenance [11,12]. The molecular environment surrounding the mDA neurons plays an important role for their differentiation. Cooperative signalling by Sonic Hedgehog (SHH) from the floor plate and fibroblast growth factor (FGF) 8 from the isthmus induces mDA [13–16].
The mDA neuronal primary cultures represent a valuable tool to investigate the molecular mechanisms involved in the development and maintenance of these neurons. The expanded mDA cultures are generated from E11.5 rat ventral Mes, when a large number of mDA precursors are present [17]. Previously, we have demonstrated that the addition of the FGF 2 (also known as basic FGF) from the beginning of the culture in serum-free medium induces neuroblasts proliferation [18,19]. Furthermore mDA differentiation is increased in the culture treated with SHH and FGF8. Asin vivo, alsoin vitro these factors are the inductive signals that specify mDA phenotype [14,19,20]. Markers of differentiated mDA neurons are observed in primary cultures when FGF2, SHH and FGF8 are withdrawn after six daysin vitro (DIV) and ascorbic acid is added. Particularly, TH immunostain-ings show a high number of mDA neurons. In fact at this time in vitro, the number of TH+cells is increased about 20 folds when
serum plated at a 20-fold higher cell concentration [21,22]. These expanded cultures also show the presence of both neuroblasts, as shown by nestin-immunoreactivity, as well as more mature neurons. At least 90% of the expanded cells are nestin-positive, and at least 70% are medium neurofilament-positive (NFM). Thus there is a co-localization of nestin and NFM in at least 30% of the cells. Cells expressing glial markers, such as the glial fibrillary acid protein (GFAP), are extremely rare (on average one or two GFAP-positive cells/well at 9 DIV) [19,23]. Glutamatergic and GABAergic neurons are also present, as indicated by the levels of the glutamic acid decarboxylases (GAD65, GAD67 and EP10) and glutamate transporter (EAAT1) mRNAs. Instead serotonergic and noradrenergic neurons are absent, as indicated by lack of 5HT (serotonine transporter, SERT and tryptophan hydroxylase, TrpH) and NE (noradrenaline transporter, NET) markers, respectively [23]. In these cultures, mDA neurons are well differentiated since all molecular mDA markers, such as tyrosine hydroxilase (TH), (Dat), Nr4a2 (also known as Nurr1), and vesicular monoamine transporter 2 (Vmat-2), tyrosine kinase receptor Ret (Ret), GDNF family receptor alpha 1–2 (GFRalpha 1–2) are expressed [17]. Moreover, they also show mature functional signature since high affinity uptake, a marker of mature DA function, is present at 9 DIV. The latter is specific since it is blocked in the presence of selective dopamine uptake inhibitors but not by serotonergic and noradrenergic uptake inhibitors [23]. However, there is a lack of general picture concerning the global gene expression program of these cultures as compared to the tissue of origin.
We have carried out extensive gene expression survey of rat E11.5 mesencephalon (MesE11) and Mes primary culturesPC (MesPC) at 9 DIV generated from it. For this, a microarray experiment using the Affymetrix GeneChips RAE230A has been carried out. Because of the inaccuracies in the original annotation, we have performed the computational analysis by re-annotating all the probes present on the RAE230A chipset according to three major sequence databases, such as Entrez Gene [24], RefSeq [25], and Ensembl gene [26]. The results have been then combined in order to create a robust set of result for further analysis. Finally, by using computational techniques of gene networks and promoter sequence analysis, we have uncovered possible regulatory modules responsible for the expression of multiple genes both in MesE11 and MesPC.
Results
In order to characterize the expanded mesencephalic neuronal primary cultures and their expression profiling, as well as to identify new genes involved in mDA neurons differentiation and maturation, we performed the microarray analysis. To fulfill our aim we used three independent re-annotation systems based on the alignment of each oligonucleotide probe present on the RAE230A chipset against the Entrez Gene (EG), RefSeq (RS), and Ensembl
gene (ENS) databases. Based on the new identities for probes we performed three independent analyses abbreviated from now on as EG, RS, and ENS. According to the original annotation released by the manufacturer, the RAE230A chipset contains 15923 probe sets; after re-annotation the probes were re-arranged in 8676 (EG), 13224 (RS), and 7600 (ENS) probe sets. After moderated t-test, we obtained 1016 genes in EG (11.7% of all the screened genes), 1568 (9.8% of all the screened genes) genes in RS, and 862 (11.3% of all the screened genes) genes in ENS to be differentially expressed between MesE11 and MesPC with p-value,0.001 (Table 1). We annotated the gene lists using DAVID which is a gene-centered database where gene entities from several databases are uniquely stored [27]. We took advantage of this system for parsing the gene lists from the three analyses. As many as 987 genes from EG, 1038 genes in RS, and 567 genes in ENS respectively had a reliable DAVID identifier. Of these, 425 unique genes were shared between the three annotations (Figure 1). The RefSeq-based set showed the largest overlapping with the other two annotation systems. From the set of 425 common genes, 268 genes were upregulated in MesPC, and 157 were upregulated in MesE11 (Table S1). Functional classification of these groups of genes was carried out with the DAVID-based Fisher’s exact test. Overall, the three annotations produced very consistent fold change estimation for all of the 425 common genes (average standard deviation = 0.04).
Genes upregulated in midbrain neuronal expanded cultures
Five functional categories were dominating among the 268 genes over-expressed in MesPC: developmental process (95 genes), lipid metabolic process (34 genes), mitochondrion (29 genes), extracellular matrix (22 genes), and lysosome (15 genes). Additionally, neurogenesis (16 genes) and neuron differentiation (14 genes) were also significantly over-represented. Interestingly, 10 genes coding for collagens were among this group of genes with high fold change (Table S2).
Microarrays are capable to observe changes in the expression of transcripts providing no explanation on how this is modulated within the cells. Gene transcription is also regulated by proteins that recognize short DNA sequence motifs, called transcription factor binding sites (TFBSs). TFBSs are in most cases located in the promoter regions of the genes. Similar TFBSs patterns within the promoters of transcripts are expressed in the same tissue under similar conditions. Thus, the organization of promoter motifs represents a framework of the regulatory mechanisms in a specific biological context. The smallest entities on the level of TFBSs combinations are called promoter modules. These are defined as two or more individual elements that act coordinately and are similarly arranged in the promoters of co-regulated transcripts.
We investigated the interactions of the MesPC genes based on the PubMed co-citation and the presence of TFBS in their promoter sequences. From this analysis, a number of genes
Table 1.Summary of the statistical analysis.
EG RS ENS
Total genes analyzed (a) 8676 13224 7600
Significant genes (% of tot) (b) 1016 (11.7%) 1568 (9.8%) 862 (11.3%) Significant genes with annotation (% of tot significant) (c) 987 (97%) 1038 (66.2%) 567 (65.7%)
emerged to have a specific consensus binding sequence for EGR1 transcription factor in their promoters (PCR validation of the microarray results shown in Figure S1). By multiple alignments, we found a conserved module constituted by a binding site for EGR1 and a second site for SP1 (Figure 2). Next, we searched for this module in the whole set of known promoter sequences inRattus norvegicus, locating it in the promoters of 659 genes. Geneontology classification showed significant over-representation of such families as neuron differentiation (34 genes), neurogenesis (37 genes), and neuron development (26 genes), suggesting a central role of EGR1-SP1 module during production and differentiation of neurons (Table S3).
Genes upregulated in mesencephalon at E11
We found 157 genes to be significantly over-expressed in MesE11 as compared to MesPC. These genes covered a variety of cellular and molecular functions, such as developmental process (43 genes), synaptic transmission (17 genes), nervous system development (16 genes) and neurogenesis (9 genes), and ion channels (9 genes). Interestingly, genes involved in oxygen transport (5 genes) and iron binding (11 genes) were also in this group (Table S4). As for the MesPC genes, we have inferred MesE11 gene network based on the PubMed co-citation and the presence of TFBS in their promoter sequences. This revealed a possible role for members of transcription factors of the NEUR and NR2F families in regulating the expression of many genes upregulated in MesE11. Particularly, the genes encoding respec-tively Neurod3 (NEUR family) and Nr2f2 (NR2F family) were significantly over-expressed in MesE11 (Figure 3). We also scanned the whole set of known Rattus norvegicus regulatory sequences, finding 726 promoters with the NEUR-NR2F module.
Genes of the dopamine metabolism (Cyp2d22, Tgfb2, Nr4a2, Sncaip_predicted, Th, PCR validation of the microarray results for Nr4A2 and Th shown in Figure S1), synaptic transmission (30 genes) and development (24 genes) emerged as possible targets of NEUR-NR2F (Table S5).
Dopamine-related genes
The Genomatix software Bibliosphere allows to search for genes that are co-cited in the PubMed abstracts with biological themes. By this approach, we have created a catalog of 1339 Rattus Norvegicusgenes related in literature to dopamine. Of these, 1032 were present on the re-annotated Affymetrix chipset 230A. A total of 84 genes were found differentially expressed in all the three datasets (Table 2), when comparing MesPC (46 genes) and MesE11 (38 genes). Interestingly, 18 dopamine-related genes over-expressed in MesPC are described as involved in cell differenti-ation; a subgroup of this, composed of 8 genes, is involved in neuron differentiation. Five dopamine-related MesPC genes are also associated with neurodegenerative diseases. The dopamine-related genes over-expressed in MesE11 better resampled neurophysiologic events, as they were found associated to synaptic transmission (9 genes), transmission of nerve impulse (9 genes), and behavior (7 genes). Further, we have tested the hypothesis that the transcriptional models inferred from the MesPC and MesE11 gene networks would have a potential role in the regulation of some dopamine-related genes inferred from the literature scan. This seems to be the case, as 283 (,21%) dopamine-related genes
presented the EGFR-SP1F module in their promoter regions. This group was enriched in genes involved in neuron differenti-ation. Similarly, the promoters of 132 (,10%) dopamine-related
genes showed the ability to bind the NEUR-NR2F module. This group was enriched in genes involved in neurophysiologic processes, such as transmission of nerve impulse and synaptic transmission.
Discussion
Model organisms are widely used in biomedical research elucidating mechanisms which would be impossible to experiment on using human samples. Mice and rats are often regarded as optimal choices for working on the mammalian CNS. However, Rattus norvegicusgenome has been annotated much less in detail, as compared to theMus musculusgenome. In this paper we utilized up-to-date methods for annotating rat arrays with the best possible accuracy. We have used the transcriptional profiling for comparing tissue samples from rat brain to primary cells from the same origin. We studied the effect of re-annotation and at the same time elucidated how well primary cells resemble the original tissues in the level of transcriptional profile. We have extensively investigated the gene expression in rodents’ mesencephalon at E11.5 and neuronal primary cultures after 9 DIV, derived from it. For this, we have carried out a microarray experiment using the Affymetrix GeneChips RAE230A for theRattus norvegicusgenome. Because of the design inaccuracies and of the fast speed of updating information concerning the genes and transcripts sequences, many Affymetrix probes are known to have severe design problems as such. Particularly for the chipset RAE230A, several probe sets contain probes with multiple genome hits (13.2%), with no known target (3.6%), with allele-specific probes (19.5%) [28]. Currently, several re-annotation methods are available allowing the probes to be mapped to genes, transcripts, or even exons sequences stored in public databases. However, exon-based re-annotation leads to decreased precision and increased variance in estimating gene expression, probably due
Figure 1. Significant genes with an annotation in DAVID database.The numbers of significant genes with a reliable DAVID annotation in each re-annotation analysis are shown. The intersections show the amount of common genes between two or all the three analyses. Proportional-area Venn diagrams were built as suggested by Chow and Rodgers [55].
to the smaller number of probes that map to each exon [29]. Moreover, due to the fact that the majority of the probes are designed ignoring splicing variances, we find more convenient to work with gene-based rather than transcript-based re-annotations. During the re-annotation process, each single oligonucleotide probe is re-assigned to the correct gene. However, some probes are eliminated, because they don’t reliably recognize any transcript, they have been designed for matching the antisense sequence of a given transcript, or they are designed in allele-specific regions. For instance, only the 53.6% (EG), 60.5% (RF), and 44% (ES) of all the RAE230A probes can be utilized for re-annotation. Long lists of differentially expressed candidate genes are usually produced from microarray analysis. However, they cannot be considered as the end point of the analysis but rather as the starting point of a more meaningful interpretation, by taking advantage of the increasing knowledge about the functions of the genes within the cells. The annotation of the genes or transcripts is usually obtained from public libraries such as Gene Ontology [30] or KEGG [31]. Similarly, one can test whether the expression of genes located in specific portions of chromatin (i.e. cytobands or entire chromo-some) are involved in certain experimental conditions. For any of
the annotations used for grouping the genes, the terms are defined a prioriand constructed independently from the experimental data. The DAVID database is one of the most reliable tools for annotating genes and transcripts, as well as for finding over-represented functional groups of genes in a given gene list. Interestingly, as many as 97% of all the significant EG entities were mapped into DAVID, while only 66.2% and 65.7% respectively from the RS and ENS presented a reliable DAVID annotation. Therefore, we conclude that the re-annotation of the Affymetrix probes according to the Entrez Gene database is the best in terms of gene annotation and functional analysis. Similar results were observed also during the re-annotation of the Affymetrix probes for human genes [32,33]. Investigating gene expression by microarrays presents some limitations especially related to the fact that microarrays can estimate only the levels of the transcripts within the cells, not giving any information concerning the post-transcriptional regulations. In addition, only rigorous statistical methods allow keeping the false discovery rates at reasonable levels, as many technical sources of variations can affect the measurements. Other restrictions to be considered when working with large-scale gene expression studies consist in the
Figure 2. Knowledge-based gene network of the MesPC-specific genes.The nodes represent the genes. In BLUE, the MesPC-upregulated genes; in WHITE, the transcription factors not included in the list of significant genes that interact with the MesPC specific genes. The BLACK edges indicate co-citation of two genes in the PubMed database; the GREEN edges indicate the presence of a significant TFBS on the promoter of the given gene for the specific interacting transcription factor. Lower-right corner: summary of the regulatory model possibly regulating the expression of MesPC genes. The matrix elements present in the model (V$EGRF and V$SP1F), the DNA strand where they are present on the promoter regions, their relative distance, and the p-value are shown.
inaccuracy of the functional annotation of some genes: for instance, many genes are annotated in the ontology ‘‘apoptosis’’, without being directly correlated to this specific process, but simply being involved more generally in cell homeostasis. Careful inspection is always needed for a correct interpretation of long gene lists resulting from microarray assays. Finally, microarrays detect transcripts at very low concentrations, but when working with complex tissues, such as the brain, assigning the expression patterns to a certain cellular subpopulation is impossible. Nevertheless, we believe that the tissues should always be intended as functional entities and their global gene expression should be target of interest.
When examining whole tissues, gene expression from a variety of cell types, including non-neuronal tissues (especially blood), is recorded. This explains why we observed gene groups of haemoglobins and oxygen transport as significantly over-repre-sented in MesE11 over MesPC. Overall, our results suggest that the MesPC are a reliable tool to be used in developmental neurobiology, as their gene expression programs largely resemble the tissue of origin. As these cell cultures comprise a mixed cell population, they are used by the scientific community because they mirror the midbrain neuronal composition better than more homogeneous cell lines [19,23]. Thus we believe that it is important to know what the gene expression profiles are in these
cultures. We found genes of the extracellular matrix and of the focal adhesions to be upregulated in MesPC. In the mesenceph-alon, the adhesion structures are synthesized and maintained by glial cells, that are absent in primary cultures. The protocol used to establish midbrain neuronal cultures enhances dopaminergic differentiation, thus leading to enrichment in positive neurons, when compared to standard cultures [34]. However, some genes of the dopamine biosynthesis were found over-expressed in MesE11. This finding is consistent with the decrease of TH mRNA observed during thein vitroculture progression [19,23,34], and can be due to the decrease of trans-synaptic stimulation following the dissociation of the tissue.
We identified Egr1 and Sp1 as key elements in the regulation of the transcription patterns in MesPC. Particularly, early growth response genes encode for transcription factors that regulate gene expression in response to a variety of stimuli influencing cell growth and differentiation, as well as response to injury and reaction to chronic nervous system diseases [35]. Following depolarization, transcription of the Egr1 gene increases in the MesPC [36], suggesting that this immediate early transcription factor might be a key gene mediating the electrical activity leading to neuronal differentiation. Mice lacking EGR genes present a wide range of developmental abnormalities, including infertility [37], defects of the hindbrain morphogenesis [38], defective
Figure 3. Knowledge-based gene network of the MesE11-specific genes.The nodes represent the genes. In BLUE, the MesE11-upregulated genes. The BLACK edges indicate co-citation of two genes in the PubMed database; the GREEN edges indicate the presence of a significant TFBS on the promoter of the given gene for the specific interacting transcription factor. Lower-right corner: summary of the regulatory model possibly regulating the expression of MesE11 genes. The matrix elements present in the model (V$NEUR and V$NR2F), the DNA strand where they are present on the promoter regions, their relative distance, and the p-value are shown.
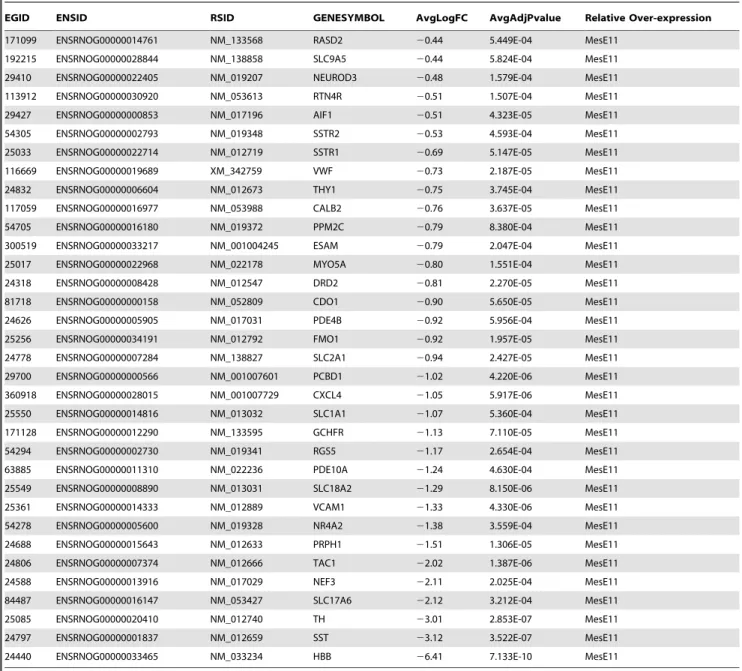
Table 2.Dopamine-related genes found significant comparing MesPC versus MesE11.
EGID ENSID RSID GENESYMBOL AvgLogFC AvgAdjPvalue Relative Over-expression
24772 ENSRNOG00000013589 NM_022177 CXCL12 3.10 3.186E-07 MesPC
24153 ENSRNOG00000028896 NM_012488 A2M 2.30 6.543E-05 MesPC
25692 ENSRNOG00000019018 NM_013151 PLAT 2.13 2.730E-07 MesPC 24596 ENSRNOG00000005392 NM_012610 NGFR 2.06 6.497E-07 MesPC 171163 ENSRNOG00000012876 NM_133623 SLC6A13 2.05 9.467E-07 MesPC 25625 ENSRNOG00000031312 NM_013091 TNFRSF1A 1.94 5.763E-05 MesPC 29539 ENSRNOG00000001344 NM_032416 ALDH2 1.82 1.480E-07 MesPC 64513 ENSRNOG00000005917 NM_033485 PAWR 1.77 5.590E-05 MesPC 83619 ENSRNOG00000001548 NM_031789 NFE2L2 1.77 1.405E-04 MesPC 54702 ENSRNOG00000005053 NM_019371 EGLN3 1.74 2.600E-06 MesPC 117549 ENSRNOG00000002524 NM_057201 GPR37 1.65 5.267E-06 MesPC 24212 ENSRNOG00000007290 NM_012505 ATP1A2 1.64 3.262E-04 MesPC 24423 ENSRNOG00000029726 NM_017014 GSTM1 1.58 3.070E-06 MesPC 315714 ENSRNOG00000008680 NM_001012125 LOXL1 1.52 2.213E-06 MesPC 316742 ENSRNOG00000015906 NM_001015020 TGIF 1.50 4.307E-05 MesPC
29318 ENSRNOG00000001239 NM_024131 DDT 1.46 9.887E-06 MesPC
25728 ENSRNOG00000018454 NM_138828 APOE 1.45 3.105E-04 MesPC
24223 ENSRNOG00000017123 NM_012512 B2M 1.40 2.920E-06 MesPC
295217 ENSRNOG00000013356 NM_001025648 SNAPAP 1.18 1.663E-06 MesPC 85272 ENSRNOG00000007108 XM_342591 BMP7 1.16 1.742E-04 MesPC
81818 ENSRNOG00000018087 NM_031140 VIM 1.15 4.160E-06 MesPC
81632 ENSRNOG00000002636 NM_031003 ABAT 1.10 4.378E-04 MesPC 25112 ENSRNOG00000005615 NM_024127 GADD45A 1.09 9.963E-06 MesPC
25104 ENSRNOG00000019372 NM_012744 PC 1.02 1.747E-04 MesPC
25227 ENSRNOG00000011150 NM_033443 ARSB 1.01 3.541E-04 MesPC 24392 ENSRNOG00000000805 NM_012567 GJA1 1.00 2.673E-04 MesPC 25177 ENSRNOG00000000875 NM_001033926 FHL1 0.93 3.247E-05 MesPC
25491 ENSRNOG00000018681 NM_012987 NES 0.90 4.750E-04 MesPC
83584 ENSRNOG00000009508 NM_031775 CASP6 0.90 2.798E-04 MesPC 24686 ENSRNOG00000021259 NM_012631 PRNP 0.90 1.443E-05 MesPC
25508 ENSRNOG00000033280 NM_013000 PAM 0.84 4.407E-06 MesPC
363875 ENSRNOG00000001068 NM_134366 RAC1 0.83 6.853E-05 MesPC 24530 ENSRNOG00000019573 NM_017024 LCAT 0.81 3.600E-05 MesPC 50719 ENSRNOG00000018824 NM_017353 SLC7A5 0.79 1.085E-04 MesPC 24788 ENSRNOG00000017291 NM_017052 SORD 0.79 9.679E-05 MesPC 79212 ENSRNOG00000006527 NM_024371 SLC6A1 0.79 8.860E-06 MesPC
84485 ENSRNOG00000019691 NM_053425 CCS 0.78 2.463E-04 MesPC
286898 ENSRNOG00000012062 NM_173118 NPC2 0.72 7.973E-06 MesPC 25125 ENSRNOG00000019742 NM_012747 STAT3 0.71 6.022E-04 MesPC
25368 ENSRNOG00000012325 NM_012895 ADK 0.62 2.013E-04 MesPC
171135 ENSRNOG00000014475 NM_133600 SLC31A1 0.62 3.827E-04 MesPC 299858 ENSRNOG00000025053 XM_243524 LRP1 0.57 2.421E-04 MesPC 83799 ENSRNOG00000012640 NM_031973 DPP7 0.57 3.506E-04 MesPC
29499 ENSRNOG00000006120 NM_017221 SHH 0.47 1.974E-04 MesPC
myelination in the peripheral nervous system [39], and defects in learning and memory [40,41]. Gene network and promoter alignment techniques suggested that several key transcripts found in MesE11 can be regulated by the binding of transcription factors of the NEUR and NR2F families. Moreover, the levels of Neurod3 (NEUR) and Nr2f2 (NR2F) were found over-expressed in MesE11. Neurogenic basic helix-loop-helix (bHLH) factors Mash1, neurogenins (Ngns) and NeuroD3 (also known as Ngn1) play important roles in Nurr1-induced mDA neuronal differenti-ation [42]. While the role of Ngn2 in the development of mDA neurons is well known [43,44], less information is available concerning Neurod3. In addition to inducing neurogenesis by functioning as a transcriptional activator, Neurod3 seems to inhibit the differentiation of neural stem cells into astrocytes [45]. COUP-TFII (Nr2f2) seems to be involved in tangential GABAergic interneurons migration in the developing brain, through the
regulation of short- and long-range guidance cues [46]. Functions of Nr2f2 in the mDA phenotype definition are still to be described. In summary, we present a broad view of the transcriptome of the DA neurons in primary cultures and in Mesencephalon E11. By employing gene network techniques, we propose novel models that could explain the transcription regulatory events taking place in the maintenance of the transcriptional identity of the mesenceph-alon, and in primary cultures derived from this CNS area, with a crucial role in physiology and pathology.
Materials and Methods
Animals and Dissections
Timed pregnant Sprague-Dawley rats (Charles River Breeding Laboratories, Milan, Italy) were sacrificed in accordance with the Society for Neuroscience guidelines and Italian law. Embryonic (E)
EGID ENSID RSID GENESYMBOL AvgLogFC AvgAdjPvalue Relative Over-expression
171099 ENSRNOG00000014761 NM_133568 RASD2 20.44 5.449E-04 MesE11 192215 ENSRNOG00000028844 NM_138858 SLC9A5 20.44 5.824E-04 MesE11 29410 ENSRNOG00000022405 NM_019207 NEUROD3 20.48 1.579E-04 MesE11 113912 ENSRNOG00000030920 NM_053613 RTN4R 20.51 1.507E-04 MesE11 29427 ENSRNOG00000000853 NM_017196 AIF1 20.51 4.323E-05 MesE11 54305 ENSRNOG00000002793 NM_019348 SSTR2 20.53 4.593E-04 MesE11 25033 ENSRNOG00000022714 NM_012719 SSTR1 20.69 5.147E-05 MesE11 116669 ENSRNOG00000019689 XM_342759 VWF 20.73 2.187E-05 MesE11 24832 ENSRNOG00000006604 NM_012673 THY1 20.75 3.745E-04 MesE11 117059 ENSRNOG00000016977 NM_053988 CALB2 20.76 3.637E-05 MesE11 54705 ENSRNOG00000016180 NM_019372 PPM2C 20.79 8.380E-04 MesE11 300519 ENSRNOG00000033217 NM_001004245 ESAM 20.79 2.047E-04 MesE11 25017 ENSRNOG00000022968 NM_022178 MYO5A 20.80 1.551E-04 MesE11 24318 ENSRNOG00000008428 NM_012547 DRD2 20.81 2.270E-05 MesE11 81718 ENSRNOG00000000158 NM_052809 CDO1 20.90 5.650E-05 MesE11 24626 ENSRNOG00000005905 NM_017031 PDE4B 20.92 5.956E-04 MesE11 25256 ENSRNOG00000034191 NM_012792 FMO1 20.92 1.957E-05 MesE11 24778 ENSRNOG00000007284 NM_138827 SLC2A1 20.94 2.427E-05 MesE11 29700 ENSRNOG00000000566 NM_001007601 PCBD1 21.02 4.220E-06 MesE11 360918 ENSRNOG00000028015 NM_001007729 CXCL4 21.05 5.917E-06 MesE11 25550 ENSRNOG00000014816 NM_013032 SLC1A1 21.07 5.360E-04 MesE11 171128 ENSRNOG00000012290 NM_133595 GCHFR 21.13 7.110E-05 MesE11 54294 ENSRNOG00000002730 NM_019341 RGS5 21.17 2.654E-04 MesE11 63885 ENSRNOG00000011310 NM_022236 PDE10A 21.24 4.630E-04 MesE11 25549 ENSRNOG00000008890 NM_013031 SLC18A2 21.29 8.150E-06 MesE11 25361 ENSRNOG00000014333 NM_012889 VCAM1 21.33 4.330E-06 MesE11 54278 ENSRNOG00000005600 NM_019328 NR4A2 21.38 3.559E-04 MesE11 24688 ENSRNOG00000015643 NM_012633 PRPH1 21.51 1.306E-05 MesE11 24806 ENSRNOG00000007374 NM_012666 TAC1 22.02 1.387E-06 MesE11 24588 ENSRNOG00000013916 NM_017029 NEF3 22.11 2.025E-04 MesE11 84487 ENSRNOG00000016147 NM_053427 SLC17A6 22.12 3.212E-04 MesE11 25085 ENSRNOG00000020410 NM_012740 TH 23.01 2.853E-07 MesE11 24797 ENSRNOG00000001837 NM_012659 SST 23.12 3.522E-07 MesE11 24440 ENSRNOG00000033465 NM_033234 HBB 26.41 7.133E-10 MesE11
age was determined by considering the day of insemination (as confirmed by vaginal plug) as day E0. Prenatal brains were quickly removed and placed in phosphate buffered saline (PBS) without calcium and magnesium and supplemented with 33 mM glucose. The ventral midbrain was carefully dissected under a stereoscope in sterile conditions and processed for cell cultures (MesPC) or RNA isolation (MesE11). The use of animals was approved by the Institute of Genetics and Biophysics ethical committee and is in agreement with the European Community Directives. All efforts were made to minimize animal suffering and to reduce the number of animals used.
Cell Cultures
Cells were dissociated from the embryonic rat ventral midbrain and cultured as described [19,22,23]. In brief, the tissues were dissected from E11.5 embryos and dissociated using mechanical trituration with a fire polished Pasteur pipette in culture medium (see below) and 0.01% pancreatic deoxyribonuclease (Sigma, Milan, Italy); cells were centrifuged 10 min at 500 g, suspended in Neural Basal Medium (NBM, Invitrogen, Milan, Italy), counted and plated in NBM at a density of 18.000/cm2in dishes coated with 15 ug/ml of poly-D-Lysine (Sigma). Multiwell plates (Corning Costar, Milan, Italy) were used for all cultures. NBM was supplemented with B27 (Invitrogen, Milan, Italy), fibroblast growth factor 2 (FGF2, 20 ng/ml, Sigma), the N-terminal fragment of Sonic hedgehog protein (SHH, 50 ng/ml) and fibroblast growth factor 8 (FGF8, 10 ng/ml) for 6 days in vitro. SHH was purified as previously described [23]. Half of the medium was changed every three days. After six days the medium supplements were withdrawn with the exception of B27, and was added the ascorbic acid. Cultures were left for an additional three days.
Microarray strategy and sample preparation RNA isolation
To minimize biological variability four pregnant rats were sacrificed and the E11 embryos were mixed obtaining three groups. Each group was treated separately. The ventral midbrains dissected from each group were pooled (MesE11) or dissociated and the cells were cultured in duplicate. After 9 days in vitrothe cultures were collected (MesPC). Three microarrays were hybridized with MesE11 and three with MesPC independent samples.
RNA isolation and RT-PCR
RNA obtained from tissues or from primary cultures was extracted using the Tri-Reagent isolation system (Sigma) accord-ing to the manufacturer’s instructions. The RNA from the culture duplicates was pooled. The yield and integrity of RNA were determined by a spectrophotometer of A260 and agarose gel electrophoresis respectively. Total RNA was treated with a DNA free kit (Ambion Inc., Milan, Italy) to eliminate possible DNA contaminations. For microarray hybridation an additional clean-up of total RNA was performed using the RNeasy kit (Qiagen, Milan, Italy). RNA samples were further processed for microarray hybridization or for RT-PCR. RT-PCR analyses were as previously described [47,48]. In brief, two ug of RNA were reverse transcribed using random hexanucleotides as primers (New England Biolabs Inc., Milan, Italy, 6 mM) and 200 U of moloney-murine leukemia virus reverse transcriptase (Ambion). 1/20 of the reverse transcribed cDNA was amplified in a 25 ul reaction mixture containing AmpliTaq Gold DNA polymerase buffer (Applied Biosystem, Milan, Italy), 0.2 mM dNTPs (Finnzymes
OY, Espoo, Finland), 0.4 mM each primer, 1.25 U AmpliTaq
Gold DNA polymerase (Applied Biosystem) and 1 mCi
[32P]dCTP (3000 Ci/mmol, Amersham Biosciences, Milan, Italy). As previously described [48], different sets of primer pairs were used in the same reaction tube to co-amplify cDNA, together with primers for the hypoxanthine-phosphoribosyl-transferase (Hprt), a constantly expressed gene during CNS development, used as an internal standard [49]. After a first denaturing step at 95uC for 8 min, PCR amplification was performed for 28 cycles organized as follows: 95uC for 0.5 min; 56uC–58uC for 0.5 min; 72uC for 0.5 min and was followed by a final extension step (72uC for 5 min). The specificity of PCR primers was determined by performing BLAST searches against the databases. Non-reverse-transcribed RNA templates and mock controls were always run in PCR reactions and never gave amplification products. The [32 P]-labeled amplified products were separated by electrophoresis in 1.5% agarose gel, dried and exposed to a PhosphorImager screen (Amersham). Quantitation was achieved by integrating the volume areas of each fragment obtained from scanning the screens with PhosphorImager apparatus (Amersham), equipped with Image-Quant software. The ratio between the yield of each amplified product and that of the co-amplified HPRT allowed a relative estimate of the mRNA levels [48]. Triplicate samples allowed statistical analysis.
Probe preparation and microarray hybridization
Using the protocol supplied by the manufacturer (Affymetrix, Santa Clara, CA), double-stranded cDNA was synthesized from total RNA and was used to obtain biotin-labeled cRNA by anin vitrotranscription reaction (ENZO Diagnostics, Farmingdale, NY). Biotin-labeled cRNA was fragmented and hybridized with Affymetrix RAE230A rat genome GeneChip microarrays, accord-ing to the manufacturer’s protocol, after verifyaccord-ing the quality of the biotin-labeled cRNA on a Test Chip (Affymetrix).
Affymetrix probes re-annotation
We used a sequence-based re-annotation of the Affymetrix probes on RAE-230A chipset [28]. The R packages used in this study can be retrieved at http://brainarray.mbni.med.umich.edu/ Brainarray/Database/CustomCDF/CDF_download_v10.asp
Data Quality Control
Extensive quality control of the data microarray raw data has been carried out using the methods implemented in the BioConductor packages affy [50] and affyQCReport [51]. All the microarrays showed excellent quality according to the standards, thus all of them were considered for further analysis (data not shown available upon request from the authors).
Data preprocessing
The preprocessing was carried out with the methods imple-mented in R (http://www.R-project.org) and BioConductor (http://www.bioconductor.org). The CEL files were imported into R environment. After standard quality control (results not shown), the re-annotated data were preprocessed using the RMA algorithm [52]. The RMA allows robust estimation of inter-array variability by employing quantile normalization and by fitting a linear model for each probe set across all the arrays of the dataset.
Feature Selection
correction [54] were considered as significantly differentially expressed.
Functional analysis
The DAVID gene annotation system was used in order to select over-represented biological terms. Default statistical parameters were employed [27].
Gene network and promoter analysis
For each contrast analyzed, the genes up-regulated in each array group were separately imported into the software Genoma-tix Bibiosphere to build up gene networks based on their co-citation in the literature as well as the presence of TFBS for known transcription factors in their promoter regions (http://www. genomatix.de/products/BiblioSphere/). The transcription factors (TF) presenting extensive or interesting connectivity within the network were chosen. Consequently, the genes presenting a significant consensus for the selected TFs were further analyzed. The promoter sequences of the genes were retrieved using the software Genomatix Gene2Promoter (http://www.genomatix.de/ online help/help eldorado/Gene2Promoter Intro.html) and ana-lyzed with Genomatix FrameWorker (http://www.genomatix.de/ online help/help gems/FrameWorker.html) to search for common models containing at least two TFBS. Finally, the significant models were screened for the whole set of knownRattus norvegicus promoters by using Genomatix ModelInspector (http://www. genomatix.de/online help/help fastm/modelinspector help.html).
Statistical analysis
The analyses applied to the microarray data have been described above. For all other experiments, analysis of variance was carried out, followed by post hoc comparison (ANOVA, Scheffe` F-test). Data were expressed as mean+/2SEM.
Supporting Information
Figure S1 Summary of the PCR validations of the microarray results:The Nr4a2, Th, and Egr1 gene expression have been tested by PCR and statistically validated as described in materials and methods.
Found at: doi:10.1371/journal.pone.0004977.s001 (0.04 MB TIF)
Table S1 Genes significant in the three analyses with a DAVID annotation. Fields: DAVIDID: DAVID unique ID; EG: Entrez Gene ID; logFC_EG: logarithmic fold change (MesPC-MesE11) based on the EG re-annotation; P.Value_EG: p-value based on the EG re-annotation; adj.P.Val_EG: adjusted (Benjamini-Hoch-berg) p-value based on the EG re-annotation; ENSID: Ensembl gene ID; logFC_ENS: logarithmic fold change (MesPC-MesE11)
based on the ENS re-annotation; P.Value_ENS: p-value based on the ENS re-annotation; adj.P.Val_ENS: adjusted (Benjamini-Hochberg) p-value based on the ENS re-annotation; RSID: RefSeq ID; logFC_RS: logarithmic fold change (MesPC-MesE11) based on the RS re-annotation; P.Value_RS: p-value based on the RS re-annotation; adj.P.Val_RS: adjusted (Benjamini-Hochberg) p-value based on the RS re-annotation; GeneName: official gene name.
Found at: doi:10.1371/journal.pone.0004977.s002 (0.15 MB XLS)
Table S2 Functional analysis of the genes significantly over-expressed in MesPC. Each stack represents a group of related functional terms. Each term within each stack is in a row of the table. The number of genes annotated, the percent of represen-tation of the term, and the enrichment p-value are shown. Found at: doi:10.1371/journal.pone.0004977.s003 (0.29 MB XLS)
Table S3 Summary of the Genomatix ModelInspector analysis for V$EGR-V$SP1F. Rattus norvegicus promoter sequences showing the V$EGR-V$SP1F module. For each match, the sequence annotation, the position of the module, and the strand are indicated. Over-represented Geneontology terms are also shown starting from page 53.
Found at: doi:10.1371/journal.pone.0004977.s004 (0.39 MB PDF)
Table S4 Functional analysis of the genes significantly over-expressed in MesE11. Each stack represents a group of related functional terms. Each term within each stack is in a row of the table. The number of genes annotated, the percent of represen-tation of the term, and the enrichment p-value are shown. Found at: doi:10.1371/journal.pone.0004977.s005 (0.19 MB XLS)
Table S5 Summary of the Genomatix ModelInspector analysis for V$NEUR-V$NR2F. Rattus norvegicus promoter sequences showing the V$NEUR-V$NR2F module. For each match, the sequence annotation, the position of the module, and the strand are indicated. Over-represented Geneontology terms are also shown starting from page 57.
Found at: doi:10.1371/journal.pone.0004977.s006 (0.35 MB PDF)
Author Contributions
Conceived and designed the experiments: DG CPC PA UDP. Performed the experiments: FV. Analyzed the data: DG ADL PA. Wrote the paper: DG FV ADL DL CPC PA UDP.
References
1. Hornykiewicz O (2001) Chemical neuroanatomy of the basal ganglia - Normal and in parkinson’s disease. J Chem Neuroanat 22: 3–12.
2. Sharma N, Standaert DG (2002) Inherited movement disorders. Neurologic Clin 20: 759–778.
3. Volkow ND, Chang L, Wang GJ, Fowler JS, Franceschi D, et al. (2001) Higher cortical and lower subcortical metabolism in detoxified methamphetamine abusers. Am J Psychiatry 158: 383–389.
4. Lang UE, Puls I, Muller DJ, Strutz-Seebohm N, Gallinat J (2007) Molecular mechanisms of schizophrenia. Cell Physiol Biochem 20: 687–702.
5. Dailly E, Chenu F, Renard CE, Bourin M (2004) Dopamine, depression and antidepressants. Fundam Clin Pharmacol 18: 601–607.
6. Swanson JM, Kinsbourne M, Nigg J, Lanphear B, Stefanatos GA, et al. (2007) Etiologic subtypes of attention-deficit/hyperactivity disorder: brain imaging, molecular genetic and environmental factors and the dopamine hypothesis. Neuropsychol Rev 17: 39–59.
7. Nestler EJ (2005) Is there a common molecular pathway for addiction? Nat Neurosci 8: 1445–1449.
8. Zetterstro¨m RH, Solomin L, Jansson L, Hoffer BJ, Olson L, Perlmann T (1997) Dopamine neuron agenesis in Nurr1-deficient mice. Science 276: 248–250. 9. Saucedo-Cardenas O, Quintana-Hau JD, Le WD, Smidt MP, Cox JJ, et al.
(1998) Nurr1 is essential for the induction of the dopaminergic phenotype and the survival of ventral mesencephalic late dopaminergic precursor neurons. Proc Natl Acad Sci U S A 95(7): 4013–8.
10. Smits SM, Ponnio T, Conneely OM, Burbach JP, Smidt MP (2003) Involvement of Nurr1 in specifying the neurotransmitter identity of ventral midbrain dopaminergic neurons. Eur J Neurosci 18(7): 1731–8.
11. Smidt MP, Burbach JP (2007) How to make a mesodiencephalic dopaminergic neuron. Nat Rev Neurosci 8: 21–32.
12. Perrone-Capano C, Volpicelli F, di Porzio U (2008) The molecular code involved in midbrain dopaminergic neuron development and maintenance. Rendiconti Lincei – Scienze fisiche e naturali 19: 271–89.
14. Hynes M, Poulsen K, Tessier-Lavigne M, Rosenthal A (1995) Control of neuronal diversity by the floor plate: contact-mediated induction of midbrain dopaminergic neurons. Cell 80: 95–101.
15. Hynes M, Rosenthal A (1999) Specification of dopaminergic and serotonergic neurons in the vertebrate CNS. Curr Opin Neurobiol 9: 26–36.
16. Lin JC, Rosenthal A (2003) Molecular mechanisms controlling the development of dopaminergic neurons. Semin Cell Dev Biol 14: 175–80.
17. Di Porzio U, Zuddas A, Cosenza-Murphy DB, Barker JL (1990) Early appearance of tyrosine hydroxylase immunoreactive cells in the mesencephalon of mouse embryos. Int J Dev Neurosci 8: 523–32.
18. Bouvier MM, Mytilineou C (1995) Basic fibroblast growth factor increases division and delays differentiation of dopamine precursors in vitro. J Neurosci 15: 7141–9.
19. Volpicelli F, Consales C, Caiazzo M, Colucci-D’Amato L, Perrone-Capano C, di Porzio U (2004) Enhancement of dopaminergic differentiation in proliferating midbrain neuroblasts by sonic hedgehog and ascorbic acid. Neural Plast 11: 45–57.
20. Puelles E, Acampora D, Lacroix E, Signore M, Annino A, Tuorto F, Filosa S, Corte G, Wurst W, Ang SL, Simeone A (2003) Otx dose-dependent integrated control of antero-posterior and dorso-ventral patterning of midbrain. Nat Neurosci 2003 6: 453–60.
21. Prochiantz A, di Porzio U, Kato A, Berger B, Glowinski J (1979) In vitro maturation of mesencephalic dopaminergic neurons from mouse embryos is enhanced in presence of their striatal target cells. Proc Natl Acad Sci U S A 76: 5387–91.
22. di Porzio U, Daguet MC, Glowinski J, Prochiantz A (1980) Effect of striatal cells on in vitro maturation of mesencephalic dopaminergic neurones grown in serum-free conditions. Nature 288: 370–3.
23. Volpicelli F, Perrone-Capano C, Da Pozzo P, Colucci-D’Amato L, di Porzio U (2004) Modulation of nurr1 gene expression in mesencephalic dopaminergic neurones. J Neurochem 88: 1283–94.
24. Maglott D, Ostell J, Pruitt KD, Tatusova T (2007) Entrez Gene: gene-centered information at NCBI. Nucleic Acids Res 35: D26–31.
25. Pruitt KD, Tatusova T, Maglott DR (2007) NCBI reference sequences (RefSeq): a curated non-redundant sequence database of genomes, transcripts and proteins. Nucleic Acids Res 35: D61–5.
26. Flicek P, Aken BL, Beal K, Ballester B, Caccamo M, et al. (2008) Ensembl 2008. Nucleic Acids Res 36: D707–14.
27. Huang DW, Sherman BT, Tan Q, Collins JR, Alvord WG, et al. (2007) The DAVID gene functional classification tool: A novel biological module-centric algorithm to functionally analyze large gene lists. Genome Biol 8: 183. 28. Dai M, Wang P, Boyd AD, Kostov G, Athey B, et al. (2005) Evolving gene/
transcript definitions significantly alter the interpretation of GeneChip data. Nucleic Acids Res 33: e175.
29. Carter SL, Eklund AC, Mecham BH, Kohane IS, Szallasi Z (2005) Redefinition of Affymetrix probe sets by sequence overlap with cDNA microarray probes reduces cross-platform inconsistencies in cancer-associated gene expression measurements. BMC Bioinformatics 25: 107.
30. Gene Ontology Consortium (2008) The Gene Ontology project in 2008. Nucleic Acids Res 36: D440–4.
31. Okuda S, Yamada T, Hamajima M, Itoh M, Katayama T, et al. (2008) KEGG Atlas mapping for global analysis of metabolic pathways. Nucleic Acids Res 36: W423–6.
32. Greco D, Somervuo P, Di Lieto A, Raitila T, Nitsch L, et al. (2008) Physiology, pathology and relatedness of human tissues from gene expression meta-analysis. PLoS ONE 3(4): e1880.
33. Greco D, Kotronen A, Westerbacka J, Puig O, Arkkila P, et al. (2008) Gene expression in human NAFLD. Am J Physiol Gastrointest Liver Physiol 294(5): G1281–7.
34. Perrone-Capano C, Tino A, Amadoro G, Pernas-Alonso R, di Porzio U (1996) Dopamine transporter gene expression in rat mesencephalic dopaminergic
neurons is increased by direct interaction with target striatal cells in vitro. Brain Res Mol Brain Res 39: 160–6.
35. Beckmann AM, Wilce PA (1997) Egr transcription factors in the nervous system. Neurochem Int 31: 477–510.
36. Volpicelli F, Caiazzo M, Greco D, Consales C, Leone L, et al. (2007) Bdnf gene is a downstream target of Nurr1 transcription factor in rat midbrain neurons in vitro. J Neurochem 102: 441–53.
37. Lee SL, Sadovsky Y, Swirnoff AH, Polish JA, Goda P, et al. (1996) Luteinizing hormone deficiency and female infertility in mice lacking the transcription factor NGFI-A (Egr-1). Science 273: 1219–1221.
38. Swiatek PJ, Gridley T (1993) Perinatal lethality and defects in hindbrain development in mice homozygous for a targeted mutation of the zinc finger gene Krox20. Genes Dev 7: 2071–84.
39. Topilko P, Schneider-Maunoury S, Levi G, Baron-Van Evercooren A, Chennoufi AB, et al. (1994) Krox-20 controls myelination in the peripheral nervous system. Nature 371: 796–799.
40. Jones MW, Errington ML, French PJ, Fine A, Bliss TV, et al. (2001) A requirement for the immediate early gene Zif268 in the expression of late LTP and long-term memories. Nat Neurosci 4: 289–296.
41. Li L, Yun SH, Keblesh J, Trommer BL, Xiong H, Radulovic J, Tourtellotte WG (2007) Egr3, a synaptic activity regulated transcription factor that is essential for learning and memory. Mol Cell Neurosci 35: 76–88.
42. Park CH, Kang JS, Kim JS, Chung S, Koh JY, et al. (2006) Differential actions of the proneural genes encoding Mash1 and neurogenins in Nurr1-induced dopamine neuron differentiation. J Cell Sci 119: 2310–20.
43. Andersson EK, Irvin DK, Ahlsio¨ J, Parmar M (2007) Ngn2 and Nurr1 act in synergy to induce midbrain dopaminergic neurons from expanded neural stem and progenitor cells. Exp Cell Res 313: 1172–80.
44. Kele J, Simplicio N, Ferri AL, Mira H, Guillemot F, et al. (2006) Neurogenin 2 is required for the development of ventral midbrain dopaminergic neurons. Development 133: 495–505.
45. Sun Y, Nadal-Vicens M, Misono S, Lin MZ, Zubiaga A, et al. (2001) Neurogenin promotes neurogenesis and inhibits glial differentiation by independent mechanisms. Cell 104: 365–76.
46. Tripodi M, Filosa A, Armentano M, Studer M The (2004) COUP-TF nuclear receptors regulate cell migration in the mammalian basal forebrain. Develop-ment 131: 6119–29.
47. Perrone-Capano C, Tino A, di Porzio U (1994) Target cells modulate dopamine transporter gene expression during brain development. Neuroreport 5: 1145–8. 48. Pernas-Alonso R, Morelli F, di Porzio U, Perrone-Capano C (1999) Multiplex semi-quantitative reverse transcriptase-polymerase chain reaction of low abundance neuronal mRNAs. Brain Res Brain Res Protoc 4: 395–406. 49. Steel MC, Buckley NJ (1993) Differential regulation of muscarinic receptor
mRNA levels in neuroblastoma cells by chronic agonist exposure: a comparative polymerase chain reaction study. Mol Pharmacol 43: 694–701.
50. Gautier L, Cope L, Bolstad BM, Irizarry RA (2004) affy - analysis of Affymetrix GeneChip data at the probe level. Bioinformatics 20: 307–315.
51. Parman C, Halling C (2008) affyQCReport: A Package to Generate QC Reports for Affymetrix Array Data.
52. Irizarry RA, Hobbs B, Collin F, Beazer-Barclay YD, Antonellis KJ, et al. (2003) Exploration, normalization, and summaries of high density oligonucleotide array probe level data. Biostatistics 4: 249–264.
53. Smyth GK (2005) Limma: linear models for microarray data. In: Gentleman R, Carey V, Dudoit S, Irizarry R, Huber W, eds. Bioinformatics and Computational Biology Solutions using R and Bioconductor. New York: Springer. pp 397–420.
54. Benjamini Y, Hochberg Y (1995) Controlling the false discovery rate—a practical and powerful approach to multiple testing. J R Stat Soc Ser B 57: 289–300.