CPD
11, 5021–5048, 2015Early westward flow across the Tasman
Gateway
W. P. Sijp et al.
Title Page
Abstract Introduction
Conclusions References
Tables Figures
◭ ◮
◭ ◮
Back Close
Full Screen / Esc
Printer-friendly Version Interactive Discussion
Discussion
P
a
per
|
Discussion
P
a
per
|
Discussion
P
a
per
|
Discussion
P
a
per
|
Clim. Past Discuss., 11, 5021–5048, 2015 www.clim-past-discuss.net/11/5021/2015/ doi:10.5194/cpd-11-5021-2015
© Author(s) 2015. CC Attribution 3.0 License.
This discussion paper is/has been under review for the journal Climate of the Past (CP). Please refer to the corresponding final paper in CP if available.
Early westward flow across the Tasman
Gateway
W. P. Sijp1, A. S. von der Heydt2, and P. K. Bijl3
1
ARC Centre of Excellence for Climate System Science, University of New South Wales, Sydney, NSW 2052, Australia
2
Institute for Marine and Atmospheric Research, Centre for Extreme Matter and Emergent Phenomena, Utrecht University, Princetonplein 5, 3584 CC Utrecht, the Netherlands
3
Marine Palynology and Paleoceanography, Laboratory of Palaeobotany and Palynology, Department of Earth Sciences, Faculty of Geoscience, Utrecht University. P.O. Box 80.115, 3508 TC Utrecht, the Netherlands
Received: 10 July 2015 – Accepted: 9 October 2015 – Published: 29 October 2015 Correspondence to: W. P. Sijp ([email protected])
CPD
11, 5021–5048, 2015Early westward flow across the Tasman
Gateway
W. P. Sijp et al.
Title Page
Abstract Introduction
Conclusions References
Tables Figures
◭ ◮
◭ ◮
Back Close
Full Screen / Esc
Printer-friendly Version Interactive Discussion
Discussion
P
a
per
|
Discussion
P
a
per
|
Discussion
P
a
per
|
Discussion
P
a
per
|
Abstract
The timing and role in ocean circulation and climate of the opening of Southern Ocean gateways is as yet elusive. Recent micropaleontological studies suggest the onset of throughflow of surface waters from the SW Pacific into the Australo-Antarctic Gulf through a southern shallow opening of the Tasman Gateway from 49–50 Ma onwards.
5
Here, we present the first model results specific to the early-to-middle Eocene where, in agreement with the field evidence, southerly shallow opening of the Tasman Gateway indeed causes a westward flow across the Tasman Gateway. As a result, modelled estimates of dinoflagellate biogeography are in agreement with the recent findings. Crucially, in this situation where Australia is still situated far south and almost attached
10
to Antarctica, the Drake Passage must be sufficiently restricted to allow the prevailing easterly wind pattern to set up this southerly restricted westward flow. In contrast, an open Drake Passage, to 517 m depth, leads to an eastward flow, even when the Tas-man Gateway and the Australo-Antarctic gulf are entirely contained within the latitudes of easterly wind.
15
1 Introduction
The different positions of large continents on the Southern Hemisphere influenced the oceanography of the Eocene, and therewith the distribution of heat. The position of Australia and South America in the Eocene was much closer to Antarctica than today (e.g. Cande and Stock, 2004). This arguably prevented circumpolar surface water flow
20
(Huber et al., 2004; Bijl et al., 2011, 2013), the Antarctic Circumpolar Current (ACC), that thermally isolates Antarctica today (Toggweiler and Bjornsson, 2000; Sijp and Eng-land, 2004). Instead, it was thought that low-latitude currents bathed Antarctic coast-lines. Subsequent opening of a circumpolar passage, through deepening of the Drake Passage (DP) and Tasman Gateway (TG), would then allow the ACC to develop,
lead-25
CPD
11, 5021–5048, 2015Early westward flow across the Tasman
Gateway
W. P. Sijp et al.
Title Page
Abstract Introduction
Conclusions References
Tables Figures
◭ ◮
◭ ◮
Back Close
Full Screen / Esc
Printer-friendly Version Interactive Discussion
Discussion
P
a
per
|
Discussion
P
a
per
|
Discussion
P
a
per
|
Discussion
P
a
per
|
of Antarctica (Kennett, 1977). Support for this hypothesis came when it was discovered that the deep opening of these gateways appeared to be roughly coeval with the onset of continental-scale Antarctic glaciation around the Eocene/Oligocene transition (EOT, about 34 million years ago, Ma, Barrett, 1996).
Objections to the gateway hypothesis came from two fields of research. First of all,
5
Drill cores obtained from the Tasman Gateway region showed that accelerated widen-ing and deepenwiden-ing of the passage likely started 2 Ma prior to the glaciation, indicatwiden-ing that a direct causal link between the two is unlikely (Stickley et al., 2004). Unlike the quite precise estimates for the opening of the Tasman Gateway, the timing of the open-ing of Drake Passage is debated and less well constrained (Barker and Burrell, 1977;
10
Livermore et al., 2004; Scher and Martin, 2006; Pfuhl and McCave, 2005). Several structural geologic investigations in the region have inferred crustal stretching from the early Eocene onwards (Lagabrielle et al., 2009; Ghiglione et al., 2008), but it remains elusive whether the vertical displacement of that tectonism caused a shallow passage-way through the Drake Passage. We cannot, however, rule out the possibility that Drake
15
Passage was already open yet shallow in the early Eocene.
Secondly, numerical modeling studies with General Circulation Models (GCMs) con-figured for the Eocene emerged that suggested an ocean circulation pattern with clock-wise circulating gyres (Sloan et al., 1995; Huber and Sloan, 2001; Huber et al., 2004), where western boundary currents near Antarctica (as part of a subpolar gyre) still
pre-20
vented low-latitude currents to reach and warm Antarctica (a general feature of sub-polar gyres). Microfossil biogeography studies (notably, but not exclusively done on organic-walled dinoflagellate cysts) clearly support the gyre configuration as suggested by numerical modeling experiments (Huber et al., 2004; Bijl et al., 2011), rather than the strong influence of low-latitude-derived ocean currents. It should be noted here that
25
CPD
11, 5021–5048, 2015Early westward flow across the Tasman
Gateway
W. P. Sijp et al.
Title Page
Abstract Introduction
Conclusions References
Tables Figures
◭ ◮
◭ ◮
Back Close
Full Screen / Esc
Printer-friendly Version Interactive Discussion
Discussion
P
a
per
|
Discussion
P
a
per
|
Discussion
P
a
per
|
Discussion
P
a
per
|
The existing proxy records for atmospheric CO2during the Paleogene (Pagani et al., 2005; Pearson et al., 2009; Beerling and Royer, 2011) and ice sheet modeling (De-Conto and Pollard, 2003; De(De-Conto et al., 2008) have steered opinion in the direction of declining atmospheric greenhouse gas concentrations as the primary forcing factor in explaining Eocene cooling in general and, ultimately, the onset of continental-scale
5
glaciation.
Although gateway changes appear not to be the direct cause of EOT glaciation, unlike the hypothesis first posed by Kennett (1977); Kennett and Shackleton (1976), their role in the general long-term Cenozoic cooling trend remains plausible (Stickley et al., 2004; Bijl et al., 2013; Sijp et al., 2014), but poorly reconciled. Indeed,
glacia-10
tion (34 Ma) took place against the backdrop of a long and gradual cooling trend in the Southern Ocean (Bijl et al., 2009), whereas detailed geological reconstructions of the Tasman Gateway have, until recently (Bijl et al., 2013), largely ignored the poten-tial climatic effects of earlier stages of its opening. Immediately preceding this slow climatic deterioration is a time with the warmest global temperatures of the past 85
15
million years, the protracted greenhouse episode known as the Early Eocene Climatic Optimum (EECO, 52–50 Ma Zachos et al., 2001a). Whereas it is generally conceived that a decline in atmospheric greenhouse gas concentrations terminated the EECO, compelling direct and unequivocal proxy evidence for this is generally lacking.
As a contrasting hypothesis, Bijl et al. (2013) find evidence for the first signs of
20
throughflow of South West (SW) Pacific surface waters into the Australo-Antarctic gulf (AAG) across the Tasman Gateway to coincide with the onset of regional surface water and continental Antarctic cooling of 2–4◦C. Bijl et al. (2013) infer from the distinct di
ff er-ence in dinocyst assemblages between the AAG and the SW Pacific that the Tasman Gateway served as an effective barrier to surface water exchange before 50 Ma. From
25
CPD
11, 5021–5048, 2015Early westward flow across the Tasman
Gateway
W. P. Sijp et al.
Title Page
Abstract Introduction
Conclusions References
Tables Figures
◭ ◮
◭ ◮
Back Close
Full Screen / Esc
Printer-friendly Version Interactive Discussion
Discussion
P
a
per
|
Discussion
P
a
per
|
Discussion
P
a
per
|
Discussion
P
a
per
|
(52–48 Ma Close et al., 2009; Hill and Exon, 2004). Surface water throughflow of SW Pacific surface waters into the AAG would bring the endemic Antarctic species into the AAG. A crucial observation here is that the south Australian margin remains iso-lated from the SW Pacific influence but remains exclusively inhabited by cosmopolitan and low-latitude-derived dinocyst species. Furthermore, the influence of surface water
5
throughflow from the AAG into the Southwest Pacific remains restricted as well: no low-latitude-derived species appear in the SW Pacific Ocean. Therefore, as they hy-pothesize, the througflow must have occurred south, within the reach of the easterlies, allowing throughflow of the taxa that consistently dominate the westward flow along Antarctica, the Eocene “Antarctic Counter Current”. Organic biomarker proxy records
10
for paleotemperature of the sea surface and the air temperature derived from the same sedimentary archives as where the oceanographic reconstructions were derived from show that the opening of the Tasmanian Gateway coincided with surface water and air temperature cooling of several degrees (2–4◦), of which the Antarctic hinterland cooled
the most (4◦). Simultaneously, benthic foraminiferal oxygen isotope records show the 15
onset of gradual cooling as well. Although this study could not prove causality between oceanographic changes and cooling, the closeness in time is intriguing, and requires follow-up to prove causality.
The uncertainty related to the role of gateways in long-term climate evolution, as well as the increasing need for more detailed knowledge of Cenozoic ocean current
devel-20
opment in general, stimulates modeling studies on the impact of gateway changes on ocean circulation through time. Here, we will use a coupled climate model of intermedi-ate complexity (Sijp et al., 2011) to numerically simulintermedi-ate the effect of an initial opening of the Tasman Gateway at the early-to-middle Eocene transition. We show that this can lead to the inferred patterns (Bijl et al., 2013) of dinoflagellate biogeography: a
west-25
CPD
11, 5021–5048, 2015Early westward flow across the Tasman
Gateway
W. P. Sijp et al.
Title Page
Abstract Introduction
Conclusions References
Tables Figures
◭ ◮
◭ ◮
Back Close
Full Screen / Esc
Printer-friendly Version Interactive Discussion
Discussion
P
a
per
|
Discussion
P
a
per
|
Discussion
P
a
per
|
Discussion
P
a
per
|
2 Model and Experimental Design
We use a modified version of the intermediate complexity coupled model described in detail in Weaver et al. (2001), the so-called UVic model. The model consists of an ocean general circulation model (GFDL MOM Version 2.2, Pacanowski, 1995) cou-pled to a simplified one-layer energy-moisture balance model for the atmosphere and
5
a dynamic-thermodynamic sea-ice model. Air–sea heat and freshwater fluxes evolve freely in the model, while a non-interactive wind field is employed for reasons of com-putational speed. The turbulent kinetic energy scheme of Blanke and Delecluse (1993) based on Gaspar et al. (1990) models vertical mixing due to wind and vertical velocity shear. The model is identical to Sijp et al. (2011), with a modification to the Eocene
10
geography in the primary experiments where Australia is located further south by 6◦ in
latitude, and the Antarctic margin facing it is also shifted south. The original geography will also be discussed as a secondary set of experiments in the sensitivity study below. The sensitivity study of the true paleolatitude of the Tasman Gateway was also done as comparisons of Eocene paleogeographies may vary about 6◦in the SW Pacific region 15
dependent on which reference frame is used: a hotspot vs. a paleomagnetic reference frame (van Hinsbergen et al., 2015).
We have run the model to equilibrium for a period of 9000 years in 4 configurations, where the Drake Passage is open to 517 m depth and in simulations where it is closed, and where in each case the Tasman Gateway is open, to a shallow depth of around
20
CPD
11, 5021–5048, 2015Early westward flow across the Tasman
Gateway
W. P. Sijp et al.
Title Page
Abstract Introduction
Conclusions References
Tables Figures
◭ ◮
◭ ◮
Back Close
Full Screen / Esc
Printer-friendly Version Interactive Discussion
Discussion
P
a
per
|
Discussion
P
a
per
|
Discussion
P
a
per
|
Discussion
P
a
per
|
3 Results
The latitudinal section of the zonal velocity through the TG gap for the DP closed case is shown in Fig. 1a and the DP open case in Fig. 2a. In the simulation with the South-ern Tasman Gateway open, a closed DP leads to a westward flow throughout the water column near Antarctica, and shallower eastward flow to the north (Fig. 1a). In contrast,
5
the flow is eastward throughout the gap when the DP is open (Fig. 2a). In this simula-tion, the eastward flow is weak throughout most of the gap, but strong at its northern margin.
To examine the sensitivity of these results to boundary conditions, we have con-ducted two additional simulations where the core of the Southern Hemisphere (SH)
10
westerlies is shifted 6◦N, the TG is open, and the DP is open and closed (thus yielding
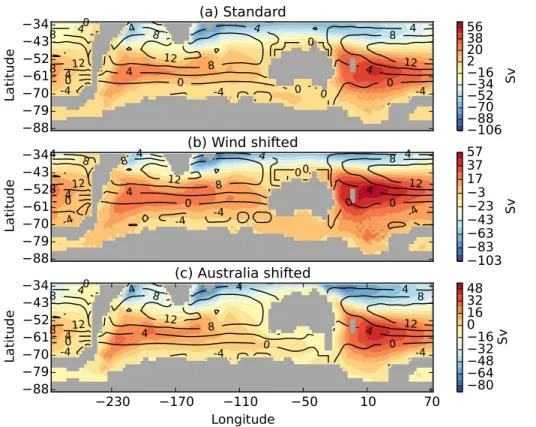
two simulations). For reference, we show the zonal wind stress overlaid on the horizon-tal stream function in Fig. 3: the average latitude of maximum westerly wind stress (zero wind stress curl) is 50◦S in the standard case, and 44◦S latitude in the wind shifted
case. This wind shifting procedure is essentially equivalent to Sijp and England (2009),
15
and we refer to this work for reference. We will refer to the original simulations without the modification as the “standard” case. In this modified model configuration, the flow pattern (Fig. 1b) is very similar to the standard case with DP closed (Fig. 1a). Simi-larly, in the DP open case, the flow pattern remains eastward throughout the TG gap, again with weak flow through most of the gap, with the exception of the northern
mar-20
gin (Fig. 2b). Note that, in contrast to the corresponding standard simulation (Fig. 2a), there is weak westward flow in a very narrow band below 250 m depth; nonetheless, the general flow is overwhelmingly eastward.
In further addition, we have also conducted two simulations, again with the TG open and DP open and closed, but now with altered geography. Here, the Australian
conti-25
nent is shifted north by 6◦ latitude with respect to our standard simulation, along with
CPD
11, 5021–5048, 2015Early westward flow across the Tasman
Gateway
W. P. Sijp et al.
Title Page
Abstract Introduction
Conclusions References
Tables Figures
◭ ◮
◭ ◮
Back Close
Full Screen / Esc
Printer-friendly Version Interactive Discussion
Discussion
P
a
per
|
Discussion
P
a
per
|
Discussion
P
a
per
|
Discussion
P
a
per
|
at the location of Tasmania, in agreement with Bijl et al. (2013). Again, a similar flow pattern emerges, where flow is eastward throughout the TG gap in the DP open case (Fig. 2c), while there is a westward current near Antarctica in the DP closed case (Fig. 1c). We conclude from our four additional simulations that our results are robust with respect to the location of the major wind circulation patterns and geography.
5
From here on, we will focus on the standard simulations. First, we examine the oceanic horizontal circulation. With DP closed, the circulation of the Southern Ocean is split into two subpolar clockwise gyres, the “Ross Sea gyre“ to the east of Australia, and a “Weddell gyre” spanning the (south) Indian and Atlantic oceans to the east of DP. To the north lie the subtropical gyres, where a super-gyre spans the Indian and
10
Pacific oceans. In agreement with the Sverdrup balance, eastward flow takes place at the latitudes of positive wind stress curl (approximately minus the latitudinal derivative of the wind stress shown in Fig. 3). A proto ACC is absent due to the closure of the DP. Practically all eastward flow that passes Australia does so to the north of the continent, and is part of the southern branch of the subtropical super-gyre.
15
Eastward flow in the northern branches of the subpolar gyres generally terminates by returning south along the western margins of Australia and South America when the DP is closed (Fig. 1a). A discussion of the possibility of a linkage between the two subpolar gyres, using additional simulations with another model, can be found in the Appendix. Although the barotropic streamfunction shows no flow at the selected contour interval,
20
the velocity field indicates a westward flow in the Tasman Gateway closely restricted to the Antarctic margin, naturally consistent with Fig. 1a. This westward flow through the TG is consistent with the generally negative wind stress curl at these latitudes.
An open DP under otherwise early Eocene boundary conditions yields around 35 Sv flow through this gap, as read from the 5 Sv interval contours immediately west of the
25
CPD
11, 5021–5048, 2015Early westward flow across the Tasman
Gateway
W. P. Sijp et al.
Title Page
Abstract Introduction
Conclusions References
Tables Figures
◭ ◮
◭ ◮
Back Close
Full Screen / Esc
Printer-friendly Version Interactive Discussion
Discussion
P
a
per
|
Discussion
P
a
per
|
Discussion
P
a
per
|
Discussion
P
a
per
|
Australia. This total of 35 Sv of flow constitutes a circumpolar flow component that is not part of the gyre structure and is reminiscent of the ACC, despite the lack of latitudinal alignment of the gateways. We stress that this flow is much weaker than today and not comparable, even qualitatively. Nonetheless, we will refer to this current as the “proto ACC”. As such, the uniformly eastward flow through the TG can be viewed as a
conse-5
quence of the flow through the DP gap, that joins the eastward flow along the northern branch of the Weddell gyre that must split to flow around Australia, yielding a south-ern component. In addition, when opening Drake Passage, there is less necessity for signficant westward return flow in the subpolar gyres. Indeed, high resolution ocean model simulations have shown that closing the DP forces the ACC water to mainly turn
10
southwards and join the subpolar gyres (unpublished results). The circumpolar flow is in line with idealized ocean modeling studies suggesting that strong circumpolar flow is possible even without a fully unrestricted latitude band (Munday et al., 2015). This eastward flow occurs entirely within the latitudes of the polar easterlies in the model (Fig. 3), and within the latitudes of negative wind stress curl (with a small exception in
15
the wind shifted case). This shows that the direction of the flow is not only determined by the wind field, but also by the continental geometry.
3.1 Dinoflagellate biogeography and ocean circulation
To examine links between Eocene ocean circulation and dinoflagellate biogeography, we conduct several decadal time scale simulations, starting from model equilibria,
20
where a passive tracer (i.e. not interacting with the ocean flow and representing small entities that do not move on their own accord) is released at two locations, one south-east and one west of Australia. We assume here that the current velocities of the sur-face water dominate the active swim velocities of the dinoflagellates themselves. Either way, surface sediment analyses in the North Atlantic show clear dominance of specific
25
CPD
11, 5021–5048, 2015Early westward flow across the Tasman
Gateway
W. P. Sijp et al.
Title Page
Abstract Introduction
Conclusions References
Tables Figures
◭ ◮
◭ ◮
Back Close
Full Screen / Esc
Printer-friendly Version Interactive Discussion
Discussion
P
a
per
|
Discussion
P
a
per
|
Discussion
P
a
per
|
Discussion
P
a
per
|
Again, we perform two sets of simulations: a first set with DP closed and open/closed TG and a second set where DP is open and the TG is open/closed. The results of the tracer simulations are shown in Figs. 5 and 6, respectively, where the sites of release of the tracer is marked by an ellipse. The tracer is interpreted as a fractional dinoflagellate concentration, and its subsequent dispersal allows an estimate of expected
dinoflagel-5
late biogeography based on ocean flow alone. The initial condition for the tracer con-sists of the instantaneous insertion of a (rotationally symmetric) Gaussian distribution of tracer in the horizontal direction of amplitude 1 (the tracer concentration is close to fraction 1, or 100 %, at the core of the anomaly) and a horizontal standard deviation of several model grid cells, allowing tracer concentration to approach zero away from the
10
core, and similarly rapidly decreasing concentrations with depth according to a smaller standard deviation appropriate to the vertical scale.
First, we examine four simulations where the DP remains closed. Perhaps as might be expected, unable to cross the TG and lacking alternative routes, tracer “species” remain on the side of the TG where they were released when the TG remains closed
15
(Fig. 5a, b). However, when the TG is open, tracer “species” released from the west of Australia (Fig. 5c) enter the AAG along the Australian coast, but eventually do not proceed into the Ross Sea, east of the open TG. Instead, concentrations are focussed along the Antarctic coast in the South Atlantic (and west of the AAG). This is due to the westward flow along Antarctica there and in the AAG (Figs. 4 and 1). Westward
prop-20
agation along the Antarctic coast of dinoflagellate tracer released east of the TG in the open TG configuration is evidenced by the locally enhanced tracer concentrations along the Antarctic coast of the AAG in Fig. 5d. This is also because of the westward flow through the TG (Fig. 4). The biogeography that can be inferred from our results is in agreement with Bijl et al. (2013), who infer that lower-latitude taxa that are abundant
25
CPD
11, 5021–5048, 2015Early westward flow across the Tasman
Gateway
W. P. Sijp et al.
Title Page
Abstract Introduction
Conclusions References
Tables Figures
◭ ◮
◭ ◮
Back Close
Full Screen / Esc
Printer-friendly Version Interactive Discussion
Discussion
P
a
per
|
Discussion
P
a
per
|
Discussion
P
a
per
|
Discussion
P
a
per
|
region. This absence of relationship between environmental factors and biogeography is particularly convenient since Bijl et al. (2011) also showed that the onset of regional dominance of endemic dinocysts in the SW Pacific Ocean was unrelated to surface water temperature. Also in agreement with field evidence (Bijl et al., 2013) is the west-ward propagation of SW Pacific tracer “species” into the AAG in response to gateway
5
opening, and the restriction of that propagation to the Antarctic coast of the AAG. Second, to elucidate the role of the DP in our dinoflagellate tracer results, we per-formed versions of the above described second set of tracer simulations where the DP is now consistently open (Fig. 6). Similar to the DP closed scenario and perhaps triv-ially, when DP is open and the TG remains closed, species released at both sides of
10
the TG land bridge remain on their corresponding side of that land bridge (Fig. 6a, b), although very small concentrations penetrate north of Australia via flow through the open DP. When the TG is open, tracer released to the west of Australia (Fig. 6c) en-ters the AAG. However, unlike the DP closed case, tracer now penetrates well into the Ross Sea. This is because of the eastward flow through the open TG that is part of
15
a proto ACC flowing through the open DP (Figs. 4 and 2). This effect is much in dis-agreement with field evidence, as dinocyst assemblages in the SW Pacific only show a low-latitude affinity when the Tasmanian Gateway deepens at 35.5 Ma, and none of that is seen before.
Some westward propagation along the Antarctic coast of dinoflagellate tracer
re-20
leased east of the TG in the open TG configuration is evidenced by the low but dis-cernible tracer concentrations along the Antarctic coast of the AAG (Fig. 6d, compare to Fig. 5d: note the smaller scale in the latter), while most of the tracer flows north, along the east coast of Australia, in the Ross Sea gyre. In conclusion, the tracer dis-persion patterns in the DP open case are not in agreement with Bijl et al. (2013), as
25
CPD
11, 5021–5048, 2015Early westward flow across the Tasman
Gateway
W. P. Sijp et al.
Title Page
Abstract Introduction
Conclusions References
Tables Figures
◭ ◮
◭ ◮
Back Close
Full Screen / Esc
Printer-friendly Version Interactive Discussion
Discussion
P
a
per
|
Discussion
P
a
per
|
Discussion
P
a
per
|
Discussion
P
a
per
|
3.2 Temperature changes in response to gateway opening
The opening of the TG in our model configuration where the DP remains closed leads to no significant sea surface temperature cooling (Fig. 7). This is in contrast to the hy-pothesis of Bijl et al. (2013) that the cooling seen in their field evidence of surface water and regional air temperature reconstructions is a direct result of gateway changes and
5
the ensuing changes in ocean currents. Alternative model experiments, where deep sinking in the Ross Sea is suppressed by an artificial fresh water flux added via the model computer code, yield a sea surface temperature cooling with a localized max-imum of around 4◦C in the AAG and weaker sea surface temperature cooling with
a maximum of around 1◦C along the Antarctic coast west of the AAG, and weaker 10
overall SAT cooling (figure not shown). This suggests that the hypothetical scenario of AAG cooling in response to gateway opening requires a cool Ross Sea, and there-fore no deep sinking there. Nonetheless, our primary model simulations do no support a direct cooling effect of gateway opening, suggesting other causes for the inferred cooling. Furthermore, none of our experiments, including those with Ross Sea sinking
15
suppressed, show significant deep or mid ocean cooling. However, again, we note that the AAG cooling of up to 4◦C in the (alternative) Ross Sea sinking suppressed
simu-lations (figure not shown) is more in agreement with Bijl et al. (2013)’s hypothesis. We suggest that future climate modeling work could shed further light on the relationship between Antarctic temperature changes and the gateway changes.
20
4 Summary and conclusions
Our model results provide a numerical underpinning of the recent field observations and interpretations of Bijl et al. (2013) that a southerly opening of the Tasman Gateway causes throughflow of SW Pacific surface waters into the AAG. For the first time, we reproduce a westward propagation of oceanic properties and species originating east
25
CPD
11, 5021–5048, 2015Early westward flow across the Tasman
Gateway
W. P. Sijp et al.
Title Page
Abstract Introduction
Conclusions References
Tables Figures
◭ ◮
◭ ◮
Back Close
Full Screen / Esc
Printer-friendly Version Interactive Discussion
Discussion
P
a
per
|
Discussion
P
a
per
|
Discussion
P
a
per
|
Discussion
P
a
per
|
dinocyst species originating in the SW Pacific into the southern margin of the AAG, but not the northern margin. This is consistent with our finding that the westward current is restricted to the southern margin of the AAG. Also consistent with micropaleonto-logical observations, no low-latitude-derived species (released west of Australia in our simulations) could be routed via the TG to appear in the SW Pacific Ocean upon its
5
opening.
Importantly, our model results indicate that the waters of the DP, or upstream or downstream areas close to it, are likely to have been obstructed to large-scale geostrophic flow during the early Eocene, as the passive tracer experiments in a sce-nario with a closed DP are much more consistent with microfossil evidence compared
10
to a scenario with an open DP. Lagabrielle et al. (2009); Ghiglione et al. (2008); Eagles (2003); Livermore et al. (2005); Eagles et al. (2005); Livermore et al. (2007) infer a pro-gressive opening of the Drake Passage, through continental extensional tectonics and oceanic spreading (Eagles et al., 2006), after about 50 Ma from analysis of seafloor magnetic anomalies in the Scotia Sea and adjoining oceanic areas. This timing
sug-15
gests that the DP may have been sufficiently obstructed to prevent an ACC.
As said, our results do not strictly dictate an absence of flow through the DP, but rather suggest that the results of (Bijl et al., 2013), and their inference of an Antarctic Counter Current, are point to severe obstructions to a wide and deep flow through DP and nearby areas at similar latitudes. This could be any significant bathymetric
obstruc-20
tions to circum-polar flow, not only closure of the DP. For instance, model results by Hill et al. (2013) indicate that, regardless of the state of the DP and TG, a coherent ACC was not possible during for instance the Oligocene (a period much later than under study here) due to the Australasian paleogeography, although no inferences are made for the Eocene. Future work on these obstructions is therefore important. Finally, our
25
CPD
11, 5021–5048, 2015Early westward flow across the Tasman
Gateway
W. P. Sijp et al.
Title Page
Abstract Introduction
Conclusions References
Tables Figures
◭ ◮
◭ ◮
Back Close
Full Screen / Esc
Printer-friendly Version Interactive Discussion
Discussion
P
a
per
|
Discussion
P
a
per
|
Discussion
P
a
per
|
Discussion
P
a
per
|
ocean dynamics background to the finding of (Bijl et al., 2013) and other studies that point to this current.
Appendix
As the position of Australia plays an important role in whether the subtropical and sub-polar gyres of the Indian (and Pacific) oceans pass that continent northward or
south-5
ward, we performed additional simulations with (1) another ocean model and (2) a dif-ferent reconstruction of the continental geometry. We use the Parallel Ocean Program (POP) developed at Los Alamos Laboratory Dukowicz and Smith (1994) at a nominal horizontal resolution of 1◦
×1◦and 40 vertical levels. The model was adapted to a late
Eocene reconstruction of the continental geometry and bathymetry Rugenstein et al.
10
(2014) and forced with the atmospheric state of a coupled climate model simulation using the Community Earth System model (CESM) Goldner et al. (2014). Compared to the continental geometry in the UVic simulations of the main paper, Australia extends substantially further north in this configuration as it represents the late Eocene or early Oligocene rather than the middle Eocene. The model is run for 570 years in two
config-15
urations: the late Eocene control case, where the Tasman gateway is open and Drake Passage is almost closed (35 m deep) and a second case where a land bridge is build in the Tasman gateway from Tasmania to Antarctica. The throughflow through Drake Passage is very small, so we can consider DP closed in these simulations. We show results averaged over the last 10 years of simulation.
20
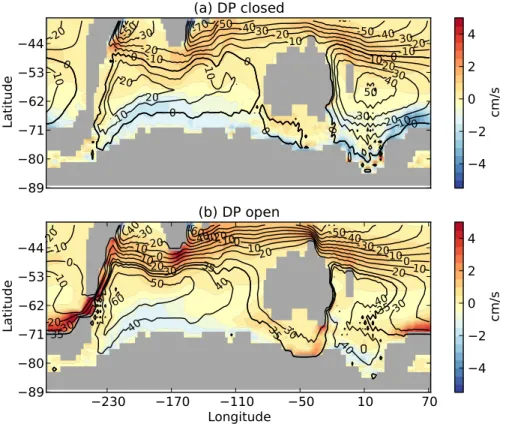
Figure 8 shows the vertically averaged zonal velocity for the two cases, with coun-tours of sea surface height (SSH) overlain. The SSH can be regarded as similar to the barotropic stream function as it represents the barotropic flow. In general, the POP simulations show very similar features as the (coarser) UVic-simulations shown in the main part of the paper. The model is forced by the same wind pattern as the UVic
25
CPD
11, 5021–5048, 2015Early westward flow across the Tasman
Gateway
W. P. Sijp et al.
Title Page
Abstract Introduction
Conclusions References
Tables Figures
◭ ◮
◭ ◮
Back Close
Full Screen / Esc
Printer-friendly Version Interactive Discussion
Discussion
P
a
per
|
Discussion
P
a
per
|
Discussion
P
a
per
|
Discussion
P
a
per
|
therefore, effectively blocking the eastward flow at the boundary between the suptrop-ical and subpolar gyres. As a result, less flow is passing north of Australia from the Indian to the Pacific Ocean, but a substantial part of this flow also passes south of Australia, thereby inducing considerable eastward flow in the Tasman gateway when open (Fig. 8b). In a vertical section through the Tasman gateway (Fig. 9) this becomes
5
evident as a strong and deep-reaching eastward current in the central-northern part of the gateway, while a weak westward current at the Antarctic margin remains. This gives further support for the notion that, if the DP is sufficiently obstructed, the east-ward flow at the boundary between the subtropical and subpolar gyres returns mostly in the subpolar gyres, i.e., along the Antarctic margin.
10
Acknowledgements. We thank the University of Victoria stafffor support in usage of the their coupled climate model. This research was supported by the Australian Research Council (ARC). This work contributes to ARC project DP1096144 held by WPS and ALW 802.01.024 of the Netherlands Organization for Scientific Research (NWO), Earth and Life Sciences. The POP-computations where done on the Cartesius computer at SURFsara in Amsterdam. The
15
use of the SURFsara computing facilities was sponsored by NWO under the project SH-209-14. PKB acknowledges NWO-ALW for VENI grant number 863.13.002. Figures were produced with the Spacegrids Python data analysis module.
References
Barker, P. F. and Burrell, J.: The opening of Drake Passage, Mar. Geol., 25, 15–34, 1977. 5023
20
Barrett, P. J.: Antarctic paleoenvironment through Cenozoic times – a review, Terra Antarctica, 3, 103–119, 1996. 5023
Beerling, D. J. and Royer, D. L.: Convergent Cenozoic CO2history, Nat. Geosci., 4, 418–420, 2011. 5024
Bijl, P. K., Schouten, S., S., and Sluijs, A.: Early Palaeogene temperature evolution of the
South-25
west Pacific Ocean, Nature, 461, 776–779, 2009. 5024
CPD
11, 5021–5048, 2015Early westward flow across the Tasman
Gateway
W. P. Sijp et al.
Title Page
Abstract Introduction
Conclusions References
Tables Figures
◭ ◮
◭ ◮
Back Close
Full Screen / Esc
Printer-friendly Version Interactive Discussion
Discussion
P
a
per
|
Discussion
P
a
per
|
Discussion
P
a
per
|
Discussion
P
a
per
|
Paleogene Southern Ocean dinoflagellate biogeography, Paleoceanography, 26, PA1202, doi:10.1029/2009PA001905, 2011. 5022, 5023, 5031
Bijl, P. K., Bendle, J. A. P., Bohaty, S. M., Pross, J., Schouten, S., Tauxe, L., Stickley, C. E., McKay, R. M., Röhl, U., Olney, M., Sluijs, A., Escutia, C., and Brinkhuis, H.: Eocene cooling linked to early flow across the Tasmanian Gateway, P. Natl. Acad. Sci. USA, 10, 9645–9650,
5
2013. 5022, 5024, 5025, 5028, 5030, 5031, 5032, 5033, 5034
Blanke, B. and Delecluse, P.: Variability of the tropical Atlantic Ocean simulated by a general circulation model with two different mixed-layer physics., J. Phys. Oceanogr., 23, 1363–1388, 1993. 5026
Cande, S. C. and Stock, J. M.: Pacific–Antarctic–Australia motion and the formation of the
10
Macquarie Plate, Geophys. J. Int., 157, 399–414, 2004. 5022
Close, D. I., Watts, A. B., and Stagg, H. M. J.: A marine geophysical study of the Wilkes Land rifted continental margin, Antarctica, Geophys. J. Int., 177, 430–450, 2009. 5025
DeConto, R. M. and Pollard, D.: Rapid Cenozoic glaciation of Antarctica induced by declining atmospheric CO2, Nature, 421, 245–248, 2003. 5024
15
DeConto, R. M., Pollard, D., Wilson, P. A., Pälike, H., Lear, C. H., and Pagani, M.: Thresholds for Cenozoic bipolar glaciation, Nature, 455, 652–656, 2008. 5024
Dukowicz, J. K. and Smith, R. D.: Implicit free-surface method for the Bryan-Cox-Semtner ocean model, J. Geophys. Res., 99, 7991–8014, 1994. 5034
Eagles, G.: Plate tectonics of the Antarctic-Phoenix plate system since 15 Ma., Earth Planet.
20
Sc. Lett., 88, 289–307, 2003. 5033
Eagles, G., Livermore, R. A., Fairhead, J. D., and Morris, P.: Tectonic evolution of the west Scotia Sea, J. Geophys. Res., 110, 2156–2202, doi:10.1029/2004JB003154, 2005. 5033 Eagles, G., Livermore, R. A., and Morris, P.: Small basins in the Scotia Sea: the Eocene Drake
Passage gateway, Earth Planet. Sc. Lett., 242, 343–353, 2006. 5033
25
Gaspar, P., Gregoris, Y., and Lefevre, J. M.: A simple eddy kinetic energy model for simulations of the oceanic vertical mixing: Tests at station PAPA and long-term upper ocean study site., J. Geophys. Res., 95, 16179–16193, 1990. 5026
Ghiglione, M. C., Yagupsky, D., Ghidella, M., and Ramos, V. A.: Continental stretching preceding the opening of the Drake Passage: Evidence from Tierra del Fuego, Geology, 36, 643–646,
30
CPD
11, 5021–5048, 2015Early westward flow across the Tasman
Gateway
W. P. Sijp et al.
Title Page
Abstract Introduction
Conclusions References
Tables Figures
◭ ◮
◭ ◮
Back Close
Full Screen / Esc
Printer-friendly Version Interactive Discussion
Discussion
P
a
per
|
Discussion
P
a
per
|
Discussion
P
a
per
|
Discussion
P
a
per
|
Goldner, A., Herold, N., and Huber, M.: Antarctic glaciation caused ocean circulation changes at the Eocene-Oligocene transition, Nature, 511, 574–577, doi:10.1038/nature13597, 2014. 5034
Hill, D. J., Haywood, A. M., Valdes, P. J., Francis, J. E., Lunt, D. J., Wade, B. S., and Bow-man, V. C.: Paleogeographic controls on the onset of the Antarctic circumpolar current,
Geo-5
phys. Res. Lett., 40, 5199–5204, doi:10.1002/grl.50941, 2013. 5033
Hill, P. J. and Exon, N. F.: The Cenozoic Southern Ocean: Tectonics, Sedimentation and Climate Change Between Australia and Antarctica, chap. 10, 19–42, 151, American Geophysical Union, Washington, DC, USA, 2004. 5025
Huber, M. and Sloan, L. C.: Heat transport, deep waters and thermal gradients: Coupled
simu-10
lation of an Eocene “greenhouse” climate, Geophys. Res. Lett., 28, 3481–3484, 2001. 5023 Huber, M., Brinkhuis, H., Stickley, C. E., Doos, K., Sluijs, A., Warnaar, J., Schellenberg, S. A., and Williams, G. L.: Eocene circulation of the Southern Ocean: was Antarctica kept warm by subtropical waters?, Paleoceanography, 19, PA4026, doi:10.1029/2004PA001014, 2004. 5022, 5023
15
Kennett, J. P.: Cenozoic evolution of Antarctic glaciation, the Circum Antarctic Ocean, and their impact on global paleoceanography., J. Geophys. Res., 82, 3843–3860, 1977. 5023, 5024 Kennett, J. P. and Shackleton, N. J.: Oxygen isotopic evidence for development of
psychro-sphere 38 Myr ago., Nature, 260, 513–515, 1976. 5024
Lagabriellea, Y., Goddúris, Y., Donnadieu, Y., Malavieille, J., and Suarez, M.: The tectonic
his-20
tory of Drake Passage and its possible impacts on global climate, Earth Planet. Sc. Lett., 279, 197–211, 2009. 5023, 5026, 5033
Livermore, R., Eagles, R., Morris, G., and Maldonado, P. A.: Shackleton fracture zone: no barrier to early circumpolar circulation, Geology, 32, 797–800, 2004. 5023
Livermore, R., Nankivell, A., Eagles, G., and Morris, P.: Paleogene opening of Drake Passage,
25
Earth Planet. Sc. Lett., 236, 459–470, 2005. 5033
Livermore, R., Hillenbrand, C., Meredith, M., and Eagles, G.: Drake Passage and Cenozoic climate: An open and shut case?, Geochem. Geophy. Geosy., 8, Q01005, 2007. 5033 Munday, D. R., Johnson, H. L., and Marshall, D. P.: The role of ocean gateways in the dynamics
and sensitivity to wind stress of the early Antarctic Circumpolar Current, Paleoceanography,
30
30, 284–302, doi:10.1002/2014PA002675, 2015. 5029
CPD
11, 5021–5048, 2015Early westward flow across the Tasman
Gateway
W. P. Sijp et al.
Title Page
Abstract Introduction
Conclusions References
Tables Figures
◭ ◮
◭ ◮
Back Close
Full Screen / Esc
Printer-friendly Version Interactive Discussion
Discussion
P
a
per
|
Discussion
P
a
per
|
Discussion
P
a
per
|
Discussion
P
a
per
|
Pagani, M., Zachos, J. C., Freeman, K. H., Tripple, B., and Bohaty, S.: Marked decline in atmo-spheric carbon dioxide concentrations during the Paleogene, Science, 309, 600–603, 2005. 5024
Pearson, P. N., Foster, G. L., and Wade, B. S.: Atmospheric carbon dioxide through the Eocene-Oligocene climate transition, Nature, 461, 1110–1113, 2009. 5024
5
Pfuhl, H. A. and McCave, I. N.: Evidence for late Oligocene establishment of the Antarctic Circumpolar Current, Earth Planet. Sc. Lett., 235, 715–728, 2005. 5023
Rugenstein, M. A. A., Stocchi, P., von der Heydt, A. S., Dijkstra, H. A., and Brinkhuis, H.: Emplacement of Antarctic ice sheet mass affects circumpolar ocean flow, Global Planet. Change, 118, 16–24, 2014. 5034
10
Scher, H. D. and Martin, E. E.: Timing and climatic consequences of the opening of Drake Passage, Science, 312, 428–430, 2006. 5023
Sijp, W. P. and England, M. H.: Effect of the Drake Passage throughflow on global climate, J. Phys. Oceanogr., 34, 1254–1266, 2004. 5022
Sijp, W. P. and England, M. H.: Southern Hemisphere Westerly Wind Control over the Ocean’s
15
Thermohaline Circulation, J. Climate, 22, 1277–1286, 2009. 5027
Sijp, W. P., England, M. H., and Toggweiler, J. R.: Effect of ocean gateway changes under greenhouse warmth, J. Climate, 22, 6639–6652, 2009. 5023
Sijp, W. P., England, M. H., and Huber, M.: Effect of deepening of the Tasman Gateway on the global ocean., Paleoceanography, 26, PA4223, doi:10.1029/2011PA002143, 2011. 5023,
20
5025, 5026, 5027
Sijp, W. P., von der Heydt, A. S., Dijkstra, H. A., Flögel, S., Douglas, P., and Bijl, P. K.: The role of ocean gateways on cooling climate on long time scales, Global Planet. Change, 119, 1–22, 2014. 5024
Sloan, L. C., Walker, J. C. G., and Moore, T. C.: Possible role of oceanic heat transport in Early
25
Eocene climate, Paleoceanography, 10, 347–356, 1995. 5023
Stickley, C. E., Brinkhuis, H., Schellenberg, S. A., Sluijs, A., Röhl, U., Fuller, M., Grauert, M., Huber, M., Warnaar, J., and Williams, G. L.: Timing and nature of the deepening of the Tas-manian Gateway, Paleoceanography, 19, PA4027, doi:10.1029/2004PA001022, 2004. 5023, 5024
30
CPD
11, 5021–5048, 2015Early westward flow across the Tasman
Gateway
W. P. Sijp et al.
Title Page
Abstract Introduction
Conclusions References
Tables Figures
◭ ◮
◭ ◮
Back Close
Full Screen / Esc
Printer-friendly Version Interactive Discussion
Discussion
P
a
per
|
Discussion
P
a
per
|
Discussion
P
a
per
|
Discussion
P
a
per
|
van Hinsbergen, D. J. J., de Groot, L. V., and van Schaik, S. J.: A Paleolatitude Calculator for Paleoclimate Studies, PLOS one, 10, e0126946, doi:10.1371/journal.pone.0126946, 2015. 5026
Weaver, A. J., Eby, M., Wiebe, E. C., Bitz, C. M., Duffy, P. B., Ewen, T. L., Fanning, A. F., Holland, M. M., MacFadyen, A., Damon Matthews, H., Meissner, K. J., Saenko, O., Schmittner, A.,
5
Wang, H., and Yoshimori, M.: The UVic Earth System Climate Model: model description, climatology, and applications to past, present and future climates, Atmosphere-Ocean, 39, 1067–1109, 2001. 5026
Yang, S., Galbraith, E., and Palter, J.: Coupled climate impacts of the Drake Passage and the Panama Seaway, Clim. Dynam., 43, 37–52, 2013. 5023
10
Zachos, J. C., Pagani, M., Sloan, L., Thomas, E., and Billups, K.: Trends, rythms, and aberra-tions in global climate 65 Ma to present, Science, 292, 686–693, 2001. 5024
CPD
11, 5021–5048, 2015Early westward flow across the Tasman
Gateway
W. P. Sijp et al.
Title Page
Abstract Introduction
Conclusions References
Tables Figures
◭ ◮
◭ ◮
Back Close
Full Screen / Esc
Printer-friendly Version Interactive Discussion
Discussion
P
a
per
|
Discussion
P
a
per
|
Discussion
P
a
per
|
Discussion
P
a
per
|
Figure 1.Meridional section of zonal velocityu(cm s−1) inside the Tasman Gateway with Drake
CPD
11, 5021–5048, 2015Early westward flow across the Tasman
Gateway
W. P. Sijp et al.
Title Page
Abstract Introduction
Conclusions References
Tables Figures
◭ ◮
◭ ◮
Back Close
Full Screen / Esc
Printer-friendly Version Interactive Discussion
Discussion
P
a
per
|
Discussion
P
a
per
|
Discussion
P
a
per
|
Discussion
P
a
per
|
Figure 2.Meridional section of zonal velocityu(cm s−1) inside the Tasman Gateway with Drake
CPD
11, 5021–5048, 2015Early westward flow across the Tasman
Gateway
W. P. Sijp et al.
Title Page
Abstract Introduction
Conclusions References
Tables Figures
◭ ◮
◭ ◮
Back Close
Full Screen / Esc
Printer-friendly Version Interactive Discussion
Discussion
P
a
per
|
Discussion
P
a
per
|
Discussion
P
a
per
|
Discussion
P
a
per
|
Figure 3.Ocean horizontal streamfunction (Sverdrup, 1 Sv is 106m3s−1
CPD
11, 5021–5048, 2015Early westward flow across the Tasman
Gateway
W. P. Sijp et al.
Title Page
Abstract Introduction
Conclusions References
Tables Figures
◭ ◮
◭ ◮
Back Close
Full Screen / Esc
Printer-friendly Version Interactive Discussion
Discussion
P
a
per
|
Discussion
P
a
per
|
Discussion
P
a
per
|
Discussion
P
a
per
|
Figure 4.Annual and vertical average of zonal velocity (cm s−1, positive values indicate
east-ward flow) with ocean horizontal streamfunction (Sverdrup, 1 Sv is 106m3s−1) overlaid. The
CPD
11, 5021–5048, 2015Early westward flow across the Tasman
Gateway
W. P. Sijp et al.
Title Page
Abstract Introduction
Conclusions References
Tables Figures
◭ ◮
◭ ◮
Back Close
Full Screen / Esc
Printer-friendly Version Interactive Discussion
Discussion
P
a
per
|
Discussion
P
a
per
|
Discussion
P
a
per
|
Discussion
P
a
per
|
Figure 7.Sea Surface Temperature change in response to opening the Tasman Gateway (TG). Difference TG open–closed for (a) Drake Passage (DP) closed and(b) DP open during the opening of the TG. The opening of the TG leads to a maximum of around 4.0◦C localized
CPD
11, 5021–5048, 2015Early westward flow across the Tasman
Gateway
W. P. Sijp et al.
Title Page
Abstract Introduction
Conclusions References
Tables Figures
◭ ◮
◭ ◮
Back Close
Full Screen / Esc
Printer-friendly Version Interactive Discussion
Discussion
P
a
per
|
Discussion
P
a
per
|
Discussion
P
a
per
|
Discussion
P
a
per
|
Figure 8.Annual and vertical average zonal velocity (cm s−1, positive values indicate eastward
CPD
11, 5021–5048, 2015Early westward flow across the Tasman
Gateway
W. P. Sijp et al.
Title Page
Abstract Introduction
Conclusions References
Tables Figures
◭ ◮
◭ ◮
Back Close
Full Screen / Esc
Printer-friendly Version Interactive Discussion
Discussion
P
a
per
|
Discussion
P
a
per
|
Discussion
P
a
per
|
Discussion
P
a
per
|
Figure 9.Meridional section of zonal velocityu(cm s−1) inside the Tasman Gateway for the late