www.the-cryosphere.net/6/1369/2012/ doi:10.5194/tc-6-1369-2012
© Author(s) 2012. CC Attribution 3.0 License.
The Cryosphere
Observations of enhanced thinning in the upper
reaches of Svalbard glaciers
T. D. James1, T. Murray1, N. E. Barrand2, H. J. Sykes1, A. J. Fox2, and M. A. King3 1Department of Geography, Swansea University, Swansea, UK
2British Antarctic Survey, Cambridge, UK
3School of Civil Engineering and Geosciences, Newcastle University, Newcastle upon Tyne, UK
Correspondence to:T. D. James ([email protected])
Received: 5 February 2012 – Published in The Cryosphere Discuss.: 15 March 2012 Revised: 1 November 2012 – Accepted: 2 November 2012 – Published: 20 November 2012
Abstract. Changes in the volume and extent of land ice of the Svalbard archipelago have been the subject of con-siderable research since their sensitivity to changes in cli-mate was first noted. However, the measurement of these changes is often necessarily based on point or profile mea-surements which may not be representative if extrapolated to a whole catchment or region. Combining high-resolution elevation data from contemporary laser-altimetry surveys and archived aerial photography makes it possible to mea-sure historical changes across a glacier’s surface without the need for extrapolation. Here we present a high spatial res-olution time-series for six Arctic glaciers in the Svalbard archipelago spanning 1961 to 2005. We find high variabil-ity in thinning rates between sites with prevalent elevation changes at all sites averaging −0.59±0.04 m a−1 between 1961–2005. Prior to 1990, ice surface elevation was changing at an average rate of−0.52±0.09 m a−1which decreased to
−0.76±0.10 m a−1after 1990. Setting the elevation changes against the glaciers’ altitude distribution reveals that signif-icant increases in thinning rates are occurring most notably in the glaciers’ upper reaches. We find that these changes are coincident with a decrease in winter precipitation at the Longyearbyen meteorological station and could reflect a de-crease in albedo or dynamic response to lower accumulation. Further work is required to understand fully the causes of this increase in thinning rates in the glaciers’ upper reaches. If on-going and occurring elsewhere in the archipelago, these changes will have a significant effect on the region’s future mass balance. Our results highlight the importance of under-standing the climatological context of geodetic mass balance
measurements and demonstrate the difficulty of using index glaciers to represent regional changes in areas of strong cli-matological gradients.
1 Introduction
The difficulty in generalising volume or mass balance changes to the archipelago from point or profile data is that they do not necessarily account for the ice hypsomet-ric distribution or the strong climatic gradients that prevail in Svalbard (Førland and Hanssen-Bauer, 2003). The im-portance of these parameters was recognized by Hagen et al. (2003) who applied average net balance/altitude curves derived from direct mass balance measurements, ice cores and ground penetrating radar (GPR) in 13 identified regions around the archipelago. Using data that covered the period 1969 to 1999, they measured a “slightly negative” net bal-ance (−0.014±0.003 m w.e. a−1)with the majority of loss coming from smaller mountain glaciers with higher elevation ice caps closer to balance. Advances in airborne and space-borne surveying have significantly improved the distribution of mass balance measurements to better capture regional variability. Centreline airborne laser surveys in 1996 and 2002 over 16 ice caps and glaciers revealed a complex pattern of elevation change with mean changes of−0.19 m w.e. a−1 (Bamber et al., 2005). A historical context was provided us-ing old topographic maps and aerial photographs which gave estimated mass changes of−0.30 m w.e. a−1 from the mid-1930s to 1990 in the west and southwest regions (Nuth et al., 2007); an average of−0.53 m w.e. a−1for the ice caps of the island of Edgeøya between 1970–2002 (K¨a¨ab, 2008); and
−0.36±0.02 m w.e. a−1between the 1960s and early 2000s (Nuth et al., 2010).
The mass balance results of the studies cited above vary considerably, and comparison is difficult due to differences in methodology, study area and temporal coverage. How-ever, there is general agreement that the ice of the Svalbard archipelago is significantly losing mass. While reports based on data from the 1990s and earlier found no strong evidence of atmospheric warming, more recent research suggests that rates of mass loss are increasing and that this is likely at-tributable to local climate trends (Kohler et al., 2007). How-ever, mass balance studies have been hampered by a variety of limitations including short time series, low spatial resolu-tion and/or poor distriburesolu-tion of sample sites. Recent evidence suggests that sparse direct or indirect mass balance data are not necessarily representative of regional-scale or even glacier-wide mass changes (Barrand et al., 2010; Berthier et al., 2010). As yet, no study of Svalbard mass balance has been able to provide the following simultaneously: (i) a widely spread sample of sites; (ii) multiple-decade time se-ries; (iii) over several epochs; and (iv) using high-resolution, full-width topographic data.
In this paper we combine historical aerial photographs and contemporary airborne laser altimetry (lidar) surveys to produce three to four epochs of high-resolution DEMs for six sites around Svalbard. The resulting volume change measurements are produced from tens of thousands of in-dividual change measurements for each site that typically cover the full glacier width without the need for extrapola-tion. This approach enables the detection of spatially
vari-able changes that are not necessarily represented by centre-line profiles or low-resolution studies and therefore will pro-vide improved understanding of glacier mass balance in the Svalbard archipelago.
2 Data and methods
2.1 Topographic modelling
We targeted a number of potential sites around the Sval-bard archipelago for topographic modelling. Site selection was based on spatial distribution, elevation range, aspect, and suitability for photogrammetry. Since photogrammetry is dependent on stable surfaces from which ground control points (GCPs) can be measured, potential sites were lim-ited to those whose geometry provided a sufficient distri-bution of exposed bedrock and stable depositional features. This necessitated the exclusion of the large ice cap on the islands of Nordaustlandet and Kvitøya. Aerial photographic coverage of Svalbard has been frequent but incomplete with only the 1990 campaign offering near complete coverage of the archipelago. Thus, during the site selection process we identified glaciers where at least two epochs of historic pho-tographs were available. However, because of the poor im-age quality and processing difficulty, we opted to exclude the high-oblique photographs from the 1930s. Since the meth-ods employed here cannot differentiate between climate-driven elevation changes and those from surge and tidewa-ter dynamics over these timescales, we limited sites to land-terminating, non-surge-type glaciers. Therefore, the results presented below do not account for any dynamically driven changes in glacier volume. We have also not accounted for any elevation errors due to date-offsets between the photo-graphic epochs since these errors (on the order of a meter) are negligible compared to the large changes expected over such long periods (upwards of 100 m).
Of the sites selected, high-resolution lidar surveys were successfully undertaken for 6 glaciers including Austre Brøggerbreen (AB), Albrechtbreen (AL), Grønfjordbreen (GB), Gullfaksebreen (GF), Midtre Lov´enbreen (ML) and Slakbreen (SB) (Fig. 1 and Table 1). Surveys were acquired during summer 2003 and 2005 by the Airborne Research and Survey Facility (ARSF) of the UK’s Natural Environment Research Council (NERC) using an Optech ALTM 3033 laser scanner that recorded first and last laser return and ac-companying 8-bit laser return intensity. Since AL and GF both extend into large ice caps, which are inappropriate for photogrammetry, these catchments could not be surveyed in their entirety. We estimate that our surveys cover∼35 % of the area and 65 % of the elevation range of the AL catchment based on Hagen et al. (1993) estimates. For GF we estimate
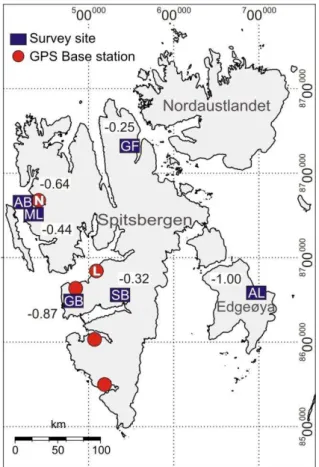
Fig. 1.Sites included in the study are Austre Brøggerbreen (AB); Albrechtbreen (AL); Grønfjordbreen (GB); Gullfaksebreen (GF); Midtre Lov´enbreen (ML); and Slakbreen (SB). GPS base station locations are shown by red circles. Numbers for each site are the
mean annual elevation change .
1hover the period of observation in m a−1. Logistical support was based at Longyearbyen (L) and
Ny-˚
Alesund (N). Meteorological data were collected at the Longyear-byen station, which was relocated∼6 km from the town site to its current airport site in 1975. The icecap island of Kvitøya is off the map located∼100 km to the east of Nordaustlandet. Map coordi-nates for this and all subsequent figures are in meters, UTM Zone 33X.
and we turn to previous studies for indications of changes at higher altitudes.
Standard post-processing of lidar data requires coincident, high-quality global positioning system (GPS) data from base stations within ∼50 km of the aircraft, which we installed and operated during the airborne campaigns (Fig. 1). Since two of our sites (AL and GF) were beyond this range, we car-ried out the aircraft GPS component of post-processing using the processing software, Track, part of the GAMIT/GLOBK package (Chen, 1998; Herring et al., 2010). This allowed us to examine the effects of errors and apply a model to account for the tropospheric zenith delay (TZD) of the GPS signals. We did this by parameterising the TZD for every measure-ment epoch within Track’s Kalman filter. For these data, the
analysis produced only negligible improvement in data qual-ity and hence the standard analysis undertaken by the Unit for Landscape Modelling, University of Cambridge, was used for all sites in this study. Resulting point clouds had a density that ranged from 1–3 points per m2.
As an initial quality control, lidar data points with low laser return intensity were checked for errors since lidar el-evation quality is highly dependent on signal-to-noise ratio (Wehr and Lohr, 1999) and thus is more likely to represent erroneous elevation measurements. Additionally, it is impor-tant to check lidar quality independently, typically against differential GPS (dGPS). Similarly to Joerg et al. (2012), who undertook a comprehensive uncertainty assessment of multi-temporal lidar datasets, lidar data were collected over a reference surface, in this case the local airport runway (L, Fig. 1), whose surface had been surveyed with dGPS. The comparison confirmed that errors were well within the man-ufacturer’s specifications of ±0.10 m. However, this com-parison did not account for any errors controlled by surface characteristics like reflectivity, slope and roughness, which required temporally coincident ground truth data. The 2005 lidar data were compared to on-ice dGPS at two sites in NW Svalbard which revealed standard deviations of 0.18 and 0.16 m at AB and ML, respectively (Barrand et al., 2010), with negligible systematic error. As these data were collected over a 6-day period around the date of lidar acquisition, they were influenced by the changing elevation of the ice surface. Therefore, for the purposes of this study, we adopt the man-ufacturer’s conservative quoted error of±0.10 m.
Historical DEMs were generated for all epochs using archived stereo aerial photography held by the Norwe-gian Polar Institute (Table 1), which were processed in the SOCET SET digital photogrammetry suite. The use of a cali-brated metric camera during each historic mission meant that internal camera errors (e.g. lens distortions) could be mod-elled and removed to improve DEM quality. GCPs were ex-tracted from the contemporary lidar DEMs on stable land surfaces around each site with the aid of image enhance-ment techniques like relief-shading and contrast stretching. To compensate for the lower quality of lidar-derived GCPs compared to traditional survey-quality ground control, we collected a larger number of GCPs (40 to 80 points) and tie points (>100 points) than would traditionally be used in order to increase the measurement redundancy in the pho-tographic block adjustment. For more detailed information on this approach, see James et al. (2006) and Barrand et al. (2009).
Table 1.Acquisition details of airborne laser altimetry (lidar) and photographic surveys.
Lidar Photography
Elevation Range (m a.s.l.)
Acquisition Date # of Points (×106)
Acquisition Date Scale
Austre Brøggerbreen (AB) 90–650 06-07-2005 31.8
28-07-1966 1:50 000 05-08-1977 1:50 000 20, 25-08-1990 1:50 000
Albrechtbreen (AL)1 50–300 14-08-2005 42.0 08-1971
2 1:30 000 22, 27-07-1990 1:50 000
Grønfjordbreen (GB) 35–700 07-07-2005 54.4 19-08-196902-07-1990 1:50 0001:50 000
Gullfaksebreen (GF)1 65–890 09-07-2005 98.7
07, 09-07-19613 1:45 000 30-07-1966 1:50 000 22, 28-07-1990 1:50 000
Midtre Lov´enbreen (ML) 75–650
09-08-2003
23.5
28-07-1966 1:50 000 05-07-2005 05-08-1977 1:50 000 20, 25-08-1990 1:50 000
Slakbreen (SB) 180–1000 08-08-2003 46.3
23-25-08-1961 1:40 000 16-08-1977 1:20 000 22-07-1990 1:50 000
1Photographic and lidar coverage do not cover the whole catchment area of these glaciers whose highest elevations include featureless ice cap. Due to the
method’s reliance on the measurement of ground control points on stable features and the presence of image texture, these areas are unsuitable for photogrammetry. For AL,∼35 % of the area and 65 % of the elevation range were surveyed. For GF∼50 % of the area and 93 % of the elevation range were surveyed.
2Exact acquisition date unknown.
3Early epoch coverage was spread over two campaigns. Elevation differences over this period in the area of overlap were within the measurement error and
thus the 1961 photographs were merged with the 1966 block of photographs.
of dark shadow or snow cover), DEM points were measured manually where possible at a spacing of∼50 m, using the software’s 3-D-editing capabilities. These areas tended to be gently sloped, and thus the coarser resolution was sufficient for accurately representing these surfaces.
Since glacier surfaces are not stable over time, the as-sessment of glacier DEM quality from historical imagery is not straightforward. Typically, DEM quality is measured in terms of (i) the fit of measured points and camera calibration parameters to the block adjustment solution given in root-mean-square error (RMSE) of GCP X, Y and Z coordinates; and (ii) the comparison of the DEM to an independent check dataset (Wolf and Dewitt, 2000). As temporally coincident validation data were not available for the historical imagery, we assessed the DEM quality by comparing the lidar DEM at three off-ice test sites characterised as topographically stable and with similar textural and relief characteristics to the ice. This was carried out instead of a blanket comparison to all off-ice points since we could not assume that (i) all off-ice areas had remained unchanged over the long period of study (i.e. slope erosion, ice-cored moraines and shifting outwash plains); and (ii) the suitability of the ice- and off-ice surface for photogrammetry was similar in terms of image texture and contrast.
Results of the photogrammetric block adjustment sug-gested a good fit of the measured parameters to the block solution with average RMSE of the ground control in X, Y and Z of 1.33, 1.50 and 0.43 m, respectively. Comparison to the lidar at the test sites yielded low mean error of 0.21 m and standard deviation of±1.55 m. Although we expect the quality of on ice points to be better than this, to compensate for the degree of spatial autocorrelation of elevation errors expected in the differenced DEMs (Rolstad et al., 2009), we conservatively adopted the higher error estimate of±1.55 m for the photogrammetric DEM error in the following analy-sis.
2.2 Sequential DEM analysis
as the photogrammetric DEMs, and the surfaces were differ-enced on a pixel by pixel basis. Volume changes were cal-culated over the maximum area of ice coverage using pixel summation (e.g. Etzelm¨uller et al., 1993; Kohler et al., 2007; Barrand et al., 2010).
Differencing DEMs for volume and mass change measure-ment, known as the geodetic method, is more accurate over long periods than the glaciological method (Cox and March, 2004) where DEM quality is high and errors due to changes in ice density are negligible compared to elevation changes over these time scales. Also, the geodetic method can pro-vide measurement of elevation and volume changes across a glacier’s full area where conditions allow. This approach reduces or eliminates the need for extrapolation of point or profile measurements and is ideal in Svalbard where it has been argued that climate-driven elevation changes are large compared to changes in ice flow (Nuth et al., 2007) and ice density (Kohler et al., 2007) over these long time periods.
To put our results in the context of the area-altitude dis-tribution of the archipelago’s ice, we compare the hypsome-try of the whole archipelago to the hypsomehypsome-try of our sites. To produce the pan-Svalbard hypsometry, drainage basins were digitized from Hagen et al. (1993) and geocoded to the Norwegian Polar Institute 100 m Svalbard DEM using map grid intersections. The digitized basins were converted to bi-nary masks and were applied to the DEM to identify on-ice points. Results for the archipelago are provided in 50 m ele-vation bands with and without the ice caps of Nordaustlandet and Kvitøya. Hypsometry curves for our sites were produced both as a sum total of all sites and as averages for each site also in 50 m elevation bands.
3 Results
Our sequential DEM analysis reveals changes that are con-sistent with glaciers adjusting to a warming climate with thinning greatest at the retreating termini and decreasing up-glacier (Schwitter and Raymond, 1993) (Fig. 2). Terminus position data in Table 2 show that all six glaciers experienced significant retreat over the period of observation. However, there is high variability in changes of frontal position and el-evation attributable to both the strong regional temperature and precipitation gradients as well as local glacier geome-try. We discuss this below in the context of the glaciers’ ice-elevation distribution.
Elevation change statistics (Table 3; provided in ice equiv-alent units unless otherwise stated) show maximum elevation changes (1hmax) between 1961–2005 were recorded at SB and GB, which both lost more than 90 m of elevation over the study period (∼2.3 m a−1)at their 2003 and 2005 termini, respectively. The northeast site (GF), an area thought to be closer to balance (Bamber et al., 2005; Moholdt et al., 2010; Nuth et al., 2010), experienced elevation losses of almost 50 m (∼1.3 m a−1). The site with the highest mean annual
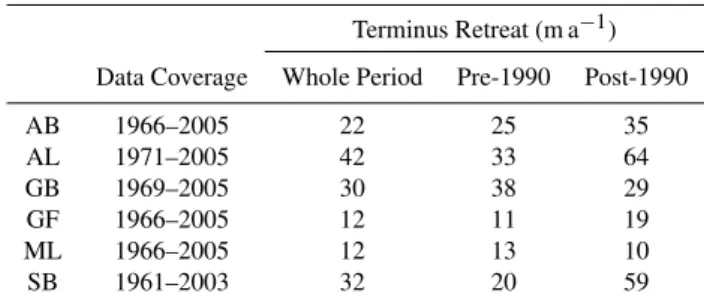
Table 2.Site terminus retreat relative to earliest epoch along dotted lines shown in Fig. 2.
Terminus Retreat (m a−1) Data Coverage Whole Period Pre-1990 Post-1990
AB 1966–2005 22 25 35
AL 1971–2005 42 33 64
GB 1969–2005 30 38 29
GF 1966–2005 12 11 19
ML 1966–2005 12 13 10
SB 1961–2003 32 20 59
elevation change ( .
1h) was low-lying AL on the eastern is-land of Edgeøya, which lost an average of 1.00±0.03 m a−1 over the surveyed portion of the glacier. SB lost an average of only 0.32±0.02 m a−1despite high elevation losses at the terminus due to a significant portion of its area lying high on the Gruvfonna ice cap. Elevation changes across all sites av-eraged−0.59±0.04 m a−1between 1961–2005. The frontal retreat and elevation losses we observe suggest that all six of our sites have likely undergone significant negative mass balance over the period of observation.
Pre- and post-1990 .
1hfor each site are given in Table 4 and reveal a significant increase of thinning between these periods. Average
.
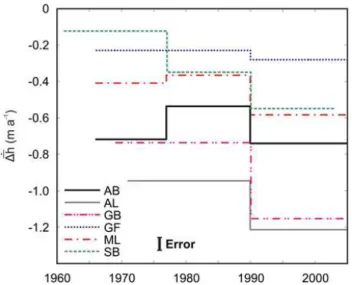
1h accelerated from −0.52±0.09 m a−1 before 1990 to−0.76±0.10 m a−1after 1990 representing a 46 % increase in average thinning rate between the two peri-ods. Increases in thinning rates over these periods of similar magnitude were previously reported on two of these glaciers in western Svalbard (Kohler et al., 2007). However, the inclu-sion of an intermediate epoch of photographs flown in 1977 at AB, ML and SB illustrates the difficulty of interpreting elevation changes between two discrete points in time espe-cially when separated by long periods. The rates of eleva-tion change for AB, ML and SB from Table 4 imply a uni-form and significantly lower thinning rate before than after 1990. However, elevation changes for the intermediate pe-riod (1977–1990; Fig. 3) show how these change statistics can be misleading. At AB, the thinning rate in the first of the three periods is not significantly different from the most re-cent period; only the middle period has significantly lower thinning rates. This is not the case for ML where thinning rates in the first two periods are similar, whereas SB experi-enced a constant increase in thinning over all three periods.
Our analysis of these thinning rates by elevation reveals the most significant finding from the study: Some of the greatest increases in
.
1hoccurred in the higher reaches of the glaciers in areas typical of snow accumulation and mass gain. As expected, elevation changes were greatest at lower alti-tudes with maximum changes reaching almost−2.5 m a−1at SB (Fig. 4). However, plotting changes in
.
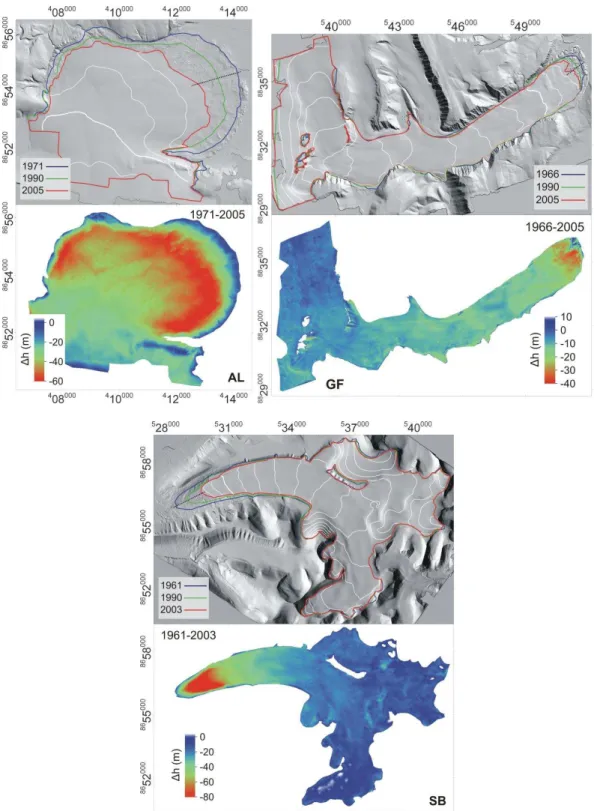
Fig. 2.Contemporary DEMs and sequential DEM analysis results (showing 1h)for: Austre Brøggerbreen (AB); Grønfjordbreen (GB); Midtre Lov´enbreen (ML); Albrechtbreen (AL); Gullfaksebreen (GF); and Slakbreen (SB). Top and left-hand panels show the shaded-relief DEMs of 2005 lidar (2003 for SB) with elevations plotted on a 5 m grid and glacier outline overlays. Contour interval is 50 m with bold contour at 300 m. Elevations in meters above sea level. Bottom and right-hand pannels show accompanying elevation change map on 10 m grid over the full period of data coverage. Plots for AL and GF show only the surveyed area of the glacier catchment (see Table 1).
at several sites are experiencing similar or indeed greater in-creases in thinning rates than at their termini (Fig. 5). Inter-estingly, an additional elevation change curve at ML from two lidar surveys in 2003 and 2005 shows the same pattern
Fig. 2.Continued.
4 Discussion
Of the results presented in Fig. 1 and Tables 3 and 4, the most striking is the apparent high variability between sites, espe-cially those located relatively close together. For example, of adjacent AB and ML, the former thinned significantly more
Fig. 3.Average annual elevation change ( .
1h)over all periods in-cluding the intermediate epoch at AB, ML and SB.
change by altitude curves and site hypsometry (Fig. 4), par-ticularly for AB and ML whose elevation changes by altitude are fairly similar, these differences are less surprising. Both ML and SB have a higher ice elevation distribution than their faster thinning neighbours. The large jump in thinning at ML between epochs can be explained by its greater ice area at elevations where higher increases in thinning rates were oc-curring. The comparatively small average elevation change at SB, due to its large icecap between 700 and 800 m, dis-guises the very high rates of thinning (up to−2.4 m a−1 be-tween 1961 and 2003) that occurred at the glacier’s terminus. In contrast, the difference in thinning rates between AB and ML when taking the intermediate epoch into account does not appear to be attributable to hypsometric differences and must be due to some other yet unknown site-specific param-eter.
For glaciers farther afield the effect of Svalbard’s strong climatic gradients becomes apparent. GF experienced signif-icantly lower mean thinning rates (−0.25±0.03 m a−1)than at other sites despite our survey missing some of the catch-ment’s higher elevations where thickening may be present. Nuth et al. (2010) found that the ice cap ˚Asg˚ardfonna, which is linked to GF, underwent average elevation changes of −0.21±0.07 m a−1 (after conversion from water equiv-alents) for the similar period, 1966–2007, which is within the margin of error of our measurement. On the other end of the spectrum, average changes at AL were highest of all our sites (−1.00±0.03 m a−1). However, this glacier also had the lowest hypsometry and the highest third of the glacier’s elevation range could not be included in the study. For the large but low-lying ice cap Edgeøyjøkulen, which contains the AL catchment, Nuth et al. (2010) measured average el-evation changes of −0.63±0.12 m a−1 between 1966 and 2007 suggesting that our surveyed area is likely biased
to-wards the more negative changes at the lower elevations of the catchment. The high frontal thinning rates measured at AL are similar to the−2.0 m a−1measured by K¨a¨ab (2008) on the other Edgeøya ice caps.
A strong link between net mass balance and both summer temperatures and winter precipitation has been demonstrated in Svalbard (Hagen and Liestøl, 1990; Lefauconnier et al., 1999), and thus we interpreted our results in the context of the local meteorology. The high variability in thinning rates observed at our sites supports the regional approach used pre-viously for archipelago-wide monitoring of Svalbard mass balance (i.e. Hagen et al., 2003b; Bamber et al., 2005; and Nuth et al., 2010). While it is tempting to consult data from all the meteorological stations around Svalbard to understand better the variation between sites, we argue the following: (i) the documented temperature and precipitation gradients in Svalbard, caused by its position between warm and cold oceanic and atmospheric currents (Rotschky et al., 2011), and the different local geometries, are sufficient to account for the observed variability; (ii) none of the stations in Sval-bard are close enough to the sites to represent accurately local conditions; and (iii) temperature (and to a lesser extent pre-cipitation) at Longyearbyen is correlated with other stations in Svalbard (Førland and Hanssen-Bauer, 2003) and only the Longyearbyen record covers our study period. Therefore, we base the following discussion on data from the Longyearbyen (Svalbard airport) meteorological station (L, Fig. 1).
Between 1961 and 2005, annual mean temperature at Longyearbyen increased by 1.8◦C. However, high interan-nual and decadal variability means long-term trends must be large in order to be statistically significant (Førland and Hanssen-Bauer, 2003). Alternatively, the June, July, August (JJA) mean temperature at Longyearbyen increased signifi-cantly (with 95 % confidence) by 0.02◦C a−1between 1961– 2005 (Fig. 6). No significant trend was measured during 1961–1990, but JJA temperatures after 1990 increased sig-nificantly by 0.07◦C a−1. These warming temperature trends are likely driving the acceleration of thinning at low eleva-tions.
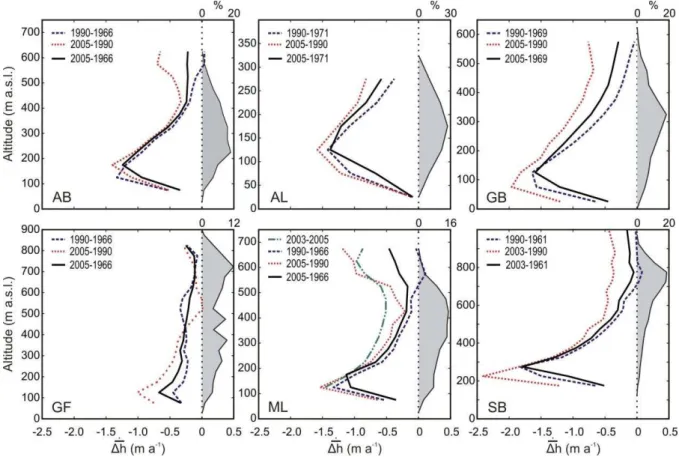
Fig. 4.Elevation change curves for the six survey sites, shown in 50 m altitude bins (bottom axis). Decreased thinning rates at lowest elevations reflect the thinning of the front to zero ice thickness between epochs and thus terminus retreat. Right side of each panel provides relative hypsometry of each site in percentage of total area (top axis; see Table 3).
Table 3.Glacier elevation and volume change statistics derived from DEM differencing over the full period of data coverage. Mean area (A);
maximum total elevation change (1hmax); mean elevation change (1h); mean annual elevation change ( .
1h); total volume change (1V );
and total annual volume change (1V. ).
Site Study A 1hmax 1h
.
1h 1V 1V.
Period (km2) (m) (m) (m a−1) (×105m3) (×104m3a−1)
AB 1966–2005 10.96±0.04 −67±1 −25±1 −0.64±0.03 −2.73±0.11 −0.70±0.03 AL∗ 1971–2005 28.56±0.09 −73±1 −34±1 −1.00±0.03 −9.71±0.29 −2.86±0.09 GB 1969–2005 35.83±0.12 −94±1 −31±1 −0.87±0.03 −11.3±0.37 −3.13±0.10 GF∗ 1966–2005 42.98±0.14 −38±1 −10±1 −0.25±0.03 −4.17±0.44 −1.07±0.11 ML 1966–2005 5.47±0.02 −66±1 −17±1 −0.44±0.03 −0.94±0.06 −0.24±0.01 SB 1961–2003 40.18±0.13 −102±1 −13±1 −0.32±0.02 −5.34±0.41 −1.27±0.10
∗Note the AL and GF catchments were not completely surveyed (see Table 1).
was based on time series that terminated around the end of this cold period, which would explain the lack of trend in rates of mass loss for many of these earlier studies. There is clearly a need to interpret geodetic volume and mass changes in the context of the prevailing meteorological conditions at the time of each epoch in the time series.
We also performed an analysis of Longyearbyen precip-itation data. Due to the strong precipprecip-itation gradients in
Table 4.Mean annual elevation change rates ( .
1h) for pre-1990, post-1990 and whole period of data coverage.
.
1h(m a−1)
Whole Period Pre-1990 Post-1990
AB 1966–2005 −0.64±0.03 −0.62±0.09 −0.74±0.10 AL∗ 1971–2005 −1.00±0.03 −0.95±0.11 −1.21±0.10 GB 1969–2005 −0.87±0.03 −0.74±0.10 −1.15±0.10 GF∗ 1966–2005 −0.25±0.03 −0.22±0.09 −0.28±0.10 ML 1966–2005 −0.44±0.03 −0.38±0.09 −0.58±0.10 SB 1961–2003 −0.32±0.03 −0.22±0.07 −0.55±0.12
∗Note the AL and GF catchments were not completely surveyed (see Table 1).
Fig. 5.Differencing elevation change rates from pre-1990 and post-1990 periods by altitude highlights the speedup in thinning is great-est at higher elevations with only GF in the far NE as the exception.
a strong post-1990 negative trend in total precipitation of 4.4 mm a−1 (significant at 95 % confidence; standard error, 2.2 mm) but no significant trend over the whole period. In contrast, solid precipitation decreased significantly since 1961 (−0.9 mm a−1; standard error, 0.2 mm) with a stronger negative trend since 1990 (−3.0 mm a−1; standard error, 1.4 mm). To put the precipitation decreases into context, at these rates annual precipitation in 2005 was predicted to be
∼45 mm less than it was in 1990 in a region with already relatively low accumulation rates of less than 1 m w.e. a−1 (Hagen et al., 2003a). This reduction in accumulation could in several ways account for the increases in thinning rates we have observed in the glaciers’ upper reaches. First, such a loss of snow cover would decrease internal accumulation in these higher areas and potentially cause a redistribution of superimposed ice to lower elevations (e.g. Zwinger and Moore, 2009). At ML and likely elsewhere in Svalbard, su-perimposed ice is known to be a significant component of mass balance (Wright et al., 2007) and this could be respon-sible for a non-linear ablation gradient. Second, there could be a dynamic component to these changes since it is likely
Fig. 6.JJA Temperature data from the Longyearbyen station (L, Fig. 1). Trend for whole period (black dotted line) is 0.02◦C a−1 whereas the trend for the post-1990 period was 0.07◦C a−1(at 95 % confidence). No significant trend was measured for the pre-1990 pe-riod. Average PDDs for each period and for the whole study period at Longyearbyen meteorological station (L, Fig. 1) are given at the bottom of the main panel.
that the submergence velocities are not in balance with the decreasing trend in mass input in the accumulation areas. Fi-nally, in areas with a significant firn layer, elevation changes could have resulted from firm compaction. However, it is im-portant to note that the elevation change by altitude curve for ML between 2003 and 2005 (Fig. 4) highlights that enhanced thinning occurs far down the glacier in areas where only bare ice was measured in these two years.
This newly exposed bedrock in the headwall area could also locally influence the radiation budget at these higher eleva-tions, though these areas are relatively small. Without local data on snow cover, changes in albedo and local energy bud-gets at our sites over the period of study, the cause of these changes remains uncertain.
Independent of their cause, the changes we have observed if widespread will have important implications on the mass balance of the archipelago. Critically, Svalbard’s ice is es-pecially sensitive to changes in the equilibrium line altitude (ELA) due to its hypsometric distribution which places the bulk of Svalbard’s ice close to the current estimated ELA. Consequently, even small changes in the ELA will have a large impact on the mass balance of the archipelago (Hagen et al., 2003b). To illustrate, at its estimated average altitude of∼460 m a.s.l. and accumulation area ratio (AAR) of 0.44 (calculated from our hypsometry data), a 50 m increase in the ELA (or an equivalent surface lowering) would result in a loss of∼3000 km2of accumulation area and a new AAR of 0.36 – equal to∼8 % of Svalbard’s ice-covered area and
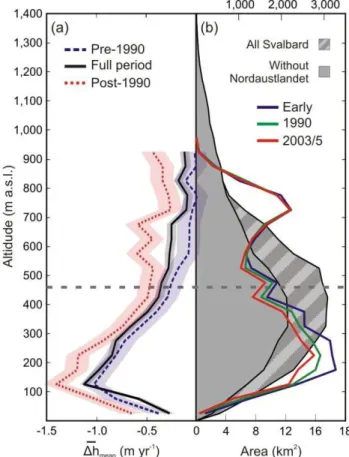
∼18 % of the accumulation zone according to most recent estimates (Hagen et al., 1993). However, these hypsometry and ELA estimates are based largely on the 1990 aerial sur-vey and our results show that significant changes have taken place since the 1990 survey was undertaken. This is demon-strated by the total area-altitude distribution for our sites dur-ing the early 1990 and 2003/5 epochs (Fig. 7) showdur-ing how the ice area has lowered over this 44-yr period.
5 Conclusions
Our high-resolution time series of glacier DEMs derived from archived aerial photographs and lidar reveal high vari-ability in elevation changes and retreat rates between our sites. This is indicative of the strong regionality of Svalbard’s climate and highlights the difficulty of using a small number of index glaciers to represent changes of a region. However, despite this variability there is a prevalent increase in thin-ning at all sites between the periods 1961–1990 and 1990– 2005. Of particular note is an increase in thinning rates in the glaciers’ upper reaches of similar magnitude to that measured at the glaciers’ termini. We find that these changes are co-incident with increasing trends in summer temperatures and decreasing trends in winter precipitation. While their cause is not yet clear, we suggest that the loss of snow cover could be altering the albedo of these higher regions, causing changes to the distribution of superimposed ice and/or creating an imbalance between mass input and submergence velocities. Clearly, more research is needed to determine the causes and extent of these changes.
Regardless of their cause, these high elevation changes, if widespread, could act to raise the ELA and decrease the AAR in an area whose mass balance is known to be highly sensitivity to such changes (Hagen et al., 2003b). However,
Fig. 7.Hypsometric context of elevation changes at our sites.(a) El-evation change with altitude is plotted to show annual changes before and after 1990 and over the whole period of data cover-age. Error estimates are represented by the shading around each curve. The horizontal dashed line is the estimated average ELA of∼460 m a.s.l. from Hagen et al. (2003b);(b)Total hypsometry of the study sites for early 1990 and 2003/5 epochs (bottom axis) overlying the hypsometry of Svalbard (top axis) inclusive and ex-clusive of the ice of Nordaustlandet and Kvitøya all calculated in 50 m elevation bands.
we have found that when measuring geodetic elevation and mass changes, the timing of photographic epochs within the decadal climate variability can have a significant impact on implied changes over the period. We advise caution when in-terpreting such results in the absence of reliable local climate data, especially in regions with strong climate gradients like Svalbard. Our findings highlight a need for continued high-resolution monitoring of Svalbard glaciers.
Acknowledgements. SLICES was funded by the UK NERC
geodetic observatory were provided by Statens Kartverk, Norway. The authors would like to thank: BAE Systems (SOCETSET), Applied Imagery (Quick Terrain Modeler) and Jack Kohler (Nor-wegian Polar Institute) for their support. Field assistants included Artur Adamek, Trine Abrahamsen, Brian Barrett, Suzanne Bevan, Remko de Lange, Adrian Luckman and Irina Solovjanova. Finally, we would like to thank three anonymous reviewers, M. Pelto and the editor for their constructive comments which helped to improve significantly this manuscript.
Edited by: A. K¨a¨ab
References
Bamber, J. L., Krabill, W., Raper, V., Dowdeswell, J. A., and Oer-lemans, J.: Elevation changes measured on Svalbard glaciers and ice caps from airborne laser data, Ann. Glaciol., 42, 202–208, 2005.
Barrand, N. E., Murray, T., James, T. D., Barr, S. L., and Mills, J. P.: Optimizing photogrammetric DEMs for glacier volume change assessment using laser-scanning derived ground-control points, J. Glaciol., 55, 106–116, 2009.
Barrand, N. E., James, T. D., and Murray, T.: Spatio-temporal vari-ability in elevation changes of two high-Arctic valley glaciers, J. Glaciol., 56, 771–780, 2010.
Berthier, E., Schiefer, E., Clarke, G. K. C., Menounos, B., and R´emy, F.: Contribution of Alaskan glaciers to sea-level rise derived from satellite imagery, Nat. Geosci., 3, 92–95, doi:10.1038/NGEO737, 2010.
Chen, G.: GPS Kinematic Positioning for the Airborne Laser Al-timetry at Long Valley, California, Ph.D. thesis, Massachusetts Institute of Technology, Cambridge, 179 pp., 1998.
Cox, L. H. and March, R. S.: Comparison of geodetic and glaciolog-ical mass-balance techniques, Gulkana Glacier, Alaska, U.S.A., J. Glaciol., 50, 363–370, 2004.
Dowdeswell, J. A., Hagen, J. O., Bj¨ornsson, H., Glazovsky, A. F., Harrison, W. D., Holmlund, P., Jania, J., Koerner, R. M., Lefau-connier, B., Ommanney, C. S. L., and Thomas, R. H.: The mass balance of circum-Arctic glaciers and recent climate change, Quaternary Res., 48, 1–14, 1997.
Etzelm¨uller, B., Vatne, G., Odegard, R. S., and Sollid, J. L.: Mass-balance and changes of surface slope, crevasse and flow pattern of Erikbreen, Northern Spitsbergen – an application of a geo-graphical information system (GIS), Polar Res., 12, 131–146, 1993.
Fleming, K. M., Dowdeswell, J. A., and Oerlemans, J.: Modelling the mass balance of northwest Spitsbergen glaciers and responses to climate change, Ann. Glaciol., 24, 203–210, 1997.
Førland, E. J. and Hanssen-Bauer, I.: Increased precipitation in the Norwegian Arctic: True or False?, Climate Change, 46, 485–509, 2000.
Førland, E. J. and Hanssen-Bauer, I.: Past and future climate varia-tions in the Norwegian Arctic: overview and novel analyses, Po-lar Res., 22, 113–124, 2003.
Greuell, W., Kohler, J., Obleitner, F., Glowacki, P., Melvold, K., Bernsen, E., and Oerlemans, J.: Assessment of interan-nual variations in the surface mass balance of 18 Svalbard glaciers from the Moderate Resolution Imaging
Spectrora-diometer/Terra albedo product, J. Geophys. Res., 112, D07105, doi:10.1029/2006JD007245, 2007.
Hagen, J. O. and Liestøl, O.: Long-term glacier mass balance in-vestigations in Svalbard, 1950–88, Ann. Glaciol., 14, 102–106, 1990.
Hagen, J. O., Liestøl, O., Roland, E., and Jørgensen, T.: Glacier atlas of Svalbard and Jan Mayen, Norsk Polarinstitutt, Oslo, 141 pp., 1993.
Hagen, J. O., Kohler, J., Melvold, K., and Winther, J. G.: Glaciers in Svalbard: mass balance, runoff and freshwater flux, Polar Res., 22, 145–159, 2003a.
Hagen, J. O., Melvold, K., Pinglot, F., and Dowdeswell, J. A.: On the net mass balance of the glaicers and ice caps in Svalbard, Norwegian Arctic, Arct. Antarct. Alp. Res., 35, 264–270, 2003b. Hanssen-Bauer, I.: Temperature and precipitation in Svalbard 1912– 2050: measurements and scenarios, Polar Rec., 38, 225–232, 2002.
Herring, T. A., King, R. W., and McClusky, S. C.: Documentation for the GAMIT GPS analysis software, version 10.40 Rep., Mas-sachusetts Institute of Technology, Cambridge, 2010.
James, T. D., Murray, T., Barrand, N. E., and Barr, S. L.: Extract-ing photogrammetric ground control from lidar DEMs for change detection, Photogramm. Rec., 21, 310–326, 2006.
Joerg, P. C., Morsdorf, F., and Zemp, M.: Uncertainty assessment of multi-temporal airborne laser scanning data: a case study on an alpine glacier, Remote Sens. Environ., 127, 118–129, 2012. K¨a¨ab, A.: Glacier volume changes using ASTER satellite stereo and
ICESat GLAS laser altimetry. A test study on Edgeoya, East-ern Svalbard, IEEE T. Geosci. Remote Sens., 46, 2823–2830, doi:10.1109/TGRS.2008.2000627, 2008.
Kohler, J., James, T. D., Murray, T., Nuth, C., Brandt, O., Barrand, N. E., Aas, H. F., and Luckman, A. J.: Acceleration in thin-ning rate on western Svalbard glaciers, Geophys. Res. Lett., 34, L18502, doi:10.1029/2007GL030681, 2007.
Lefauconnier, B., Hagen, J. O., Ørbæk, J. B., Melvold, K., and Isaksson, E.: Glacier balance trends in the Kongsfjorden area, western Spitsbergen, Svalbard, in relation to climate, Polar Res., 18, 307–313, 1999.
Moholdt, G., Nuth, C., Hagen, J. O., and Kohler, J.: Recent elevation changes of Svalbard glaciers derived from ICESat laser altimetry, Remote Sens. Environ., 114, 2756–2767, 2010.
Nuth, C., Kohler, J., Aas, H. F., Brandt, O., and Hagen, J. O.: Glacier geometry and elevation changes on Svalbard (1936–90): a base-line dataset, Ann. Glaciol., 46, 106–116, 2007.
Nuth, C., Moholdt, G., Kohler, J., Hagen, J. O., and K¨a¨ab, A.: Svalbard glacier elevation changes and contribution to sea level rise, J. Geophys. Res.-Earth, 115, F01008, doi:10.1029/2008JF001223, 2010.
Oerlemans, J., Giesen, R. H., and van den Broeke, M. R.: Retreating alpine glaciers: increased melt rates due to accumulation of dust (Vadret da Morteratsch, Switzerland), J. Glaciol., 55, 729–736, 2009.
Rolstad, C., Haug, T., and Demby, B.: Spatially integrated geodetic glacier mass balance and its uncertainty based on geostatistical analysis: application to the western Svartisen ice cap, Norway, J. Glaciol., 55, 666–680, 2009.
QuickSCAT/SeaWinds scatterometry, Polar Res., 30, 5963, doi:10.3402/polar.v30i0.5963, 2011.
Schwitter, M. P. and Raymond, C. F.: Changes in the longitudinal profiles of glaciers during advance and retreat, J. Glaciol., 39, 582–590, 1993.
Tedesco, M., Fettweis, X., van den Broeke, M. R., Van de Wal, R. S. W., Smeets, C. J. P. P., van de Berg, W. J., Serreze, M. C., and Box, J. E.: The role of albedo and accumulation in the 2010 melting record in Greenland, Environ. Res. Lett., 6, 014005, doi:10.1088/1748-9326/6/1/014005, 2011.
Wehr, A. and Lohr, U.: Airborne laser scanning – an introduction and overview, ISPRS J. Photogramm., 54, 68–82, 1999.
Wolf, P. R. and Dewitt, B. A.: Elements of Photogrammetry, with Applications in GIS, 3rd Edn., McGraw-Hill, New York, 608 pp., 2000.
Wright, A. P., Wadham, J. L., Siegert, M. J., Luckman, A., Kohler, J., and Nuttall, A. M.: Modeling the refreezing of meltwater as superimposed ice on a high Arctic glacier: A comparison of approaches, J. Geophys. Res., 112, F04016, doi:10.1029/2007JF000818, 2007.