UNIVERSIDADE FEDERAL DE MINAS GERAIS
INSTITUTO DE CIÊNCIAS BIOLÓGICAS
PROGRAMA DE PÓS-GRADUAÇÃO EM ECOLOGIA, CONSERVAÇÃO
E MANEJO DE VIDA SILVESTRE
CONSERVAÇÃO DA ONÇA-PINTADA (PANTHERA ONCA LINNAEUS,
1758) NA MATA ATLÂNTICA DE TABULEIRO DO ESPÍRITO SANTO
ANA CAROLINA SRBEK DE ARAUJO
ORIENTADOR: PROF. DR. ADRIANO GARCIA CHIARELLO
UNIVERSIDADE FEDERAL DE MINAS GERAIS
INSTITUTO DE CIÊNCIAS BIOLÓGICAS
PROGRAMA DE PÓS-GRADUAÇÃO EM ECOLOGIA, CONSERVAÇÃO
E MANEJO DE VIDA SILVESTRE
CONSERVAÇÃO DA ONÇA-PINTADA (PANTHERA ONCA LINNAEUS,
1758) NA MATA ATLÂNTICA DE TABULEIRO DO ESPÍRITO SANTO
Ana Carolina Srbek de Araujo
Tese apresentada ao Programa de Pós-Graduação
em Ecologia, Conservação e Manejo de Vida
Silvestre da Universidade Federal de Minas Gerais
como requisito à obtenção do título de Doutora.
Orientador: Prof. Dr. Adriano Garcia Chiarello
Departamento de Biologia, Faculdade de Filosofia,
Ciências e Letras de Ribeirão Preto, Universidade de
São Paulo
AGRADECIMENTOS
As pessoas costumam dizer que produzir uma tese é um parto. Eu prefiro dizer que a minha tese é o fruto de um relacionamento iniciado há anos e que certamente não se encerrará com a conclusão desta etapa. Houve momentos de crise, como há em todo relacionamento, mas os bons momentos e o objetivo final do trabalho - contribuir para a conservação das onças-pintadas - me incentivaram a superar os obstáculos e as dificuldades. Nesta trajetória, muitos foram os colaboradores e há muito a agradecer.
Primeiramente, eu agradeço a Deus, pela dádiva da Vida e pelo “atrevimento” da Biodiversidade, mas também pela realização de um sonho: estar próxima às onças-pintadas.
Á minha Família, por me apoiar em minhas escolhas, mesmo que elas representassem minha ausência em vários momentos. À minha Mãe, pela amizade e amor. Ao meu Pai, pela experiência de vida. Aos meus Avós, por tudo o que sou. Ao meu Irmão, pelo exemplo de perseverança na busca por seus sonhos. Aos meus tios e primos, pelo apoio e amizade.
Aos Amigos, de sempre e de agora, pelo simples fato de existirem e estarem sempre ao meu lado, mesmo que à distância.
À minha Tutora, Doutora Cecília Martins Kierulff, pelo incentivo, apoio e amizade. Obrigada também pela inestimável ajuda com o Programa VORTEX e pela revisão dos textos.
Ao Professor Doutor Eduardo Eizirik e à Doutora Taiana Haag, por aceitarem a parceria e me acolherem em seu laboratório, dividindo comigo o trabalho e o mérito das análises genéticas.
Ao Professor Doutor Marcos Pezzi Guimarães, por abrir as portas do seu laboratório para mim, e, em especial, à Juliana Lúcia Costa Santos e Viviane Medeiros pela ajuda com as análises parasitológicas.
Ao Doutor Samuel Enrique Astete Perez, pelo incentivo e fundamental ajuda nas análises populacionais empregando o Programa MARK.
Aos membros da banca de avaliação da tese, pela disponibilidade em participar do processo e por contribuirem para a qualidade do trabalho.
Aos colegas de trabalho em Linhares e todos os companheiros de campo ao longo destes primeiros oito anos de estudo, pelo fundamental apoio, amizade e dedicação, em especial a José Simplício dos Santos (Zezão), Braz Guerini, Jesuíno Barreto (Zuíno), Hermano José Del Duque Júnior, Eduardo de Rodrigues Coelho e toda equipe do Hotel da Reserva Natural Vale.
À Vale, pelo total suporte ao estudo, em especial a Renato Moraes de Jesus, por nos permitir iniciar esta jornada, e a Luiz Felipe Campos, por apoiar a continuidade do projeto.
A todos os que contribuíram de alguma forma, direta ou indiretamente, positiva ou negativamente, para que este momento se realizasse.
Às onças-pintadas, pela motivação e pela paixão que elas fazem aflorar em mim.
“Que será dos homens sem os animais? Se todos os animais desaparecerem, o homem morrerá de solidão espiritual.”
ÍNDICE
APRESENTAÇÃO 1
RESUMO 6
ABSTRACT 8
CAPÍTULO 1: Influência do desenho amostral na taxa de captura e na estrutura da comunidade de mamíferos registrada a partir de armadilhas fotográficas no sudeste do Brasil
10
CAPÍTULO 2: Parâmetros populacionais, ecologia espacial e interações sociais da onça-pintada (Panthera onca Linnaeus, 1758) na Reserva Natural Vale, sudeste do Brasil
51
CAPÍTULO 3: Diversidade genética de uma pequena e isolada população de onças-pintadas (Panthera onca Linnaeus, 1758) em remanescente de Mata Atlântica costeira no sudeste do Brasil
126
CAPÍTULO 4: Parasitos intestinais em uma população silvestre de onça-pintada (Panthera onca Linnaeus, 1758) na Mata Atlântica do sudeste do Brasil
158
CAPÍTULO 5: Atropelamento de onça-pintada (Panthera onca Linnaeus, 1758) em rodovia federal no Espírito Santo, sudeste do Brasil, e implicações para a conservação da espécie
176
CAPÍTULO 6: Análise de Viabilidade Populacional da onça-pintada (Panthera onca Linnaeus, 1758) no Espírito Santo: ameaças x ações de manejo
191
1 APRESENTAÇÃO
A onça-pintada é o maior felino das Américas, estando sua área de ocorrência atual restrita a menos da metade de sua distribuição original. Na Mata Atlântica brasileira, que consiste em um dos biomas mais ameaçados do planeta, a situação da espécie é extremamente crítica. Sua presença foi recentemente confirmada em apenas oito regiões / localidades no bioma e as subpopulações remanescentes encontram-se em declínio.
No Espírito Santo, a onça-pintada está reduzida a uma única população, localizada na porção norte do estado, estando restrita ao bloco Linhares / Sooretama. Este está composto pela Reserva Natural Vale e pela Reserva Biológica de Sooretama, que juntas representam quase 10% da área com cobertura florestal remanescente no Espírito Santo, sendo necessária a adoção de medidas urgentes para conservação da espécie na região.
2 anteriores, no qual é analisada a viabilidade da população em estudo e apresentados os resultados potenciais das ações que compõem a estratégia de manejo proposta para conservação da onça-pintada no bloco Linhares / Sooretama em longo prazo.
Os capítulos que compõem a presente tese são:
Capítulo 1: Influência do desenho amostral na taxa de captura e na estrutura da comunidade de mamíferos registrada a partir de armadilhas fotográficas no sudeste do Brasil
Título original do artigo: “Influence of camera-trap sampling design on mammal species capture rates and community structures in southeastern Brazil”
Avalia os registros obtidos a partir de armadilhas fotográficas, considerando a limitação dos dados para a realização de estimativas de abundância de espécies cujos indivíduos não podem ser individualizados, incluindo a análise de aspectos relacionados à variação na detectabilidade das espécies.
Capítulo 2: Parâmetros populacionais, ecologia espacial e interações sociais da onça-pintada (Panthera onca Linnaeus, 1758) na Reserva Natural Vale, sudeste do Brasil
3 na área de estudo, destacando as ameaças representadas pelas atividades de caça realizadas na região.
Capítulo 3: Diversidade genética de uma pequena e isolada população de onças-pintadas (Panthera onca Linnaeus, 1758) em remanescente de Mata Atlântica costeira no sudeste do Brasil
Título original do artigo: “Genetic Diversity of a small and isolated population of jaguars (Panthera onca Linnaeus, 1758) in a Coastal Atlantic Forest remnant in Southeastern Brazil”
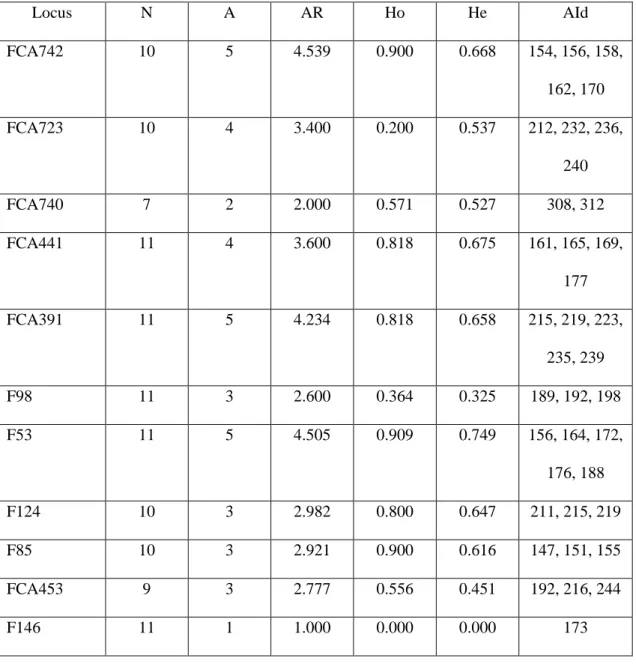
Avalia a variabilidade genética da população de onças-pintadas na Reserva Natural Vale, a partir de método não invasivo de obtenção de DNA (amostras fecais), realizando a comparação entre esta e as outras populações estudadas na Mata Atlântica até o momento, com a inclusão de proposta de manejo visando o resgate genético da espécie a partir de ação integrada com outras populações do bioma.
Capítulo 4: Parasitos intestinais em uma população silvestre de onça-pintada (Panthera onca Linnaeus, 1758) na Mata Atlântica do sudeste do Brasil
Caracteriza a comunidade de parasitos intestinais identificados para a onça-pintada na Reserva Natural Vale a partir da análise de amostrais fecais, empregando os resultados obtidos como um indicador de saúde da população em estudo.
4 Relata o atropelamento de uma onça-pintada na Rodovia BR-101 em trecho localizado entre a Reserva Natural Vale e a Reserva Biológica de Sooretama, destacando o problema representado pela duplicação desta rodovia caso não sejam adotadas medidas especiais para reduzir o risco ou evitar o atropelamento de animais silvestres na região.
Capítulo Final: Análise de Viabilidade Populacional da onça-pintada (Panthera onca Linnaeus, 1758) no Espírito Santo: ameaças x ações de manejo
Avalia a viabilidade da última população de onças-pintadas no estado do Espírito Santo, considerando a execução de modelagens computacionais para o bloco de vegetação nativa composto pela Reserva Natural Vale e pela Reserva Biológica de Sooretama. Este último capítulo também simula o efeito das ameaças levantadas e das ações de manejo indicadas para a população em estudo, conforme apresentado nos capítulos temáticos, objetivando a avaliação da estratégia de conservação proposta para a onça-pintada no Espírito Santo.
5 remoção de indivíduos da natureza (PAN - Meta 3) e o restabelecimento do fluxo gênico entre as populações (PAN - Meta 4).
O presente trabalho reforça o caráter multi e interdisciplinar da conservação e a necessidade de cooperação entre instituições e profissionais de diferentes áreas do conhecimento para desenvolvimento de estudos visando à conservação de espécies ameaçadas de extinção, integrando o levantamento de dados ecológicos, genéticos e parasitológicos, por exemplo, além da aplicação de diferentes ferramentas de análise de dados, para o melhor entendimento do problema e adequada definição de ações para conservação de populações frente às ameaças diagnosticadas.
6 RESUMO
7 estudada (70% das amostras). Cita-se ainda a morte de um indivíduo por atropelamento em 2000, podendo o risco de morte de espécimes ser agravado na região com a duplicação da Rodovia BR-101. Análises de viabilidade indicam que a situação da população estudada é extremamente crítica, com 100% de probabilidade de extinção em 100 anos e previsão média de extinção em até 30 anos. As simulações realizadas indicam que a remoção de espécimes apresenta efeitos negativos sobre a população, mesmo quando aplicadas ações de manejo baseadas na suplementação populacional. Desta forma, como estratégia para conservação da onça-pintada na Mata Atlântica de Tabuleiro do Espírito Santo, propõe-se o desenvolvimento de um conjunto integrado de ações: (1) avaliação da abundância e monitoramento sistemático e contínuo das populações de presas, incluindo a avaliação periódica da dieta da espécie; (2) combate às atividades de caça na RNV e na RBS (intensificação das ações em andamento); (3) investigação e monitoramento da dinâmica de doenças em onças-pintadas e identificação do risco de contração de outras doenças a partir do contato com espécies exóticas; (4) não duplicação da Rodovia BR-101 no trecho de 15 km associados à RBS e à RNV, com a construção de novas passagens de fauna, melhoria das estruturas atualmente existentes e instalação de redutores eletrônicos de velocidade e placas; (5) estruturação e implementação de programa integrado para manejo de indivíduos entre populações geneticamente conhecidas e geneticamente compatíveis de onça-pintada na Mata Atlântica; (6) continuidade do monitoramento da população de onças-pintadas presente no bloco Linhares / Sooretama, incluindo a geração de dados para a RBS. Os resultados obtidos no presente estudo evidenciam a urgência na implementação de ações de manejo efetivas para conservação da onça-pintada na região em longo prazo, conforme estratégia aqui proposta, podendo as ações citadas serem aplicáveis também a outras populações do bioma.
8 ABSTRACT
9 intensification of further deaths as result of the duplication of the BR-101 are discussed. The population viability analyzes indicated that the situation of the population is extremely critical, with 100% of probability of extinction in 100 years and average forecast of extinction within 30 years. The simulations indicated that the removal of specimens has negative effects on the population, even when management actions based on population supplementation are applied. Thus, as a strategy for conservation of the jaguar in the Atlantic Forest of the state of Espírito Santo, the development of a integrated set of actions is proposed: (1) assessment of the abundance and systematic and continuous monitoring of prey populations, including periodic assessment of the diet of the species; (2) preventing hunting activities in RNV and RBS (intensification of ongoing actions); (3) research and monitoring of the dynamics of disease in jaguars and identification of the risk of contracting other diseases from contact with alien species; (4) non-duplication of the Highway BR-101 in the stretch of 15 km associated with RBS and RNV, with the construction of new wildlife crossings, the improvement of existing structures and the installation of electronic speed monitoring devices and plates; (5) structuring and implementation of an integrated program for the management of jaguars between Atlantic Forest populations genetically studied and genetically compatible; (6) maintaining the monitoring of the population of jaguars in Linhares / Sooretama block, including the data collection also in the RBS. The results obtained in this study suggest the need for urgent implementation of effective management actions to guarantee the long term conservation of jaguar in the region, according to the strategy here proposed. The actions cited can also be applicable to other jaguar populations in the Atlantic Forest.
10 CAPÍTULO 1
Influência do desenho amostral na taxa de captura e na estrutura da comunidade de mamíferos registrada a partir de armadilhas fotográficas no sudeste do Brasil
Artigo Científico aceito para publicação na revista Biota Neotropica
Título original: Influence of camera-trap sampling design on mammal species capture rates and community structures in southeastern Brazil
11
Influence of camera-trap sampling design on mammal species capture rates and
community structures in southeastern Brazil
Short Title: Influence of sampling design on mammal inventory
Ana Carolina Srbek-Araujo1,2,4 & Adriano Garcia Chiarello3
1
Programa de Pós-graduação em Ecologia, Conservação e Manejo de Vida Silvestre, Instituto de Ciências Biológicas, Universidade Federal de Minas Gerais - Avenida Antônio Carlos, n° 6627, Pampulha, Belo Horizonte, Minas Gerais - CEP 31270-901, Brazil. Email: [email protected] 2
Vale S.A. / Reserva Natura Vale - Caixa Postal n° 91, Centro, Linhares, Espírito Santo – CEP 29900-970, Brazil.
3
Departamento de Biologia, Faculdade de Filosofia Ciências e Letras de Ribeirão Preto, Universidade de São Paulo - Avenida dos Bandeirantes, n° 3900, Ribeirão Preto, São Paulo - CEP 14040-901, Brazil. Email:
[email protected]
4
12 Influence of camera-trap sampling design on mammal species capture rates and community
structures in southeastern Brazil
Abstract: The distribution of species and population attributes are critical data for biodiversity conservation. As a tool for obtaining such data, camera traps have become increasingly common
throughout the world. However, there are disagreements on how camera-trap records should be used due to imperfect species detectability and limitations regarding the use of capture rates as surrogates for abundance. We evaluated variations in the capture rates and community structures of mammals in camera-trap surveys using four different sampling designs. The camera traps were installed on internal roads (in the first and fourth years of the study), at 100-200 m from roads (internal edges; second year) and at 500 m from the nearest internal road (forest interior; third year). The mammal communities sampled in the internal edges and forest interior were similar to each other but differed significantly from those sampled on the roads. Furthermore, for most species, the number of records and the capture success varied widely among the four sampling designs. A further experiment showed that camera traps placed on the same tree trunk but facing in opposing directions also recorded few species in common. Our results demonstrated that presence or non-detection and capture rates vary among the different sampling designs. These differences resulted mostly from the habitat use and behavioral attributes of species in association with differences in sampling surveys, which resulted in differential detectability. We also recorded variations in the distribution of records per sampling point and at the same spot, evidencing the stochasticity associated with the camera-trap location and orientation. These findings reinforce that for species whose specimens cannot be individually identified, the capture rates should be best used as inputs for presence and detection analyses and for behavior inferences (regarding the preferential use of habitats and activity patterns, for example). Comparisons between capture rates or among relative abundance indices, even for the same species, should be made cautiously.
13 Influência do desenho amostral na taxa de captura e na estrutura da comunidade de mamíferos registrada a partir de armadilhas fotográficas no sudeste do Brasil
Resumo: A distribuição das espécies e os atributos das populações são dados críticos para a conservação da biodiversidade. Enquanto ferramenta para obtenção de tais dados, as armadilhas fotográficas tem se tornado cada vez mais comuns em estudos em todo o mundo. No entanto, há divergências sobre como os registros fotográficos devem ser utilizados devido a problemas de detectabilidade e limitações
relacionadas ao uso das taxas de captura como substitutos de abundância. No presente estudo foram avaliadas variações na taxa de captura e na estrutura da comunidade de mamíferos registrada por meio de armadilhas fotográficas utilizando-se quatro diferentes desenhos amostrais. As armadilhas foram
instaladas em estradas internas (primeiro e quarto anos), a 100-200 m de distância das estradas (bordas internas; segundo ano) e a 500 m da estrada mais próxima (interior da mata; terceiro ano). As
comunidades de mamíferos amostradas em bordas internas e interior da floresta foram semelhantes entre si, mas diferiram significativamente daquelas amostradas em estradas. Além disso, para a maioria das espécies, o número de registros e o sucesso de captura variaram muito entre os quatro desenhos amostrais. A partir de um experimento desenvolvido paralelamente às amostragens, foi observado ainda que
armadilhas fotográficas colocadas em um mesmo tronco de árvore, mas voltadas para direções opostas, registraram poucas espécies em comum. Nossos resultados demonstram que presença ou não detecção e taxas de captura variam entre diferentes desenhos de amostragem. Essas diferenças são atribuídas
principalmente ao uso do habitat e atributos comportamentais das espécies, em associação com diferenças no desenho amostral, resultando em diferenças na detectabilidade. Foram também registradas variações na distribuição de registros entre pontos de amostragem e para o mesmo local, evidenciando a
14 informações relacionadas a comportamento (uso preferencial de habitats e padrão de atividade, por exemplo). Comparações entre taxas de captura ou índices de abundância relativa, mesmo para a mesma espécie, devem ser realizadas com cautela.
15
Introduction
The distributions of species and population abundance or density are critical data for planning and evaluating research priorities and strategies for biodiversity conservation. The quality of inventories depends on the ability of the surveying team and the adequacy of the procedures, particularly regarding the efficiency of the sampling methods used for each target group. Indeed, the methods used in mammal inventories are generally appropriate for collecting or observing only a fraction of species, given the morphological and behavioral diversity in this group (Voss & Emmons 1996).
Failures to detect species are common errors in surveys and are related to the detection
probability of each species (Gu & Swihart 2004). The detection of mammals may vary depending on the animal’s sex, age, social status (alpha or beta and resident or transient) and territoriality (Larrucea et al. 2007), the distribution of reproductive females, the local abundance of prey (Guil et al. 2010),
intraspecific and interspecific interactions (Harmsen et al. 2010), human pressure and the physical environment (Guil et al. 2010). Furthermore, the seasonality of the species can change the intensity with which a given species is recorded (Yasuda 2004), and the capture rate is influenced by the temporal and seasonal activity patterns of the species (Larrucea et al. 2007). Differences in detectability among species also can be caused by relatively subtle differences in behavior (Harmsen et al. 2010). It is thus important to evaluate differences in capture efficiency to distinguish true absence from the non-detection of a species in mammal inventories (Jennelle et al. 2002). And detection is indicative of presence, but non-detection is not equivalent to absence (MacKenzie et al. 2002).
16 identified and studied using capture-recapture methods based on camera traps. However, these indices use the rates of camera-trap capture as the main input to estimate abundance (e.g., Carbone et al. 2001, O'Brien et al. 2003), and the variation in the detection probability of each species is not considered. Thus, for relative abundance indices to be useful, some authorities recommend the calibration of indices using camera trap data (Carbone et al. 2001) and the evaluation of the index accuracy (Diefenbach et al. 1994) to demonstrate the existence of a functional relationship between the index and the true value
(Diefenbach et al. 1994). However, the calibration process is not trivial, and there is no firm consensus on the best strategy to follow (e.g., O'Brien et al. 2003, Rowcliffe et al. 2008, Rovero & Marshall 2009).
Notwithstanding the increase in the popularity of camera traps, the imperfect detectability and the appropriate application of capture rates remain very important issues, particularly regarding the use of camera-trap records as surrogates for abundance and population density of species whose individuals cannot be identified (Carbone et al. 2001, Carbone et al. 2002, Jennelle et al. 2002, Yasuda 2004, Larrucea et al. 2007, Srbek-Araujo & Chiarello 2007, Rowcliffe et al. 2008, Rovero & Marshall 2009, Harmsen et al. 2010). Despite these limitations and recommendations, the index of relative abundance, without calibration, obtained from the rate or frequency of capture has been widely used in camera-trap studies (e.g., Jácomo et al. 2004, O'Brien et al. 2003, Silveira et al. 2003, Trolle & Kéry 2005, Weckel et al. 2006, Kasper et al. 2007, Rowcliffe et al. 2008, Rovero & Marshall 2009), without consideration of the variations in species capture probability (Gu & Swihart 2004). These issues are relevant and need to be better understood because camera-trap data have been used in management and conservation studies around the world, including ratings of the distribution and monitoring of threatened species.
17 hypothesis). If this hypothesis is true, the sampling design does not interfere with the community
recorded, and the capture rates could be considered sufficient input to calculate the relative abundance indices; therefore, the calibration of the indices may be overlooked.
Material and Methods
1. Study Area
The study was conducted in Reserva Natural Vale (RNV; Vale Natural Reserve), which is located 30 km north of the Doce River between the municipalities of Linhares and Jaguaré in the state of Espírito Santo, southeastern Brazil (19°06' S, 39°45' W and 19°18' S, 40°19' W). The RNV (~23,000 ha)
encompasses approximately 5% of the remaining forest in the state (FSOSMA & INPE 2011) and is adjacent to the Reserva Biológica de Sooretama (RBS; Sooretama Biological Reserve: ~24,250 ha).
The topography in RNV is relatively flat, with the elevation ranging between 28 and 65 m above sea level (Jesus & Rolim 2005). The climate is tropical hot and humid (Awi, following the Köppen system) with wet summers (October to March) and dry winters (April to September) (Jesus & Rolim 2005). The average annual temperature is 23.3°C (14.8 and 34.2°C average minimum and maximum, respectively). The average annual rainfall is 1,202 mm, with high inter-annual variability (Jesus & Rolim 2005). During the years of study, for example, the annual rainfall ranged from 857 mm (2007) to 1,638 mm (2006), and the average annual rainfall was 1,194 mm.
18 cultivation (Jesus & Rolim 2005). In recent years, particularly after 2007, there has been an increase in Eucalyptus plantations surrounding the reserve.
2. Data Collection
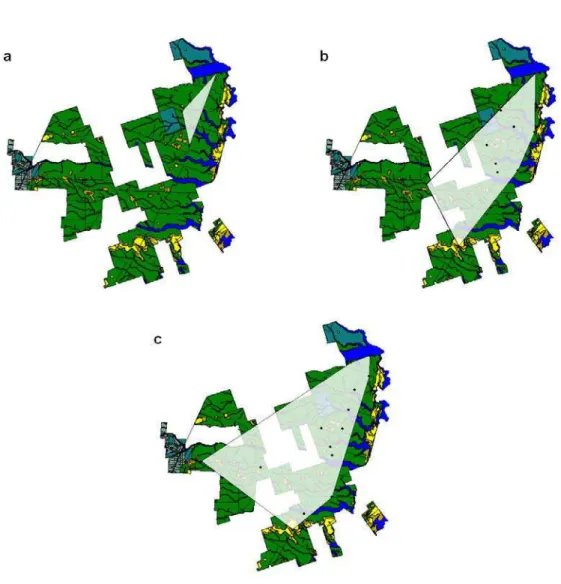
The sampling designs used in the four years were designed primarily to meet the requirements for estimating jaguar (Panthera onca) abundance and density. We used four different sampling designs over approximately 48 months: June 2005 to June 2006 (first year or year 1); June 2006 to August 2007 (second year or year 2); August 2007 to October 2008 (third year or year 3); and June 2009 to February 2010 (fourth year or year 4). Cam Trakker game cameras (Cam Trak South Inc., USA) were used in the first year; in the other years, we used Tigrinus cameras (conventional model; Tigrinus Research
Equipment, Brazil). Both brands of equipment have a passive infrared sensor and 35 mm cameras, which were loaded with 36-exposure / 200 or 400 ASA negative films. The camera traps were operated 24 hours/day, and the delay between photographs was set to 20 seconds. The equipments were checked every 30 days for cleaning and to replace the batteries and film. The camera traps were attached to tree trunks at approximately 45 cm above the ground. In the first year, all trapping stations contained a pair of cameras, and the units were installed facing each other. In the other years, we used only one camera trap per trapping station. No baits were used.
19 and third years. The camera-trap sampling points were always set in the predominant type of forest existing in RNV (Tabuleiro Forest). The main differences among the sampling designs are summarized in Table 1.
Figure 1
Table 1
In the second year, we set up a 30-day experiment to test whether two cameras installed at the same spot would result in the same list of species. For this experiment, we used 8 pairs of Tigrinus cameras (the year 2 sampling point or principal camera [C1] and an additional camera [C2]) scattered throughout RNV. Every pair of cameras was positioned on the same tree trunk but faced in opposing directions (one camera rotated 180 degrees from the other) and remained operational for 30 days. We directed both of the cameras from each pair at points with similar characteristics to minimize sampling differences related to habitat conditions (e.g., the presence of tracks and/or other signs of animal activity).
3. Data Analysis
20 and Mazama gouazoubira, due to difficulties in distinguishing each congeneric species from most of the photographs. Only native species were considered in the statistical analyses.
The Mao Tau estimator (the accumulation of the observed species) was used to calculate
randomized species accumulation curves considering 10-day bins of camera trapping as units of sampling effort. The lower and upper bounds of the 95% confidence interval (CI) were graphed. We used the first-order Jackknife (Jackknife 1) to estimate the species richness for each sampling design. This non-parametric estimator is based on the number of unique species contained in each observation (Smith & Pontius 2006), and according to Tobler et al. (2008), it performs better than other estimators for data sets derived from large numbers of camera days. We also selected this estimator for its reduced bias and because it is based on the presence or absence of a species rather than on the abundance of the species (Smith & Pontius 2006). For these analyses, we used the program EstimateS (version 7.5.2), and for randomizations, we used 1,000 runs.
The Spearman rank correlations and the qualitative cluster analysis (based on the Jaccard
coefficient) were used to compare the mammal communities recorded by the four sampling designs (n=27 cases). Both of the analyses were performed using the presence-absence data only (with values of “1” when a mammal species was detected by a sampling design and “0” when it was not). For these analyses, the program Statistica was used (version 7.1).
Given the differences in the sampling effort, we calculated the capture success of each mammal species ([number of records for each species / sampling effort] X 100) to obtain comparable capture rates for each species among the years. We used the Spearman rank test to investigate whether there were correlations in the capture rates of each species among the sampling designs. For this analysis, only species recorded in two or more years (n=23 cases) were included to reduce the occurrence of spurious correlations arising from the high frequency of zeros (four native species were detected in only one year). The tests were performed in the program Statistica (version 7.1).
21 year, and the capture success of each species was calculated for every sampling point from each year of study. The program SPSS (version 8.0) was used for this analysis. And the results were displayed graphically to species with more contrasting detection rates (more than 10 records for the whole study). We complemented this analysis by contrasting the capture success of each species among the sampling designs using a Kruskal-Wallis one-way analysis of variance. For these analyses, the capture success values of each species were used as dependent variables, using the sampling points as replicates (n=58 cases), and the years of sampling were the grouping variable (categorical). Only the species recorded in two or more years (n=23 cases) were considered in the Kruskal-Wallis one-way analysis of variance. For these analyses, the program Statistica was used (version 7.1). The variation in the capture success was assessed because these data can be used as an indicative of variation in the capture or detection probability of species.
4. Assumptions
Because weather variation can influence the detection of mammals and therefore the camera-trap results, we conducted preliminary tests to evaluate whether the capture success was significantly
22 capture success were observed for only 11 species (40.74%), and most cases were restricted to one year (nine species). For two species, there were significant correlations (Spearman Rank, p<0.05) for two years, but for one of those species, the correlation between the average monthly temperature and capture success was positive in one year and negative in the other year. These results suggest a small influence of annual climate variation on the capture rates and leave us comfortable in assuming that the variations in our camera-trap data result mostly from differences among the sample designs.
Another limitation of our sampling design is that due to the theft of equipment and maintenance problems of some of the units, we had to choose a different brand of cameras in the second year. We are aware that variations in the efficiency and capability to record species among different brands or models of camera traps can influence the results (Srbek-Araujo & Chiarello 2007), particularly when film and digital cameras are compared (Kelly & Holub 2008). Because of that influence, it might be difficult to distinguish whether the variation in the number of records in a given survey is due to differences in trapping success among species or among the cameras (Kelly & Holub 2008). Fortunately, only film cameras were used in our study, and the differences between the equipment are relevant only to year 1, when Cam Trakker cameras were used, but not the other years (including the 30-day experiment), when only Tigrinus cameras were used. It is also relevant to stress that overall, the results from the first and fourth years were more similar to each other than to the second and third years, though different brands of cameras were used. For these reasons, we assumed that the use of two brands of cameras had no
significant influence on our main findings.
Results
23 community composition also varied among the sampling designs: 12 species (40.0%) were recorded in all four designs; four species (13.3%) were recorded in three designs; nine species (30.0%) were recorded in two designs; and five species (16.7%) were recorded in only one design. Six species (20.0%) were recorded only on roads, and four (13.3%) were recorded only on internal edges and/or in the forest interior. Some of the species recorded frequently along roads were rarely or not at all recorded when the cameras were set up away from roads, especially Panthera onca, Leopardus pardalis, Cerdocyon thous, Procyon cancrivorus and Sylvilagus brasiliensis (Table 2). In contrast, some species were recorded
mostly away from roads: Dasypus sp., Nasua nasua, Pecari tajacu, Mazama sp., Cuniculus paca and Dasyprocta leporina.
Table 2
Records of species not previously photographed occurred in all of the sampling periods, and the last inclusion of new species occurred in the 43rd month of the study. The sample-based species
accumulation curve for the first year leveled off, indicating a more complete survey (Figure 2), although the number of recorded species was much lower than the total number of observed species for the whole study. The curves for the other three years of sampling, as well as the curve for the whole study, did not reach an asymptote and showed a wide 95% CI interval (Figure 2). Wider confidence intervals were observed for years 2 and 4.
Figure 2
24 richness was higher than the observed value (21 and 23 species, respectively); for the first year (16.97 [± 0.97] species), the estimated richness was lower than the observed value (18 native species).
A significant correlation of the mammal communities (list of species) was found only between the second and third years (Spearman Rank, rs=0.402, p<0.05, n=27 pairs), when the camera traps were placed away from roads. The cluster analyses indicated that the most dissimilar community was sampled during the last year, which was closer to the first year (with the samplings on roads) than to the other two years (Figure 3). Similarly, the distribution of the capture success in the set of species recorded was highly correlated between the first and fourth years (Spearman Rank, rs=0.588, p<0.05, n=23 pairs) and between the second and third years (Spearman Rank, rs=0.914, p<0.05, n=23 pairs).
Figure 3
Although the results from the internal edges (second year) and forest interior (third year) were more similar to each other, the capture rate (and therefore the capture success) for most species varied among the years (Table 2). The same pattern was also found between the first and fourth years. Overall, the variation in capture success tended to be lower for the first year (with a smaller confidence interval and higher precision), but this parameter varied widely both within species among years and among species within years (Figure 4). For several species, the 95% CI showed no overlap among the sample designs, notably for Dasypus sp., Nasua nasua, Leopardus pardalis, Panthera onca, Mazama sp., Dasyprocta leporina and Cuniculus paca (Figure 5). Additionally, the difference in capture success
among the sampling designs was statistically significant for 14 species (Kruskal-Wallis, df=3, n=58 cases, p ≤ 0.05) (Table 3). The number of species recorded at each sampling point ranged from 1 to 15
25 Figure 4
Figure 5
Table 3
During the 30-day experiment, the number of species recorded by both of the cameras (C1+C2) and the interceptions of records from each pair were very low (Table 4). Only the units from three pairs (37.5%) shared 50% or more of the list of species recorded by the pair. For the remaining five pairs (62.5%), each unit shared ≤ 25% of the species pool (Table 4). Four species (Eira barbara, Nasua nasua,
Panthera onca and Puma yagouaroundi) were recorded during the 30-day experiment only by the
additional unit (C2) and were not recorded by the principal camera (C1) even during the 14 months of sampling by this unit. Discrepancies were also observed between units of each pair when compared the total number of records of each species and the overall number of records (sum of the records from all the species).
Table 4
Discussion
We recorded substantial variations in the detection (presence or non-detection) and capture rates of mammals among the four sampling periods. Some species were missed in one or more years, and singular assemblages of elusive species (≤ 5 records/species) were recorded in each of the four sampling
designs. Some of these species maintain their “status” of elusive or rarely recorded even when the whole sampling period is considered, such as Cabassous tatouay, Euphractus sexcinctus, Tamandua
26 all four years of study. According to Tobler et al. (2008), the recording of more elusive species requires larger sampling efforts, and these species are the ones that determine how much time is needed to
complete an inventory (Tobler et al. 2008). In fact, despite the relatively long sampling time in the present study, the camera-trapping inventory of medium-sized and large mammals is not yet complete in RNV. Two elusive species recently recorded in the study area (after 2006) using other methods and potentially recordable by camera traps have not been registered to date: Priodontes maximus (Kerr, 1792) (giant armadillo; Araujo et al. 2009) and Leopardus tigrinus (Schreber, 1775) (oncilla; A.C. Srbek-Araujo, unpublished data). The slope of the sample-based species accumulation curve and the 95% CI interval for the whole study also corroborate the previous affirmation.
For MacKenzie & Royle (2005), the optimal strategy for sampling rare species is to conduct fewer surveys at more sampling points, while for common species, it is more efficient to conduct more intensive surveys at fewer stations. However, Srbek-Araujo & Chiarello (2007) showed that the number of recorded species (common and rare species) is strongly correlated with sampling effort, recommending a sampling effort of at least 250 camera-days at each trapping station for mammal inventories.
Additionally, Tobler et al. (2008) concluded that the camera spacing and total area covered have little influence on the number of species recorded and the survey success, with the survey effort being the main factor determining the number of recorded species. Our present data corroborate these last two studies and reinforce the importance of survey effort for recording elusive or rare species in camera-trapping inventories. In contrast, in occupancy studies, the number of sampling points can be as or more important than the number of sampling days at each trap station (MacKenzie et al. 2002). However, for these studies, the sampling points and the timing of repeat surveys must be defined appropriately, as described by MacKenzie & Royle (2005).
27 sampling surveys performed poorly at estimating the total number of species present across the whole study area, and the list of species recorded each year was different among the surveys. The different results among the years highlight that species inventories also need to achieve good spatial replication and cover a range of habitat types to adequately characterize a mammal community (Colwell & Coddington 1994, Engeman 2005; Tobler et a. 2008). In addition to the differences related to the set of species recorded each year, the differences among the sampling designs are also represented by differences in the capture rate for most of the species recorded during the present study.
We consider that the differences in capture rates obtained for the same species during our study resulted mostly from habitat use (i.e., species presence and frequency of use) and the behavioral attributes of the species in association with differences in the sampling design, which resulted in differential
detectability and different capture success. Different species were more likely to be recorded on or off roads/trails, corroborating studies conducted elsewhere (Trolle & Kéry 2005, Srbek-Araujo & Chiarello 2007, Harmsen et al. 2010, Weckel et al. 2006). Some species were detected exclusively or preferentially on roads (e.g., Panthera onca, Leopardus pardalis, Sylvilagus brasiliensis, Cerdocyon thous and Procyon cancrivorus) and can be referred to as “trail followers”. Other taxa, the “generalist users”, were detected
equally on roads and away from them (Tapirus terrestris and Tayassu peccary). The remaining species, the “trail crossers”, seemed to avoid roads and were mostly recorded on the forest edge or in the forest interior. These distinctions are relevant given that both roads and trails have been widely used for sampling mammals, either because they offer easy access into the forest or because some species, particularly carnivores, might be highly “captured” in these places (e.g., Silveira et al. 2003, Trolle & Kéry 2005, Beisiegel 2009). Therefore, the risk of tendentious sampling must be considered when designing studies for mammal community inventories.
28 photographed using forested areas (Weckel et al. 2006), while in RNV, jaguar was recorded, although rarely, on internal edges and forest interior. In our study, Panthera onca and Leopardus pardalis were frequently recorded on roads, and both species have low capture rates outside roads, while Puma concolor was captured only once and in forest interior. Harmsen et al. (2010) recorded Leopardus
pardalis only on trails (0.5 to 4.5 m width) and the capture sites of Panthera onca were also adequate for
capturing Puma concolor. Differences between our study and Harmsen et al. (2010) were also observed for Tayassu peccary, Mazama sp. and Nasua nasua regarding their tendency to follow or cross trails. These examples of differences between studies suggest idiosyncratic habitat use patterns for some mammal species, which can induce erroneous comparisons of data even when applied to similar sample designs. These data also corroborate those of Jennelle et al. (2002), who cited site-specific detection probabilities as one of the sources of variation in camera-trap data. Therefore, if individual species may have consistent differences in detectability in different areas, the survey designs should not automatically follow designs that have been useful in other areas, even for the same target species.
29 We observed a wide variation in the capture success at each sampling point, both within and among the sampling periods, for most of the species recorded at RNV. The 30-day experiment with paired cameras also revealed that the variation in camera-trap records may be high at the same spot. These data illustrate the stochasticity associated with camera location and orientation and lend support to the idea that there are other biotic or abiotic factors, not yet fully understood, influencing the delivery of camera-trap records and interfering with probability of detection of species over time. Similarly, Silveira et al. (2010) noticed that the “long-term” fluctuation in capture rate is more complex than the seasonal variation in the number of records obtained by camera traps. And there are not enough data to identify the source of these variations (Silveira et al. 2010). In another study, five of the 15 species recorded by Espartosa et al. (2011) were captured only by camera trapping or track counts using sampling units consisting of one camera trap and four sand plots set at 5 m around the camera. These findings corroborate our previous study (Srbek-Araujo & Chiarello 2007), in which we suggested that factors intrinsic to the place at which the equipment was installed might influence the records obtained. Our results further exemplify how much variability can be present in camera-trap data, which can restrict the application of records and blur conclusions, even when the same sampling methods are used and similar sampling designs are applied. Because of that variability, researchers conducting camera-trap surveys in time series should try to ensure a consistent setup of cameras (e.g., leaving cameras in situ for a long time) to reduce the stochasticity effect.
30 According to Johnson (2008), for the valid use of indices to detect changes in density or
31 Our results provide further support to previous studies, indicating that detection is not similar for all species, neither in the same area nor between similar sampling designs (e.g., Tobler et al. 2008, Harmsen et al. 2010), which is aggravated by the stochasticity associated with the camera-trap location and orientation. Consequently, the capture rate obtained by camera traps is not standard and cannot be correlated with population size; therefore, the capture rate does not represent a precise input to assess the relative abundance of species without suitable data processing. To use the number of records in the evaluation of quantitative attributes of a species over time and among sampling sites, it is necessary to obtain comparable capture rates (Jennelle et al. 2002, Engeman 2005). To do so, we must ensure that the field protocols are standardized and simultaneously applied (Espartosa et al. 2011) and assume that the detection probability of target species is similar among the studied sites (Harmsen et al. 2010). Moreover, for abundance analyses, camera-trap surveys must conform to an appropriate sampling design (with adequate spatial and temporal replication) to produce indices with a useful level of precision (Engeman 2005), and the indices must be calibrated (Carbone et al. 2001). Otherwise, the use of photographic records per se for population inferences can lead to erroneous interpretations of the number of individuals composing the populations, leading to under- or over-estimates of the populations of species whose specimens cannot be individually identified.
32 and detection analyses and for behavior inferences (regarding the preferential use of habitats and activity patterns, for example). Alternatively, the camera-trap data from appropriate sampling designs could be used to estimate species occupancy, which may be used as a surrogate for abundance (MacKenzie et al. 2002, MacKenzie & Royle 2005), as applied by Ahumada et al. (2011). When it is possible to distinguish individuals, camera-trap data can be used to estimate population parameters through the use of capture-recapture probabilistic models, as proposed by Karanth (1995) and Karanth & Nichols (1998).
Conclusions
33
Acknowledgments
The data in this paper are part of the research project “Population Size, Density and Habitat Use by Jaguar (Panthera onca, Carnivora, Felidae) in Reserva Natural Vale, Linhares, Espírito Santo / Brazil”. We thank Vale S.A. / Instituto Ambiental Vale for their financial support. H.J. Del-Duque Junior, E.R. Coelho, B. Guerin and J. Simplício for their help with the field activities and E.C. Landau from Empresa Brasileira de Pesquisa Agropecuária (Embrapa) for the inestimable help with the climatic variables data. We thank anonymous reviewers for comments that helped to improve the paper. A. G. Chiarello is sponsored by CNPq (303273/2008-9 and 306848/2011-2).
References
AHUMADA, J.A., SILVA, C.E.F., GAJAPERSAD, K., HALLAM, C., HURTADO, J., MARTIN, E., MCWILLIAM, A., MUGERWA, B., O'BRIEN, T., ROVERO, F., SHEIL, D., SPIRONELLO, W.R., WINARNI, N. & ANDELMAN, S.J. 2011. Community structure and diversity of tropical forest mammals: data from a global camera trap network. Philos. Trans. R. Soc. Lond., Ser. B 366:2703-2711.
BEISIEGEL, B.M. 2009. First camera-trap record of bush dogs in the state of São Paulo, Brazil. Canid News 12.5. http://www.canids.org/canidnews/12/Bush_dogs_in_Sao_Paulo.pdf (last accessed on 08 July 2010).
CARBONE, C., CHRISTIE, S., CONFORTI, K., COULSON, T., FRANKLIN, N., GINSBERG, J.R., GRIFFITHS, M., HOLDEN, J., KAWANISHI, K., KINNAIRD, M., LAIDLAW, R., LYNAM, A., MACDONALD, D.W., MARTYR, D., MCDOUGAL, C., NATH, L., O’BRIEN, T.O.,
34 CARBONE, C., CHRISTIE, S., CONFORTI, K., COULSON, T., FRANKLIN, N., GINSBERG, J.R.,
GRIFFITHS, M., HOLDEN, J., KINNAIRD, M., LAIDLAW, R., LYNAM, A., MACDONALD, D.W., MARTYR, D., MCDOUGAL, C., NATH, L., O’BRIEN, T.O., SEIDENSTICKER, J., SMITH, D.J.L., TILSON, R. & WAN SHAHRUDDIN, W.N. 2002. The use of photographic rates to estimate densities of tigers and other cryptic mammals: response to Jennelle et al. Anim. Conserv. 5(2):121-132.
CHIARELLO, A.G. 1999. Effects of fragmentation of the Atlantic Forest on mammal communities in south-eastern Brazil. Biol. Conserv. 89:71–82.
COLWELL, R.K. & CODDINGTON, J.A. 1994.. Estimating terrestrial biodiversity through extrapolation. Phil. Trans. R. Soc. Lond. 345:101-118.
DIEFENBACH, D.R., CONROY, M.J., WARREN, R.J., JAMES, W., BAKER, L.A. & HON, T. 1994. A test of the scent-station survey technique for bobcats. J. Wildl. Manage. 58:10–17.
ENGEMAN, R.M. 2005. Indexing principles and a widely applicable paradigm for indexing animal populations. Wildl. Res. 32:203–210.
ESPARTOSA, K.D., PINOTTI, B.T. & PARDINI, R. 2011. Performance of camera trapping and track counts for surveying large mammals in rainforest remnants. Biodiv. Conserv. 20(12):2815-2829. FSOSMA & INPE. 2011. Atlas dos Remanescentes Florestais da Mata Atlântica - Período 2008-2010.
Fundação SOS Mata Atlântica & Instituto Nacional de Pesquisas Espaciais, São Paulo.
http://mapas.sosma.org.br/site_media/download/atlas_2008-10_relatorio%20final_versao2_julho2011.pdf (last accessed on 10 August 2012).
GROOT-BRUINDERINK, G.W.T.A., HAZEBROEK, E. & VAN DER VOOT, H. 1994. Diet and condition of wild boar, Sus scrofa scrofa, without supplementary feeding. J. Zool. 233:631–648. GU, W. & SWIHART, R.K. 2004. Absent or undetected? Effects of non-detection of species occurrence
on wildlife-habitat models. Biol. Conserv. 116:195-203.
35 SILVESTRE, F. 2010. Factors conditioning the camera-trapping efficiency for the Iberian lynx (Lynx pardinus). Eur. J. Wildl. Res. 56(4):633-640.
HARESTAD, A.S. & BUNNEL, F.L. 1979. Home Range and Body Weight--A Reevaluation. Ecology 60(2):389-402.
HARMSEN, B.J., FOSTER, R.J., SILVER, S., OSTRO, L. & DONCASTER, C.P. 2010. Differential Use of Trails by Forest Mammals and the Implications for Camera-Trap Studies: A Case Study from Belize. Biotropica 42(1):126-133.
JÁCOMO, A.T.A., SILVEIRA, L. & DINIZ-FILHO, J.A.F. 2004. Niche separation between the maned wolf (Chrysocyon brachyurus), the crab-eating fox (Dusicyon thous) and the hoary fox (Dusicyon vetulus) in central Brazil. J. Zool. 262:99-106.
JENNELLE, C.S., RUNGE, M.C. & MACKENZIE, D.I. 2002. The use of photographic rates to estimate densities of tigers and other cryptic mammals: a comment on misleading conclusions. Anim. Conserv. 5(2):119-120.
JESUS, R.M. & ROLIM, S.G. 2005. Fitossociologia da Mata Atlântica de Tabuleiro. Boletim Técnico da Sociedade de Investigações Florestais 19:1-149.
JOHNSON, D.H. 2008. In Defense of Indices: The Case of Bird Surveys. J. Wildl. Manage. 72:857-868. KARANTH, K.U. 1995. Estimating tiger (Panthera tigris) populations from camera-trap data using
capture-recapture models. Biol. Conserv. 71:333–338.
KARANTH, K.U. & NICHOLS, J.D. 1998. Estimation of tiger densities in India using photographic captures and recaptures. Ecology 79:2852–2862.
KASPER, C.B., MAZIM, F.D., SOARES, J.B.G., OLIVEIRA, T.G. & FABIÁN, M.E. 2007.
Composição e abundância relativa dos mamíferos de médio e grande porte no Parque Estadual do Turvo, Rio Grande do Sul, Brasil. Rev. Bras. Zool. 24(4):1087–1100.
36 LARRUCEA, E.S., BRUSSARD, P.F., JAEGER, M.M. & BARRETT, R.H. 2007. Cameras, coyotes, and
the assumption of equal detectability. J Wildl Manage 71(5):1682–1689.
MACKENZIE, D.I., NICHOLS, J.D., LACHMAN, G.B., DROEGE, S., ROYLE, J.A. & LANGTIMM, C.A. 2002. Estimating site occupancy rates when detection probabilities are less than one. Ecology 83:2248–2255.
MACKENZIE, D.I. & ROYLE, J.A. 2005. Designing occupancy studies: general advice and allocating survey effort. J. Appl. Ecol. 42:1105–1114.
O'BRIEN, T.G., KINNAIRD, M.F. & WIBISONO, H.T. 2003. Crouching tigers, hidden prey: Sumatran tiger and prey populations in a tropical forest landscape. Anim. Conserv. 6(2):131-139.
ROVERO, F. & MARSHALL, A.R. 2009. Camera trapping photographic rate as an index of density in forest ungulates. J. Appl. Ecol. 46:1011–1017.
ROWCLIFFE, J.M., FIELD, J., TURVEY, S.T. & CARBONE, C. 2008. Estimating animal density using camera traps without the need for individual recognition. J. Appl. Ecol. 45:1228–1236.
SILVEIRA, L., JACOMO, A.T.A. & DINIZ-FILHO, J.A.F. 2003. Camera trap, line transect census and track surveys: a comparative evaluation. Biol. Conserv. 114:351-355.
SILVEIRA, L.F., BEISIEGEL, B.M., CURCIO, F.F., VALDUJO, P.H., DIXO, M., VERDADE, V.K., MATTOX, G.M.T. & CUNNINGHAM, P.T.M. 2010. Para que servem os inventários de fauna? Estudos Avançados 24:173-207.
SMITH, C.D. & PONTIUS, J.S. 2006. Jackknife Estimator of Species Richness with S-PLUS. Journal of Statistical Software 15:1-12. http://www.jstatsoft.org/ (last accessed on 22 January 2012).
SRBEK-ARAUJO, A.C. & CHIARELLO, A.G. 2005. Is camera-trapping an efficient method for surveying mammals in Neotropical forests? A case study in south-eastern Brazil. J. Trop. Ecol. 21(1):121-125.
37 SRBEK-ARAUJO, A.C., SCOSS, L.M., HIRSCH, A. & CHIARELLO, A.G. 2009. Recent records of the
giant-armadillo Priodontes maximus (Kerr, 1792) (Cingulata, Dasypodidae), in the Atlantic Forest of Minas Gerais and Espírito Santo: last refuges of the species in the Atlantic forest? Zoologia 26(3):461-468.
TOBLER, M.W., CARRILLO-PERCASTEGUI, S.E., LEITE PITMAN, R., MARES, R. & POWELL, G. 2008. An evaluation of camera traps for inventorying large- and medium-sized terrestrial rainforest mammals. Anim. Conserv. 11(3):169-178.
TOMAS, W.M. & MIRANDA, G.H.B. 2003. Uso de equipamento fotográfico automático em levantamentos populacionais. In Métodos de Estudo em Biologia da Conservação & Manejo da Vida Silvestre (L.Cullen Jr, R. Rudran. & C. Valladares-Padua, eds.). Editora UFPR, Curitiba, p. 243-267.
TROLLE, M. & KÉRY, M. 2005. Camera-trap study of ocelot and other secretive mammals in the northern Pantanal. Mammalia 69(3-4):405-412.
VAUGHAN, T.A., RYAN, J.E. & CZAPLEWSKI, N.J. 2000. Mammalogy. 4 ed. Thomson Learning Academic Resource Center, Stanford.
VOSS, R.S. & EMMONS, L. 1996. Mammalian diversity in Neotropical lowland rainforests: a preliminary assessment. Bull. Am. Mus. Nat. Hist. 230:1-115.
WECKEL, M., GIULIANO, W. & SILVER, S. 2006. Jaguar (Panthera onca) feeding ecology: distribution of predator and prey through time and space. J. Zool. 270:25-30.
38 Tables
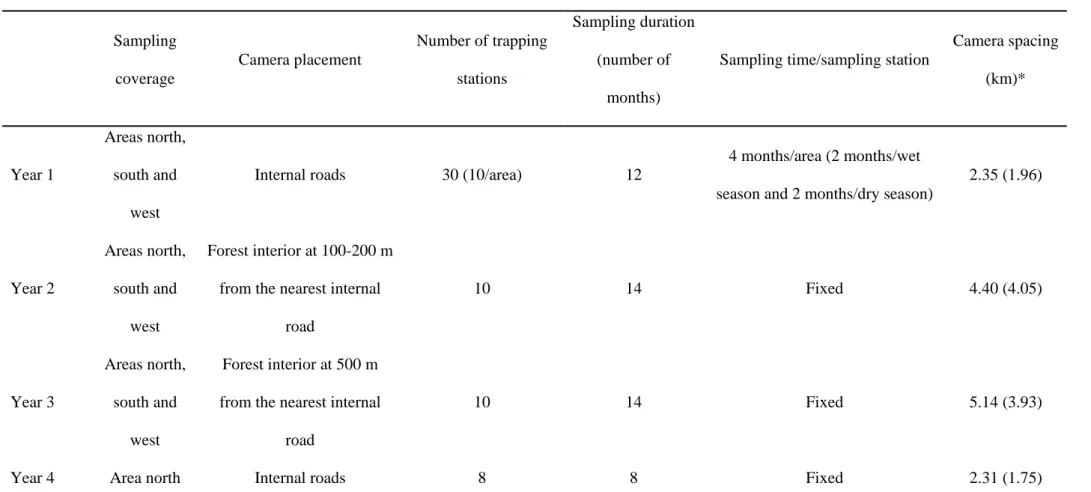
Table 1. Features of the sampling designs used in each year of the study in Reserva Natural Vale (June 2005 to February 2010).
Sampling coverage
Camera placement
Number of trapping stations
Sampling duration (number of
months)
Sampling time/sampling station
Camera spacing (km)* Year 1 Areas north, south and west
Internal roads 30 (10/area) 12
4 months/area (2 months/wet season and 2 months/dry season)
2.35 (1.96)
Year 2
Areas north, south and
west
Forest interior at 100-200 m from the nearest internal
road
10 14 Fixed 4.40 (4.05)
Year 3
Areas north, south and
west
Forest interior at 500 m from the nearest internal
road
10 14 Fixed 5.14 (3.93)
Year 4 Area north Internal roads 8 8 Fixed 2.31 (1.75)
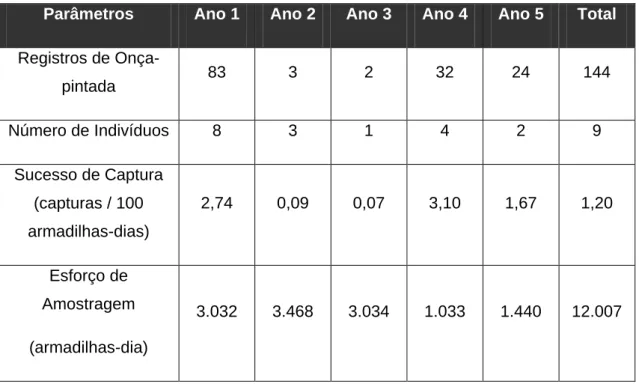
39 Table 2. Number of records (n) and capture success (CS) for each mammal species recorded by four camera trapping sampling designs in Reserva Natural Vale (June 2005 to February 2010). The species richness, sampling effort (camera-days) and total capture success are also shown for each sampling design separately and in total.
Order Species
Year 1 (roads)
Year 2 (internal edges)
Year 3 (forest interior)
Year 4 (roads)
Total
n CS n CS n CS n CS
Didelphimorphia
Didelphis aurita (Wied-Neuwied, 1826) 5 0.16 21 0.61 3 0.10 14 1.36 43
Metachirus nudicaudatus (Desmarest, 1817) 7 0.20 7
Cingulata
Cabassous tatouay (Desmarest, 1804) 1 0.03 1 0.10 2
Dasypus sp. (Linnaeus, 1758)a 10 0.33 74 2.13 38 1.25 11 1.06 133
Euphractus sexcinctus (Linnaeus, 1758) 1 0.03 1 0.03 2
Pilosa Tamandua tetradactyla (Linnaeus, 1758) 1 0.03 1 0.10 2
Primates
Callithrix geoffroyi (É. Geoffroy in Humboldt, 1812) 1 0.10 1
Sapajus robustus (Kuhl, 1820) 2 0.06 3 0.29 5
Carnivora
Canis lupus familiaris (Linnaeus, 1758) 2 0.07 2
40
Galictis cuja (Bell, 1826) 1 0.10 1
Nasua nasua (Linnaeus, 1766) 17 0.56 71 2.05 47 1.55 1 0.10 136
Procyon cancrivorus (G. Cuvier, 1798) 17 0.56 1 0.10 18
Eira barbara (Linnaeus, 1758) 7 0.20 3 0.10 10
Leopardus pardalis (Linnaeus, 1758) 67 2.21 13 0.37 5 0.16 16 1.55 101
Leopardus wiedii (Schinz, 1821) 1 0.03 2 0.07 2 0.19 5
Panthera onca (Linnaeus, 1758) 80 2.64 3 0.09 2 0.07 32 3.10 117
Puma concolor (Linnaeus, 1771) 1 0.03 1
Puma yagouaroundi (É. Geoffroy Saint-Hilaire, 1803) 3 0.10 9 0.26 3 0.10 4 0.39 19 Perissodactyla Tapirus terrestris (Linnaeus, 1758) 68 2.24 51 1.47 50 1.65 8 0.77 177
Artiodactyla
Tayassu pecari (Link, 1795) 5 0.16 2 0.06 3 0.10 10
Pecari tajacu (Linnaeus, 1758) 51 1.47 46 1.52 2 0.19 99
Mazama sp. (Rafinesque, 1817)b 57 1.88 378 10.90 563 18.56 34 3.29 1,032
Rodentia
Sciurus aestuans (Linnaeus, 1766) 16 0.46 17 0.56 33
Hydrochoerus hydrochaeris (Linnaeus, 1766) 5 0.16 2 0.07 3 0.29 10
41
Dasyprocta leporina (Linnaeus, 1758) 16 0.53 231 6.66 152 5.01 16 1.55 415
Lagomorpha Sylvilagus brasiliensis (Linnaeus, 1758) 42 1.39 2 0.19 44
Number of Records 423 1,133 1,029 205 2,790
Number of Species 17 (19) 19 (21) 18 (20) 21 (23) 28 (30)
Sampling Effort 3,032 3,468 3,034 1,033 10,567
Capture Success 13.95 32.67 33.92 19.85 26.40
a
Dasypus novemcinctus (Linnaeus, 1758) and Dasypus septemcinctus (Linnaeus, 1758). b
42 Table 3. Number of sampling points (p), amplitude of records per trap station (am) and average number of records per sampling point (av) for each of the mammal species recorded using four camera trapping sampling designs in Reserva Natural Vale (June 2005 to February 2010). Kruskal-Wallis one-way analysis of variance results are also shown for each species tested (df=3, n=58 cases).
Species
Year 1 Year 2 Year 3 Year 4
Kruskal-Wallis
p am av p am av p am av p am av
C. tatouay - - - 1 1 1.00 - - - 1 1 1.00 H = 4.6318, p = 0.201
C. geoffroyi - - - 1 1 1.00
-S. robustus - - - 1 2 2.00 - - - 1 3 3.00 H = 4.6318, p = 0.201
C. thous 10 1 - 4 2.40 - - - 4 2 - 18 8.50 H = 11.103, p = 0.011
C. paca 4 1 1.00 10 1 - 50 19.40 8 1 - 38 11.38 4 1 - 14 4.50 H = 30.3992, p < 0.001 D. leporina 6 1 - 4 2.67 10 5 - 47 23.10 10 1 - 58 15.20 4 2 - 9 4.00 H = 31.7385, p < 0.001 Dasypus sp. 4 1 - 4 2.50 9 3 - 15 8.22 5 1 - 26 7.60 2 4 - 7 5.50 H = 18.6732, p < 0.001
D. aurita 3 1 - 3 1.67 7 1 - 8 3.00 3 1 1.00 3 4 - 5 4.67 H = 12.2507, p = 0.007
E. barbara - - - 4 1 - 4 1.75 2 1 - 2 1.50 - - - H = 14.2842, p = 0.003
E. sexcinctus 1 1 1.00 - - - 1 1 1.00 - - - H = 1.8327, p = 0.608
G. cuja - - - 1 1 1.00
43 L. pardalis 18 1 - 21 3.72 5 1 - 6 2.60 3 1 - 3 1.67 5 2 - 5 3.20 H = 8.4012, p = 0.039
L. wiedii - - - 1 1 1.00 2 1 1.00 2 1 1.00 H = 7.406, p = 0.060
Mazama sp. 19 1 - 8 3.00 10 27 - 68 37.80 10 14 - 92 56.30 6 1 - 16 5.67 H = 35.5118, p < 0.001
M. nudicaudatus - - - 2 2 - 5 3.50 - - -
-N. nasua 5 1 - 7 3.40 10 1 - 20 7.10 10 1 - 9 4.70 1 1 1.00 H = 28.5303, p < 0.001
P. onca 24 1 - 14 3.33 3 1 1.00 2 1 1.00 7 1 - 16 4.57 H = 24.4249, p < 0.001
P. tajacu - - - 10 1 - 11 5.10 8 1 - 24 5.75 2 1 1.00 H = 40.7603, p < 0.001
P. cancrivorus 9 1 - 5 1.89 - - - 1 1 1.00 H = 7.9002, p = 0.048
P. concolor - - - 1 1 1.00 - - -
-P. yagouaroundi 3 1 1.00 6 1 - 2 1.50 3 1 1.00 4 1 1.00 H = 9.2832, p = 0.026
S. aestuans - - - 5 1 - 9 3.20 7 1 - 6 2.43 - - - H = 29.1555, p < 0.001
S. brasiliensis 8 1 - 15 5.25 - - - 2 1 1.00 H = 6.3342, p = 0.096
T. tetradactyla - - - 1 1 1.00 - - - 1 1 1.00 H = 4.6318, p = 0.201
T. terrestris 19 1 - 11 3.58 2 1 - 14 25.50 10 1 - 11 5.00 4 1 - 3 2.00 H = 2.6301, p = 0.452
44 Table 4. Number of species recorded by each camera separately (C1 and C2), in total (C1+C2) and the intersection of records (number of species [n] and percentage [%] of the total species recorded) during the 30-day period from two cameras positioned on the same tree and facing opposite directions. The results from the pairs of cameras were arranged in increasing rate of intersection of records. See Methods for details.
Samples (pairs)
Cameras Intersection
C1 C2 C1+C2 n %
2 5 0 5 0 0.0
3 5 4 8 1 12.5
4 5 3 7 1 14.3
1 1 5 5 1 20.0
6 1 4 4 1 25.0
5 2 1 2 1 50.0
7 1 2 2 1 50.0
8 3 4 4 3 75.0
45 Figure Legends
Figure 1. Reserva Natural Vale (Espírito Santo state) and locations of the camera traps in the four different sampling designs (June 2005 to February 2010).
Figure 2. Sample-based species-accumulation curves (Mao Tau estimator) for the mammal species recorded during camera trapping surveys in Reserva Natural Vale (June 2005 to February 2010), including the lower and upper bounds of the 95% CI: year 1 (a), year 2 (b), year 3 (c), year 4 (d) and the whole study (e). Each sampling unit (x axis) represents 10 camera-days.
Figure 3. Dendrogram produced by the cluster analyses of the presence/absence data (Jaccard coefficient) of the species recorded by the camera traps in the four sampling designs in Reserva Natural Vale (June 2005 to February 2010).
Figure 4. Means and confidence intervals (95% CI) of the capture success per sampling point for each camera trap design in Reserva Natural Vale (June 2005 to February 2010).
46 Figures
51 CAPÌTULO 2
Parâmetros populacionais, ecologia espacial e interações sociais da onça-pintada (Panthera onca Linnaeus, 1758) na Reserva Natural Vale, sudeste do Brasil
1. Introdução
A Mata Atlântica é classificada como uma das áreas de grande riqueza biológica mais ameaçadas no planeta, apresentando elevadas taxas de perda de hábitat e grande número de endemismos, o que a torna um dos 34 Hotspots mundiais de Biodiversidade (Mittermeier et al. 2004).
Com uma área original de aproximadamente 1.300.000 km2 de extensão, que corresponde a cerca de 15% do território nacional, o bioma Mata Atlântica abrange 17 estados brasileiros, se estendendo do Rio Grande do Sul ao Piauí, e abriga cerca de 61% da população brasileira (aproximadamente 112 milhões de pessoas) (FSOSMA & INPE 2009). A Mata Atlântica encontra-se atualmente restrita a menos de 12% de sua cobertura florestal original (FSOSMA & INPE 2011) e menos de 40% da área total remanescente no bioma encontram-se inseridos em áreas oficialmente destinadas à conservação da Biodiversidade (Myers et al. 2000).
52 apresentam área inferior a 5.000 ha (Gascon et al. 2000). Segundo Ribeiro et al. (2009), mais de 83% dos fragmentos remanescentes de Mata Atlântica possuem menos de 50 ha de extensão e apenas 0,3% são maiores que 10.000 ha.
Neste contexto, os remanescentes passam a atuar como reservatórios de pequenos estoques populacionais que, em conjunto, guardam todo o repertório genético das espécies. Destaca-se, entretanto, que o tamanho das áreas é um dos aspectos relacionados à sua efetividade na manutenção dos processos biológicos das espécies, influenciando também a composição das comunidades mantidas nos remanescentes em longo prazo. Populações pequenas e isoladas estão submetidas a efeitos negativos de estocasticidade ambiental, demográfica e genética, tornando-se mais vulneráveis à extinção (Gilpin & Soulé 1986, Lynch & Lande 1998), onde se destacam o aumento da consanguinidade, a redução da variabilidade genética, a redução das taxas de reprodução e de sobrevivência, entre outros problemas populacionais (Michalski et al. 2001). Neste sentido, a perda de variabilidade genética e, consequentemente, a perda de flexibilidade evolucionária, podem limitar a habilidade das populações em se adaptarem a transformações ambientais em médio e longo prazo. Destaca-se também que populações em áreas reduzidas podem apresentar maior suscetibilidade a doenças devido ao aumento da densidade populacional e favorecimento da transmissão de infecções (Gilbert 1994), alterando a longevidade das espécies pela redução do tempo de vida dos indivíduos (Primack & Rodrigues 2001).
53 tamanho corporal das presas. Isso se deve ao fato da massa corporal do predador estar positivamente relacionada com a massa corporal de sua presa mais comum (Carbone et al. 1999). Estima-se que carnívoros pesando mais de 21,5 kg, especialmente canídeos e felídeos, utilizem principalmente presas que apresentam cerca de 45% de sua própria massa, sendo basicamente predadores de vertebrados (Carbone et al. 1999). Neste sentido, a necessidade energética dos grandes felinos é um importante fator na compreensão de sua vulnerabilidade (Carborne et al. 1999), ressaltando que áreas pequenas não suportam uma comunidade de presas suficiente para suprimento energético de uma comunidade complexa de carnívoros, especialmente considerando espécies de maior tamanho corporal. Segundo Carbone & Gittleman (2002), deve-se considerar também aspectos da biologia das espécies, tais como predação interespecífica e competição com outras espécies, como fatores principais que influenciam a densidade populacional de carnívoros.
A onça-pintada (Panthera onca) é o maior felino das Américas e, portanto, o maior predador terrestre do Brasil. Sua distribuição histórica se estendia do sudoeste dos Estados Unidos ao norte da Argentina (Seymour 1989), sendo atualmente considerada extinta em parte de sua distribuição original (Sanderson et al. 2002). A área atual de ocorrência da espécie está dividida em 48 regiões e corresponde a menos de 46% de sua distribuição original (Sanderson et al. 2002, Zeller 2007). No Brasil, as populações mais expressivas estão localizadas no Pantanal e na Amazônia (Cavalcanti et al. 2012, Oliveira et al. 2012, Silveira & Crawshaw 2008), sendo a Mata Atlântica o bioma no qual a espécie encontra-se mais ameaçada (Beisiegel et al. 2012, Ferraz et al. 2012, Sanderson et al. 2002).
![Figura 1: Localização da Reserva Natural Vale (RNV) no estado do Espírito Santo e no bioma Mata Atlântica (área pontilhada) [quadro superior em detalhe]](https://thumb-eu.123doks.com/thumbv2/123dok_br/14996043.11835/64.892.138.740.407.931/figura-localizacao-reserva-natural-espirito-atlantica-pontilhada-superior.webp)