Russian Journal of Agricultural and Socio-Economic Sciences, No. 10 (10) / 2012
10
THE EFFECTS OF CLIMATIC VARIABLES AND CROP AREA ON MAIZE YIELD AND VARIABILITY IN GHANA
Henry De-Graft Acquah, Clement Kweku Kyei, Researchers
Department of Agricultural Economics and Extension University of Cape Coast, Cape Coast, Ghana
Phone: +00233245543956, E-mail: henrydegraftacquah@yahoo.com
Received September 13, 2012
ABSTRACT
Climate change tends to have negative effects on crop yield through its influence on crop production. Understanding the relationship between climatic variables and crop area on the mean and variance of crop yield will facilitate development of appropriate policies to cope with climate change. This paper examines the effects of climatic variables and crop area on the mean and variance of maize yield in Ghana. The Just and Pope stochastic production function using the Cobb-Douglas functional form was employed. The results show that average maize yield is positively related to crop area and nega-tively related to rainfall and temperature. Furthermore, increase in crop area and temperature will enlarge maize yield variability while rainfall increase will decrease the variability in maize yield.
KEY WORDS
Climatic variables; Mean yield; Yield variability; Production function; Fixed effect model; Panel data.
Agriculture plays a significant role in the economies of most countries in Sub-Saharan Africa. In Ghana, agriculture employs about 60% of the population and contributes to about 30% of the Gross Domestic Product (GDP) (Ministry of Food and Agriculture [MoFA], 2011). However, the agricultural sector is highly vulnerable to the negative impacts of climate change and climate variability as 97% of agricultural land in Sub-Saharan Africa is rainfed (Rockström et al., 2004). Generally, temperature increase will re-duce yields and quality of food-crops thereby worsening vulnerability in food supply. Similar-ly, changes in precipitation patterns i.e., intensive rain concentrated in a particular month has a de-vastating effect on crop production (Abrol & In-gram, 1996).
Several studies have investigated the impact of climate change on crop yield using either si-mulation models (Rosenzweig & Parry, 1994; Rosenzweig et al., 2001; Aggarwal & Mall, 2002) or regression models (Lobell & Field, 2007; You et al., 2009; Joshi et al., 2011). The focuses of these studies have been to estimate the impact of climate change on only mean crop yield. Mearns et al. (1997) asserts that by neg-lecting the impact of climate change on crop yield variability and focusing on mean crop yield,
these studies provides limited information. This is particularly important in Sub-Saharan Africa where growing evidence show that variability in crop yield is as a result of weather variability. However, Anderson and Hazell argue that al-though yield variability mostly depend on weath-er, sometimes it can be worsened by the adoption of high-yielding varieties and uniform agronomic practices. Although recent studies (Chen et al., 2004; Isik & Devadoss, 2006) have considered the impact of climate change on the mean and variance of crop yield, in Ghana there is no known study available.
H. DE-GRAFT ACQUAH, C.K. KYEI, University of Cape Coast
11 MATERIALS AND METHODS
Desk research was used to obtain secondary data from the Statistical, Research and Information Directorate (SRID) of the Ministry of Food and Agriculture (MoFA) and the Metrological Servic-es Department of Ghana. The use of secondary data is essential to adequately capture past weather patterns and their effect on maize production in the study area. This study considered the five major maize growing regions in Ghana using data from 1992 to 2010. The choice of the starting date is because of data availability. Observed average regional maize yields and the corresponding culti-vated areas are used for the study. Additionally, observed average regional growing season rainfall and temperature values are used.
To investigate the impact of climate change on average crop yield and crop yield variability, most studies (Chen et al., 2004; Isik & Devadoss, 2006) employ the stochastic production function developed by Just and Pope (1978). The intuition behind the stochastic production function is that a production function can be specified as a sum of two components: one associated with the output level and the other linked to variability of output.
Generally, the Just and Pope production function is specified as:
Y = f (X, ) + h(X, )0.5ɛ
E(ɛ) = 0, var (ɛ) = 1 (1)
where Y is output, X is a vector of explanatory variables. and are unknown parameters to be estimated. ɛ is a stochastic disturbance. f (.) is the mean function that relates X to average output and h (.) is the variance function that relates X to the standard deviation of output. Equation (1) allows the explanatory variables to affect both the average and the variance of maize yield. Follow-ing Isik and Devadoss (2006), equation (1) de-composes as:
Yit = f (Xit, ) + it (2)
it = ɛit + h(Xit, )0.5
where Yit is maize yield for the ith region at year t, Xit is the vector of explanatory variables (rain-fall, temperature and crop area) considered for the ith region at year t, ɛit is an error term with mean zero and variance equals to 1 to ensure positive output variance (Isik & Devadoss, 2006).
The stochastic production function given by equation (2) has traditionally been estimated us-ing either maximum likelihood estimation (MLE) or a three-stage estimation procedure involving feasible generalized least squares (FGLS) follow-ing Just and Pope (1978, 1979). Most empirical studies have used the FGLS approach but MLE is more efficient and unbiased than FLGS estima-tion in the case of small samples (Saha et al. 1997). Given the size of our sample, we wish to use the three stage estimation procedure.
From equation (2), the first stage of the pro-cedure regresses Yit on f (Xit, ) using ordinary least squares. Secondly, the log of the squared residuals, û2it from the first stage are used to ob-tain the estimates of the marginal effects of ex-planatory variables on the variance of maize yield ( ). The third and final stage uses the antilog of the predicted value of the residuals obtained from the second stage as weights to estimate in the first argument in equation (2) through weighted least squares estimation. According to Just and Pope (1978) the resulting estimator of in the final stage is consistent and asymptotically effi-cient under a broad range of conditions and the whole procedure corrects for the heteroscedastic disturbance term.
Russian Journal of Agricultural and Socio-Economic Sciences, No. 10 (10) / 2012
12 RESULTS AND DISCUSSION
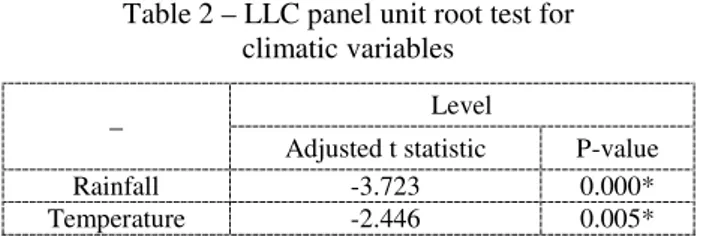
LLC panel unit root test was conducted to examine the time series properties of the va-riables of study. The null hypothesis of a unit root is rejected for the climatic variables in Table 1 and the first-differenced agronomic va-riables (maize yield and crop area) in Table 2. The detailed results of the unit root tests for the agronomic variables and climatic variables are displayed in Table 1 and Table 2 respectively.
Table 1 – LLC panel unit root test for agronomic variables
–
Level First difference Adjusted
t statistic P-value
Adjusted
t statistic P-value Yield 1.220 0.888 -2.833 0.002* Crop area -0.377 0.353 -3.994 0.000*
* indicates that the test statistics are significant at 5% level
Table 2 – LLC panel unit root test for climatic variables
– Level
Adjusted t statistic P-value Rainfall -3.723 0.000* Temperature -2.446 0.005*
* indicates that the test statistics are significant at 5% level
Table 3 displays the regression coefficients for mean maize yield from stage three of the Just and Pope stochastic production function estima-tion procedure. The R2 value is 0.70 and the test result of F-statistic shows the function to be well-behaved. The results show that a 1% increase in crop area will significantly increase mean maize yield by 0.92%. Rainfall and temperature has a negative effect on mean maize yield though in-significant.
Table 3 – Mean yield results
Response variable: Log (Yield) – – Variable Coefficient P-value Intercept 2.089 (1.073) 0.055 Log (crop area) 0.920 (0.068) 0.000* Log (Temperature) -0.612 (0.321) 0.060 Log (Rainfall) -0.016 (0.032) 0.619
R2 0.70 – F statistic 65.42 0.000*
Notes: standard errors in parentheses; * denotes significance at 5% level. Number of observation: 90.
The elasticity for rainfall is computed as -0.016 and thus a 1% increase in rainfall will de-crease mean maize yield by 0.02%. Also, a 1% increase in temperature will likewise decrease mean maize yield by 0.6%. These results are sim-ilar to the findings of Boubacar (2010). The au-thor found his degree-days and precipitation in-tensity variables to be negatively related to mean maize yield. However, mean maize yield had a positive relationship with cultivated area.
Table 4 display the regression coefficients for yield variance from stage two of the Just and Pope stochastic production function estimation procedure. The R2 value is 0.08 and the test result of F-statistic shows the function to be well-behaved. The results show that both crop area and temperature enlarge the yield variability. A 1% increase in crop area will increase yield va-riability by 1.6% while a 1% increase in tempera-ture will cause maize yield variability to increase by 0.01%. Rainfall will significantly reduce ma-ize yield variability by 0.0001% with a 1% in-crease. These results corroborate the findings by Chen et al. (2004). The authors found that higher temperatures increase corn yield variability while increasing rainfall decreases the variance of corn yield.
Table 4 – Yield variance results
Response variable:
Log (Yield Variance)2 – – Variable Coefficient P-value Intercept -10.254 (6.171) 0.100 Log (crop area) 1.627 (2.292) 0.480 Log (Temperature) 0.008 (0.009) 0.356 Log (Rainfall) -0.0001(0.00004) 0.008*
R2 0.08
F statistic 2.97 0.0365*
H. DE-GRAFT ACQUAH, C.K. KYEI, University of Cape Coast
13
REFERENCES
Abrol, Y. P., & Ingram, K. T. (1996). Effects of higher day and night temperatures on growth and yields of some crop plants. In F. Bazzaz, & W. Sombroek eds: Global climate change and agricultural production: Direct and indirect effects of changing hy-drological, pedological and plant physio-logical processes. John Wiley & Sons Ltd, West Sussex, England. 123-140.
Aggarwal, P. K. & R. K. Mall (2002). Climate Change and rice Yields in Diverse Agro-Environment of India: Effects of Uncer-tainties in Scenarios and Crop Models on Impact Assessment, Climatic Change 52: 331–43.
Boubacar, Inoussa (2010). The Effects of Drought on Crop Yields and Yield Varia-bility in Sahel. Selected Paper prepared for presentation at the Southern Agricultural Economics Association Annual Meeting, Orlando, FL, February 6-9, 2010.
Chen, C., B. A. McCarl, & D. E. Schimmelp-fennig (2004). Yield Variability as Influ-enced by Climate: A Statistical Investiga-tion, Climatic Change 66: 239–61.
Isik, M., S. Devadoss (2006). An Analysis of the Impact of Climate Change on Crop Yields and Yield Variability. Applied Eco-nomics 38: 835-44.
Joshi, N.P., Maharjan, K.L. & Piya, L. (2011). Effect of Climate Variables on Yield of Major Food-crops in Nepal. A Time-series Analysis. Journal of Contemporary India Studies: Space and Society, Hiroshima University. Vol.1: 19-26,2011.
Just, R.E & R.D. Pope (1978). Stochastic Speci-fication of Production Function and Eco-nomic Implications. Journal of Econome-trics 7(1): 67-86.
Just, R.E & R.D. Pope (1979). Production Func-tion EstimaFunc-tion and Related Risk Consid-eration. American Journal of Agricultural Economics 61(2): 276-284.
Levin, A., C.F. Lin, & C.S. J. Chu. 2002. Unit root tests in panel data: Asymptotic and fi-nite-sample properties. Journal of Econo-metrics 108: 1–24.
Lobell, D. & Field, C. (2007). Global Scale Climate-Crop Yield Relationships and the Impacts of Recent Warming. Environmen-tal Research Letter 2.
Mearns, L.O., C. Rosenzweig., R. Goldberg (1997). Mean and Variance Change in Climate Scenarios: Methods, Agricultural Application, and Measures of Uncertainty. Climatic Change, 35, 367–96.
Rockström, J., Folke, C., Gordon, L., Hatibu, N., Jewitt, G., Penning de Vries, F., Rwe-humbiza, F., Sally, H., Savenije, H. & Schulze, R. (2004). A Watershed Ap-proach to Upgrade Rainfed Agriculture in Water Scarce Regions through Water Sys-tem Innovations: An Integrated Research Initiative on Water for Food and Rural Li-velihoods in Balance with Ecosystem Functions. Physics and Chemistry of the Earth 29: 1109-1118.
Rosenzweig C, Iglesias A, Yang XB, Epstein PR, Chivian E (2001). Change and extreme weather events. Implications for food pro-duction, plant diseases, and pests. Global Change Human Health 2(1), 90–104. Rosenzweig, C. and Parry, M. L. (1994).
Poten-tial Impacts of Climate Change on World Food Supply. Nature 367: 133-138.
Saha A, Havenner A, Talpaz H (1997). Stochas-tic production function estimation: small sample properties of ML versus FGLS. Applied Economics 29: 459–469
SRID/MOFA, (2011). Agriculture Statistics 2010, Statistical Research and Information Directorate, Ministry of Food and Agricul-ture, Ghana.