INFLUENCE FACTORS FOR STORE FORMAT CHOICE
IN THE APPAREL AND FOOTWEAR MARKET
Lecturer PhD Ioana - Nicoleta Abrudan
Babeș-Bolyai University Email: ioana.abrudan@econ.ubbcluj.ro
Abstract:
The choice of retail formats has been a highly debated topic in international academic literature for a long time. In Romania, this topic has been hardly approached. This study investigates the buying habits of apparel and footwear, as well as the factors related to the purchase decision from a particular store format. Factors considered are both socio-demographic (education, occupation, net income per family member, size of discretionary income, household (family) size, number of cars owned and shopping motivation. A quantitative research has been conducted using a sample of 642 urban buyers, in the second largest city in Romania. The results indicate that factors showing correlation with the frequency of purchases vary by the retail format.
Key words: retail format, choice, apparel and footwear, shopping motivations, demographic variables
The recent history of retail shows profound transformations in its structure. Many new retail formats have emerged. Currently we are facing a variety of retail formats that are trying to meet the heterogeneous needs of consumers (Gonzalez-Benito et al, 2007, p. 45) for all product categories.
During the last 20 years, Romanian retailing has made significant steps to recover the gap that separates it from the other European countries. The transformation and upgrading of the national retailing market has been brought by the entry of the large retail groups. Competition in clothing and footwear market in Romanian urban areas is high and rising due to the growth in the number of stores belonging to various formats. This expansion has been particularly boosted by the emergence of shopping centers that offer modern facilities and which, based on precise estimations, give confidence
and help individual or chain stores to more accurately predict sales in a certain location and stimulate them to enter new geographical markets.
Because of this intense competition, it is increasingly important for clothing and footwear retailers to understand the preferences of their shoppers, the way they select store formats, the formats chosen by the same segment of buyers and to what extent shopping motivations are correlated with acquisitions. This information can direct them to extend to other target segments, other formats or geographic markets.
Customer’s preference for various retail formats
A retail format is the embodiment of a business model in retailing that uses a mix of variables such as assortment, price, convenience, shopping experience to ensure long-term business sustainability. The various retail formats are designed to meet the needs of various customer segments. Satisfying their product and shopping experience-related needs are key factors when planning the activity of each format. Satisfied shoppers will revisit the store and repeat purchases (Bloemer and Ruyter, 1998; Martenson, 2007; Helgesen, Havold and Nesset, 2010; Nesset, Norvik and Helgesen, 2011; Abrudan et al, 2015).
Certain researchers assert that customers select the format first, and then a specific store or more of the same format (Tripathi & Dave, 2013, p. 479), but when the buyers do not sense a difference among formats, preference for store brand is stronger and comes before format preference. In retail, loyalty is different from other areas; it does not mean visiting only one retailer. Loyalty is, rather, continuous, long-term shopping at a small number of stores (Abrudan, 2015). Taking advantage of the various alternatives available, buyers will try to maximize their utility by exploiting the opportunities provided by different retailers (Gijsbrechts et al, 2008, p. 5). Moreover, when various store formats have a similar offer, they become substitutable and therefore competitors (Gehrts & Yan, 2004, p. 6). Buyers prefer both large formats that offers convenience in terms of "everything under one roof", as well as smaller ones that are convenient in terms of access (distance, opening hours, time spent in the store), and also general formats along with the specialized ones (Basu et al, 2014, p. 700). Therefore, understanding the
factors that underlie the coexistence of these diverse formats represents an important research theme (Messinger and Narasimhan, 1997).
The factors that influence store format choice
Shoppers usually choose a certain retail format or a particular store according to their demographic and psychographic characteristics. Store choice and visits have received much attention from researchers. Various studies have analyzed the factors influencing the selection of a particular store or store format. Many of them are focused on the preference for grocery retail formats, but there are some studies that address the apparel market as well.
The way consumers perceive shopping, their shopping orientation and
motivation affect both the number of
stores visited (Luceri and Latusi, 2016, p. 92), and the formats chosen. The concept of orientation is closely related to motivation, often in the literature being used with the same meaning (Bellenger and Korgaonkar, 1980; Stoltman, Gentry and Anglin, 1991; Abrudan, 2012). For retail marketing it is relevant the classification of shopping motivations in:
utilitarian (oriented to meet functional or tangible needs, such as, for example, speed, convenience, low prices, variety, affordability, all in one place) and
hedonistic (satisfying emotional or
stores that offer them convenience in the first place. Those concerned with the financial aspect and smart buys will hunt for discounts and promotions and will be willing to visit several shops (Luceri and Latusi, 2016, p. 92). Utilitarian motivation, focused on the best price – quality ratio and bargains, can be found in the researches of Stone (1954); Gutman and Mills (1982); Westbrook and Black (1985); Stoltman, Gentry and Anglin (1991); Roy (1994); Arnold and Reynolds (2003); Morschett, Swoboda and Foscht (2005); Morschett, Swoboda and Schramm-Klein (2006); Ahmed, Ghingold and Dahari (2007); Patel and Sharma (2009); Abrudan (2012).
Demographic factors considered in most researches concerning retail formats choice are age, gender, income, education, occupation, family (household) size. The dominant approach is to connect buyers' preferences for various formats with demographic factors, store characteristics and customers᾿ perceptions of these factors (Luceri and Latusi, 2016, p. 89). Some of the studies that have shown the relationship between these demographic factors and shopping behavior are those of East et al (1995), Hoch et al, 1995; McGoldrick and Andre (1997), Carpenter and Moore (2006), Seock (2009), Carpenter and Balija (2010), Baltas et al (2010), Carpenter and Brosdahl (2011), Prasad and Aryasri (2011), Basu et al (2014); Luceri and Latusi (2016).
Family (household) size is a key variable in studying shopping behavior. The results obtained in the literature are mixed. It can influence consumer behavior in either direction. It can concentrate shopping in a single store to save time (McGoldrick and Andre, 1997; Carpenter and Moore, 2006), or determine multiple store patronage to satisfy consumption needs of all members and to optimize use of the
budget (Hoch et al, 1995; Baltas et al, 2010, p. 40). Other studies find, however, this variable not conclusive (Luceri and Latusi, 2016).
Income determines purchasing
opportunities and the importance of price (Baltas et al, 2010, p. 40) when deciding on the product and the store format or individual store. A higher income often means less time for shopping, and increased importance of convenience, quality, pleasant shopping experience (Baltas et al, 2010, p. 40) and a reduced tendency to hunt for bargains. It is, therefore, expected a reversed correlation between total and discretionary income and second-hand, neighborhood stores and hypermarkets shopping, and a direct correlation with city center and shopping centers stores shopping.
Age is negatively correlated with the desire to explore stores (Guo, 2001). However, older people have more leisure time to visit several shops (Luceri and Latusi, 2016). Many researchers state that older people tend to simplify shopping due to cognitive decline, physical debility, aversion to change, socio-emotional selectivity (Baltas et al, 2010, p. 41). Other studies fail to find the relationship between the number of stores and formats visited and age (Luceri and Latusi, 2012; Maruyama and Wu, 2014), or they find it just for certain store formats (Seock, 2009).
Occupation influences the length of free time and therefore shopping time as well. It can change the propensity to visit multiple formats, the size and location of those frequented. For example, when free time is limited, customers will try to allocate as little of it to shopping as possible (Baltas et al, 2010). Those who commute tend to visit, however, more stores (Maruyama and Wu, 2014; Luceri and Latusi, 2016, p. 92).
on the propensity to attend more retail formats and / stores (Carpenter and Brosdahl, 2011). Certain researchers have found that men tend to compare more retailers and not women (Kempf et al, 1997; Noble et al, 2006). Luceri and Latusi (2012, 2016) concluded that, on the contrary, women tend to do so. In other studies findings vary by store format (Carpenter and Balija, 2010) or gender is not found relevant (Basu et al, 2014).
Methodology
This study deals with the factors influencing the selection of apparel and footwear retail formats. It is part of a broader exploratory research on the shopping behavior in urban areas. For this purpose, Cluj-Napoca, the second largest city in Romania, has been selected. It is a city whose size and maturity of the commercial network makes it suitable for such a research. The respondents have been selected from permanent or temporary residents, at least 15 years old. As a sampling method, two solutions have been combined, systematic sampling based on Cluj-Napoca’s postal codes with quota sampling method, using gender and age of the respondents as variables. Data collection has been performed at respondents' homes to allow for optimum filling in of the questionnaires. The resulting sample includes 642 valid questionnaires.
The retail formats analyzed in this research are second-hand stores, neighborhood stores, downtown shops, supermarkets and hypermarkets, cash & carry stores, shopping centers stores, online retail, catalogs retail and other retail formats (e.g. markets). Frequency of purchases in stores has been measured on a six levels scale (from "never for the past three months" to "several times a week").
Although studies often show that demographic predictors᾿ efficacy is
limited, due to their importance, they must be studied (Gehrt & Yan, 2004, p. 8). Based on the literature the following variables have been included in the questionnaire: gender (nominal variable), age (discrete quantitative variable), education (nominal variable), occupation (nominal variable), net income per family member (continuous quantitative variable), the size of discretionary income (continuous quantitative variable), household size (discrete quantitative variable) and the number of cars owned (discrete quantitative variable).
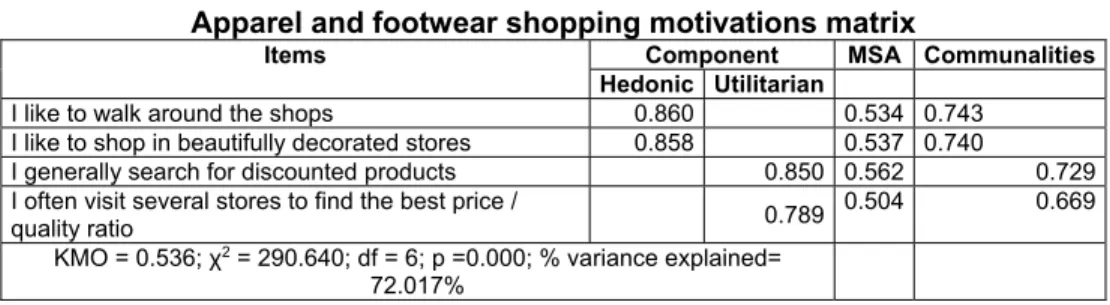
Shopping motivations, hedonistic and utilitarian, have been taken from a previous research on shopping centers (Abrudan, 2012). The variables that make up the hedonistic motivation are: "I like to walk around the shops" and "I like to shop in beautifully decorated stores". Utilitarian motivation is defined by the variables "I generally search for discounted products" and "I often visit several stores to find the best price / quality ratio". On the four variables the principal component analysis has been performed, resulting in the same two components previously found, which demonstrates the stability of the model.
Data analysis
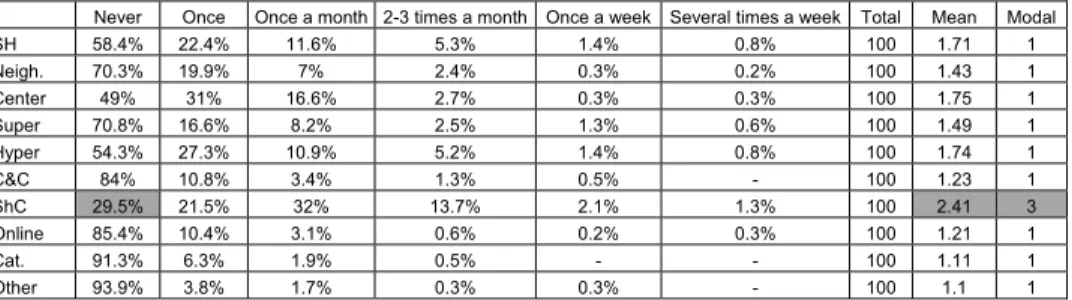
Table 1 Apparel and footwear purchase frequency by retail formats within a three
months period
Never Once Once a month 2-3 times a month Once a week Several times a week Total Mean Modal
SH 58.4% 22.4% 11.6% 5.3% 1.4% 0.8% 100 1.71 1
Neigh. 70.3% 19.9% 7% 2.4% 0.3% 0.2% 100 1.43 1
Center 49% 31% 16.6% 2.7% 0.3% 0.3% 100 1.75 1
Super 70.8% 16.6% 8.2% 2.5% 1.3% 0.6% 100 1.49 1
Hyper 54.3% 27.3% 10.9% 5.2% 1.4% 0.8% 100 1.74 1
C&C 84% 10.8% 3.4% 1.3% 0.5% - 100 1.23 1
ShC 29.5% 21.5% 32% 13.7% 2.1% 1.3% 100 2.41 3
Online 85.4% 10.4% 3.1% 0.6% 0.2% 0.3% 100 1.21 1
Cat. 91.3% 6.3% 1.9% 0.5% - - 100 1.11 1
Other 93.9% 3.8% 1.7% 0.3% 0.3% - 100 1.1 1
Notes: SH= second-hand stores; Neigh. = neighborhood stores; Center = city center stores; Super = supermarkets; Hyper = hipermarkets; C&C = Cash & Carry stores; ShC = shopping centers; Online = online stores; Cat. = catalog retailing; Other = other retail formats (e.g. markets)
Analyzing the table that includes the relative frequencies of purchases, it may be noted that apparel and footwear are most frequently bought in shopping centers (modal 3 - "once a month" and mean 2.41 ("once during the last three months"). The percentage of those who have not bought anything in shopping centers during the previous three months is the lowest (29.5%), as well. City center stores and hypermarkets (average 1.75 and 1.74) are the next favorite formats, followed by second-hand stores. The data confirms the modernization trend of Romanian retailing, which matches the desire for new and modern of local buyers. In Cluj-Napoca it can be observed a rapid expansion and coverage of the entire city by the format of stores that sell used products. They are found in highest concentration in the city center. The reason is the migration to shopping centers of the stores traditionally located downtown and availability of lower rents for these spaces, but also increasing demand for cheap and fair quality products. Analyzing the relative frequencies, clothing and footwear products are bought at least once a month in shopping centers by almost half of respondents (49.1%). As the percentage of those who did not make purchases in other retail formats besides those analyzed, or just once during the three months period is very high (93.9% and 3.8%), this format will not be considered further on.
Table 2 Correlations between shopping frequency and demographic variables by
retail formats
Varb. Education Occupation Inet/m Idisp/m Gender Age Members Auto Indic. r Sig. φc Sig. r Sig. r Sig. φc Sig. r Sig. r Sig. r Sig.
Studying the relations between demographic variables (education, occupation, net income per family member and discretionary income, along with gender, age, number of members in the household and number of cars owned), low correlations with clothing and footwear shopping frequency in various formats there can be identified. This confirms the general orientation of all retail formats. In an attempt to be profitable, each of them is trying to address a wide spectrum of potential buyers. No market segmentation can be noticed for any of the formats. The only notable exception is the inverse correlation (r = - 0.529), of medium intensity, between respondents' age and the purchase of clothing and footwear in stores within shopping centers. For all the formats, a correlation between purchases and education and / or current occupation can be noted. The same goes for age, except for the supermarkets format. But supermarkets have, however, an
extremely limited assortment of clothing, and this can cause the lack of visible correlation. For all formats, except second-hand stores (direct correlation, r = 0.091), the correlation is reversed.
Correlation analysis identifies some possible segmentation variables for each retail format. For second-hand and neighborhood stores: occupation, net income, gender and age. For city center shops: education, discretionary income, gender and age. For hypermarkets: education, occupation, discretionary income, age and family size. For shopping centers purchases, correlations exist with all variables considered, except for gender. Online purchases are correlated with: education, net and discretionary income per family member, age and number of cars owned. The conclusions are in line with existing literature, which presents variations among formats in terms of demographic variables influence (Carpenter and Balija, 2010).
Table 3 Apparel and footwear shopping motivations matrix
Items Component MSA Communalities Hedonic Utilitarian
I like to walk around the shops 0.860 0.534 0.743
I like to shop in beautifully decorated stores 0.858 0.537 0.740
I generally search for discounted products 0.850 0.562 0.729
I often visit several stores to find the best price /
quality ratio 0.789
0.504 0.669
KMO = 0.536; χ2 = 290.640; df = 6; p =0.000; % variance explained=
72.017%
Notes: Extraction method: Principal component analysis; Rotation method: Varimax with Kaiser Normalization; MSA = Measure of sampling adequacy
A factor analysis is adequate if the variables show significant correlations. To verify this hypothesis, in addition to correlation coefficients, Kaiser-Meyer-Olkin test and Bartlett test for sphericity are being used. Bartlett test indicates the degree of correlation between at least some of the variables included in the analysis. Since p = 0.000 and χ2 =
threshold as stipulated in the literature (Janssens, Wijnen, Pelsmacker and Kenhove, 2008; Hair, Black, Babin and Anderson, 2010, p. 104). Communalities show which part of the variance of each variable isexplained by the four factors that have emerged from the principal component analysis. Because all values are greater than 0.5, it means that all four variables are well explained by the two factors emerging from the analysis.
In order to test model’s reliability, Cronbach's alpha coefficient and
item-to-total correlation are utilized. The results are listed in the following table (no. 4). Cronbach α values are lower than 0.7, while item-to-total correlations for the utilitarian component are below 0.5. Thus, the measurement scales for the second component do not exhibit a high confidence, that is, in case of repeating measurement, results may be different.
Table 4 Cronbach alpha coefficients for motivations' dimensions
Components Items Adjusted
item-to-total correlation Cronbach α coefficients
Hedonic I like to shop in beautifully decorated stores 0.501
0.665
I like to walk around the shops 0.501
Utilitarian I generally search for discounted products 0.335
0.501 I often visit several stores to find the best price /
quality ratio 0.335
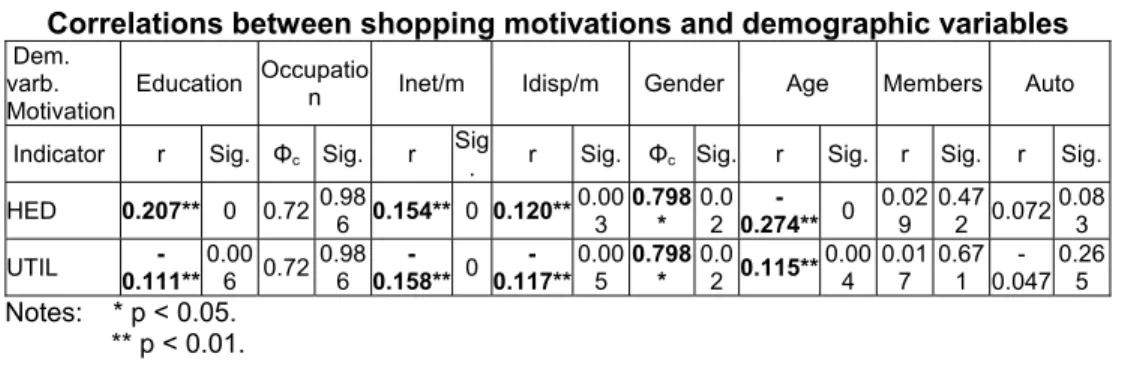
Hedonistic orientation, towards shopping as a means of relaxation, is directly, but weakly correlated with education (r = 0.207), net income (r = 0.154) and discretionary income (r = 0.12) and to a small extent (r = 0.072 and sig. = 0.083) with the number of cars owned, and inversely correlated
with age (r = -0.274). The concern about prices (utilitarian motivation) is inversely correlated to the hedonistic one, but still to a little extent. Both motivations are strongly correlated with gender of the respondents (see table no.5).
Table 5 Correlations between shopping motivations and demographic variables
Dem. varb. Motivation
Education Occupatio
n Inet/m Idisp/m Gender Age Members Auto
Indicator r Sig. Φc Sig. r
Sig
. r Sig. Φc Sig. r Sig. r Sig. r Sig.
HED 0.207** 0 0.720.98
6 0.154** 0 0.120** 0.00 3 0.798 * 0.0 2 -0.274** 0 0.02 9 0.47
2 0.072
0.08 3
UTIL
-0.111** 0.00
6 0.72
0.98 6 -0.158** 0 -0.117** 0.00 5 0.798 * 0.0 2 0.115**
0.00 4 0.01 7 0.67 1 -0.047 0.26 5
Notes: * p < 0.05. ** p < 0.01.
In the following table there may be noticed direct, but low, correlations between hedonistic motivation and clothing and shoes shopping from downtown shops, shopping centers and
"virtually". Those visiting second-hand, cash & carry and online stores are mainly motivated by the pecuniary aspect of shopping, finding the best available price. This is evident as each of these types of stores is known for the advantage provided in terms of price. Thus, second-hand stores have the lowest price on the market, online stores offer prices comparatively lower than the physical stores for exactly the same products and cash & carry ones have a lower price per unit when high volumes are purchased. Neighborhood stores and shopping centers seem to be
considered suitable for both hedonist and utilitarian shoppers. It is obvious why hedonists prefer these stores, as visiting these stores implies walking and, in addition, shopping centers are known for their pleasant ambience, being the most modern shopping destinations today in Romania. Shopping centers᾿ stores are also found suitable for bargain hunting, shops offering, in turn, reduced prices for various items, to be "hunted", while clearance and liquidation sales are promoted extensively.
Table 6 Correlations between shopping motivations and store formats
Motivation Indic. SH Neigh. Center Super Hyper C&C ShC Online Cat. Other Hedonistic
r -0.048 -0.085* 0.192** -0.018 0.056 0.043 0.208** -0.002 0.119**
-0.042
Sig. 0.235 0.036 0.000 0.662 0.166 0.291 0.000 0.957 0.003 0.479
Utilitarian r 0.223** 0.134** -0.042 -0.003 -0.028 -0.092* 0.104** 0.089* -0.054 0.047
Sig. 0.000 0.001 0.302 0.945 0.483 0.024 0.000 0.027 0.179 0.427
Notes: * p < 0.05; ** p < 0.01.
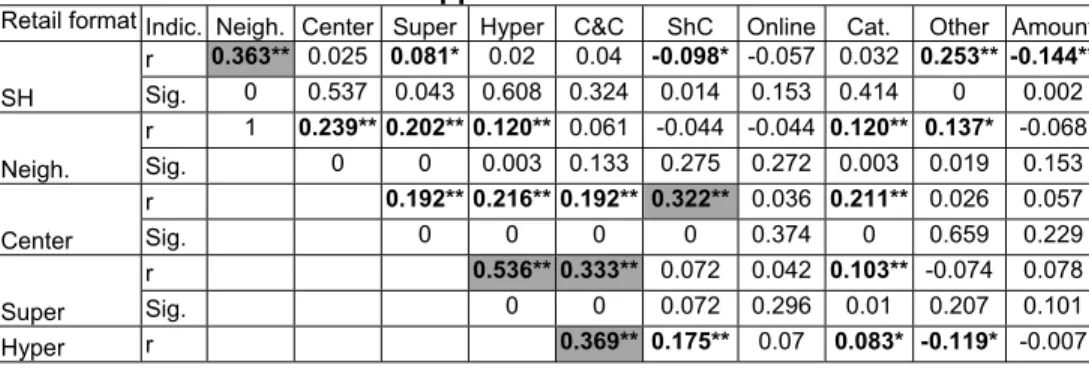
Looking at the results in the following table (no. 7) some interesting aspects can be inferred. There are no notable correlations between spending for apparel and footwear except for shopping centers, but even in their case the intensity is rather low (r = 0.283). Regarding retail formats, second-hand stores shopping is medium correlated with that in neighborhood stores (r =
0.363). Those who buy clothing and footwear from supermarkets seem to prefer (r = 0.536) hypermarkets and cash & carry stores (r = 0.333) as well. Meanwhile, shopping centers customers tend to attend and make purchases in downtown shops, too. It can also be noted a medium correlation (r = 0.323) between buyers who prefer catalog shopping and online stores.
Table no. 7. Correlations between retail formats and with the amount spent for apparel and footwear
Retail format Indic. Neigh. Center Super Hyper C&C ShC Online Cat. Other Amount
SH
r 0.363** 0.025 0.081* 0.02 0.04 -0.098* -0.057 0.032 0.253** -0.144**
Sig. 0 0.537 0.043 0.608 0.324 0.014 0.153 0.414 0 0.002
Neigh.
r 1 0.239** 0.202** 0.120** 0.061 -0.044 -0.044 0.120** 0.137* -0.068
Sig. 0 0 0.003 0.133 0.275 0.272 0.003 0.019 0.153
Center
r 0.192** 0.216** 0.192** 0.322** 0.036 0.211** 0.026 0.057
Sig. 0 0 0 0 0.374 0 0.659 0.229
Super
r 0.536** 0.333** 0.072 0.042 0.103** -0.074 0.078
Sig. 0 0 0.072 0.296 0.01 0.207 0.101
Sig. 0 0 0.079 0.037 0.042 0.882
C&C
r 0.108** 0.156** 0.201** -0.074 -0.005
Sig. 0.008 0 0 0.215 0.925
ShC r 0.259** 0.232** -0.042 0.283**
Sig. 0 0 0.472 0
Online r 0.323** 0.008 0.138**
Sig. 0 0.887 0.004
Cat. r 0.097 0.064
Sig. 0.097 0.175
Other r 0.011
Sig. 0.869
Notes: * p < 0.05; ** p < 0.01
Conclusions
The research shows that apparel and footwear is most frequently purchased in shopping centers, and by the largest percentage of buyers. No market segmentation can be noticed for any of the formats. The only notable exception is the inverse, moderate, correlation, between respondents' age and the purchase of clothing and footwear from shopping centers᾿ stores. For all formats there can be observed a correlation between purchases and education and / or occupation. The same goes for age, which is correlated with all formats except for supermarkets (which do not play a significant role in the clothing and footwear market). For all formats, except for second-hand stores (direct correlation) there are inverse correlations with age.
Hedonistic orientation towards shopping as a means of relaxation is direct, but weakly correlated to education, net income, discretionary income and very little connected with the number of cars owned, and inversely correlated with age. This means that people with higher income (maybe generated by higher education) show hedonistic orientation towards shopping. This trend is more predominant to students and recent college graduates, but fades as they age and their spare time probably decreases. Preoccupation
with prices (utilitarian motivation) is inversely correlated as the hedonistic one, but still to a little extent. Both motivations are correlated with the gender of the respondents.Significant and direct, but low, correlations have been found between hedonistic shopping motivation and the purchase of clothing and shoes from downtown shops, shopping centers and catalogs. It may be inferred therefore that those who attend such stores regard shopping as a relaxing and enjoyable activity, which is, at the same time, an opportunity to stroll, even "virtually". Those visiting second-hand, cash & carry and online shops are primarily motivated by the pecuniary aspect of shopping.
The main limitation of the research is that the sampling method is not entirely probabilistic, although the sample population follows the structure of Cluj-Napoca᾿ population. Future research directions include expanding the research to groceries and to a wider
geographic area, adding distance as a new variable and in-depth study of shopping motivations.
REFERENCES
Abrudan, I.N. (2012) “A Study Regarding Shopping Motivations of Cluj-Napoca Shopping Centers Customers”, in Tourism Management, Editors: Achim, M. I., Dragolea, L & Grabara, J. K., Polish Association of Information Society, Czestochowa.
Abrudan, I.N., Plăiaș, I. and Dabija, D.C. (2015) “The Relationship among Image, Satisfaction and Loyalty – Innovative Factor of Competitiveness for Shopping Centers”, Amfiteatru Economic, 17(39), 536-553.
Ahmed, Z.U, Ghingold, M. and Dahari, Z. (2007) “Malaysian shopping mall behavior: an exploratory study”, Asia Pacific Journal of Marketing and Logistics, 19(4) , 331-348.
Arnold, M.J., and Reynolds, K. (2003) “Hedonic Shopping Motivations”, Journal of Retailing, 79, 77-95.
Baltas, G., Argouslidis, P.C. and Skarmeas, D. (2010) “The role of customer factors in multiple store patronage: a cost-benefit approach”, Journal of Retailing, 86(1), 37-50.
Basu, R., Guin, K.K. and Sengupta, K. (2014) “Do apparel store formats matter to Indian shoppers?”, International Journal of Retail & Distribution Management, 42(8), 698-716.
Bellenger, D. N. and Korgaonkar, P. (1980) “Profiling the Recreational Shopper”,
Journal of Retailing, 56(3), 77-92.
Bloemer, J. and de Ruyter, K. (1997) “On the relationship between store image, store satisfaction and store loyalty” European Journal of Marketing, 32(5/6), 499-513. Carpenter, J.M. and Balija, V. (2010) "Retail format choice in the US consumer
electronics market", International Journal of Retail & Distribution Management, 38(4), 258 – 274.
Carpenter, J.M. and Brosdahl, D.J.C. (2011) “Exploring retail format choice among US males”, International Journal of Retail and Distribution Management, 39(12), 886-898.
Carpenter, J.M. and Moore, M. (2006) "Consumer demographics, store attributes, and retail format choice in the US grocery market", International Journal of Retail & Distribution Management, 34(6), 434 – 452.
East, R., Harris, P., Wilson, G. and Hammond, K. (1995) “Correlates of First-brand Loyalty”. Journal of Marketing Management, 11, 487-497.
Gijsbrechts, E., Campo, K. and Nisol, P. (2008) “Beyond promotion-based store switching: antecedents and patterns of systematic multiple-store shopping”,
International Journal of Research in Marketing, 25(1), 5-21.
Gonzalez-Benito, O., Bustos-Reyes, C.A. and Munoz-Gallego, P.A. (2007) ”Isolating the geodemographic characterisation of retail format choice from the effects of
spatial convenience”, Marketing Letters, 18(1), 45-59.
Guo, C. (2001) “A Review on Consumer External Search: Amount and Determinants,” Journal of Business and Psychology, 15 (3), 505–519.
Gutman, J., and Mills, M. (1982) “Fashion Life Style, Self-Concept, Shopping Orientation, and store Patronage: An Integrative Analysis”, Journal of Retailing,
58(2), 64-86.
Hair, J. F., Black, W. C., Babin, B. J. and Anderson, R. E. (2010) Multivariate Data Analysis (7th Ed.). Upper Saddle River: Prentice Hall Inc.
Helgesen, O., Havold, J. and Nesset, E. (2010) “Impacts of store and chain images on the ‘‘quality–satisfaction–loyalty process’’ in petrol retailing”, Journal of
Retailing and Consumer Services, 17(2), 109-118.
Hoch, S.J., Kim, B., Montgomery, A.L. and Rossi, P.E. (1995) “Determinants of store-level price elasticity”, Journal of Marketing Research, 32(1), 17-29.
Janssens, W., Wijnen, K., Pelsmacker, P. and Kenhove, P. (2008) Marketing
Research with SPSS. Harlow, Essex, UK: Pearson Education Ltd.
Kempf, D.S., Palan, K.M. and Laczniak, R.N. (1997) “Gender differences in information processing confidence in an advertising context: a preliminary study”, Advances in Consumer Research, 24(1), 443-449.
Khare, A., (2011) “Influence of hedonic and utilitarian values in determining attitude towards shopping malls: A case of Indian small city consumers”, Journal of Retail and Leisure Property, 9(5), 429-442.
Luceri, B. and Latusi, S. (2016) "The cross-shopping behaviour: patterns of store format mobility in the apparel sector", International Journal of Retail &
Distribution Management, 44(1), 89 – 104.
Luceri, B. and Latusi, S. (2012) “The importance of consumer characteristics and market structure variables in driving multiple store patronage”, Journal of Retailing and Consumer Services, 19(5), 519-525.
Martenson, R. (2007) “Corporate brand image, satisfaction and store loyalty. A study of the store as a brand, store brands and manufacturer brands”, International Journal of Retail & Distribution Management, 35(7), 544-555.
Maruyama, M. and Wu, L. (2014) "The relevance of retailer country-of-origin to consumer store choice: evidence from China", International Marketing Review, 31(5), 462 – 476.
McGoldrick, P. and Andre, E. (1997) “Consumer misbehaviour: promiscuity or loyalty in grocery shopping”, Journal of Retailing and Consumers, 4(2), 73-81.
Messinger, P.R. and C. Narasimhan (1997), “A model of Retail Formats Based on Consumers’ Economizing on Shopping Time”, Marketing Science, 16(1), 1–23. Morschett, D., Swoboda, B., and Foscht, T. (2005) “Perception of Store Attributes and Overall Attitude towards Grocery Retailers: The Role of Shopping Motives”
International Review of Retail, Distribution and Consumer Research, 15(4),
Morschett, D., Swoboda, B. and Schramm-Klein, H. (2006) “Shopping Orientations as Determinants of Attitude Towards Food Retailers and Perception of Store Attributes”, European Advances in Consumer Research, 7, 160-167.
Erik Nesset, E., Nervik, B. and Helgesen, O. (2011) “Satisfaction and image as mediators of store loyalty drivers in grocery retailing”, The International Review
of Retail, Distribution and Consumer Research, 21(3), 267-292.
Noble, M., Griffith, D.A. and Adjei, M.T. (2006) “Drivers of local merchant loyalty: understanding the influence of gender and shopping motives”, Journal of Retailing, 82(3), 177-188.
Pan, Y. and Zinkhan, G.M. (2006) “Determinants of Retail Patronage: A Meta-Analytical Perspective,” Journal of Retailing, 82 (3), 229–43.
Patel, V. and Sharma, M. (2009) “Consumers' Motivations to shop in Shopping Malls: A Study of Indian Shoppers”, Advances in Consumer Research, 8, 285-290. Prasad, C.J. and Aryasri, A.R. (2011) "Effect of shopper attributes on retail format
choice behaviour for food and grocery retailing in India", International Journal of Retail & Distribution Management, 39(1), 68 – 86.
Roy, A. (1994) “Correlates of Mall Visit Frequency”, Journal of Retailing, 70(2), 139-161.
Seock, Y.K. (2009) “Influence of retail store environmental cues on consumer patronage behavior across different retail store formats: an empirical analysis of US Hispanic consumers”, Journal of Retailing and Consumer Services, 16(5), 329-339.
Stoltman, J. J., Gentry, J. and Anglin, K. (1991) “Shopping Choices: The Case of Mall Choice”, Advances in Consumer Research, 18, 434-440.
Stone, G. P. (1954) “City Shoppers and Urban Identification: Observations on the Social Psychology of City Life” American Journal of Sociology, 60, 36-45. Tauber, E. M. (1972) “Why Do People Shop?”, Journal of Marketing, 36 (44), 6-49. Tripathi, G. and Dave, K. (2013) “Store format choice and relationship quality in
apparel retail: A study of young and early-middle aged shoppers in New Delhi region”, Journal of Retailing and Consumer Services, 20, 479-487.
Westbrook, R.A. and Black, W.C. (1985), “A Motivation-Based Shopper Typology”,