16
Scientific Bulletin of the „Petru Maior” University of Tîrgu Mureş Vol. 13 (XXX) no. 2, 2016
ISSN-L 1841-9267 (Print), ISSN 2285-438X (Online), ISSN 2286-3184 (CD-ROM)
EVALUATING THE USER ACCEPTANCELEVEL OF A
NOVEL TREE-BASED APPROACH ON MODELLING
MEDICAL RESEARCH DATA
Péter OLÁH
1, Marius MUJI
2, Nicoleta SUCIU
3, Marius Mărușteri
4, Călin AVRAM
51,3,4,5
University of Medicine and Pharmacy ofTîrgu-Mures Gheorghe Marinescu Street, no. 38, 540142 TîrguMureş, Romania
1
3
4
5
2“PetruMaior” University of TîrguMureş
NicolaeIorga Street, no. 1, 540088 TîrguMureş, Romania
2
Abstract
Modern medical research needs specialized Information Systems that can store and process large amounts of complex scientific data, while providing the medical researcher with a high degree of flexibility regarding the design of the data structure. In our previous work we have proposed an architecture for such a system based on trees and multitrees, stored in a relational database. In this paper we present the tools that we have used to assess the user acceptance level of this system along with the results of this evaluation. Our findings have validated the benefits of the proposed system and helped us identify some relevant aspects that need further improvement.
Keywords:healthcare information systems, medical databases, design pattern, data interrogation, user interface
1. Introduction
Modern medical research yields an ever growing need to store and process large amounts of complex scientific data. The main challenge faced by Information Systems designers in satisfying this need is to provide the medical researcher with a high degree of flexibility regarding the design of the data structure, as well as with the benefits of a soundly structured database. In our previous work we have proposed a novel approach on modelling medical research data based on trees and multitrees, stored in a relational database [1].
Once we have developed a working prototype of the proposed system we have applied this technology in two different fields of medical research: clinical research, involving human patients, and experimental research, conducted in a laboratory. We have found that the researchers from these two areas have significantly different ways to structure their data. Clinicians are gathering most of their data from the patients’ Electronic Medical Record (EMR) and often need to extend the structure of these records, in order
to collect some additional data. Experimental researchers, on the other hand, usually record their data in a notebook, focusing on the specific protocol of each experiment. A number of software applications are readily available on the market for this purpose, generally referred to as Electronic Laboratory Notebooks (ELN) [2].
Our hypothesis is that the technology proposed by us offers a sufficient degree of flexibility to the medical researcher in structuring the data, so that the same application can act both as an EMR, suited for clinical research, and as an ELN to support scientists working in the laboratory.
In order to test this hypothesis we have designed an assessment tool to evaluate the user acceptance level for this technology within the medical research community. In this paper we present the results of the evaluations conducted on groups of both clinical and experimental medical researchers.
2. Materials and Methods
17 the user acceptance level assessment tool, a pre-implementation and a post-pre-implementation one. Two sample groups of researchers were included in the study [3], representing a total number of 40 respondents. The first group, called CLIN, included 23 researchers mainly focusing on clinical research involving patients in a hospital. The second group, called EXP, included 17 medical researchers whose main focus was to perform experiments in a laboratory. The subjects of this study were selected from the teaching staff and PhD students of the University of Medicine and Pharmacy of Tîrgu Mureș and from the PhD students and post-doctoral fellows working at the Bioengineering and Tissue Regeneration Laboratory of Clemson University, SC, USA. Both male and female subjects, aged between 28 and 59 years, were included in the study.
The pre-implementation questionnaire was applied to both groups before having any knowledge about the design or functionality of the proposed Information System. After this, a detailed presentation of the system was conducted, using real-life examples, followed by the administration of the post-implementation questionnaire. The presented examples were gathered from two successful pilot implementations of the system.
The items of the questionnaires represent statements. The researchers were asked to express their agreement or disagreement with these statements using a five step ordinal response scale [4]:
1 – total disagreement 2 – disagreement 3 – neutral (more or less) 4 – agreement
5 – total agreement
A score between 1 and 5 was assigned to each response. Most of the items represented positive statements which were scored with 1 for “total disagreement” and 5 for “total agreement”. However there was a small number of items which were negatively formulated in relation with the investigated issue, thus having adjusted scores [5]: 5 for “total disagreement” and 1 for “total agreement”. This represents a necessary correction in order to evaluate a specific issue with several questions using a unified scoring method [6].
For both questionnaires we have used an exclusion criteria based on pairs of items that measure the same relevant aspect but have antagonistic formulations. According to this criteria, we have excluded from the study all subjects who scored a difference greater or equal to 2 points (out of a maximum of 4 points) on any such pair of items. Such a difference in scores could be obtained by expressing one of the following combinations of opinions regarding the same issue:
- “total agreement” and “neutral” - “agreement” and “disagreement” - “neutral” and “total disagreement”
The items were grouped in scales [7], each scale being designed to use successive items [8] in order to investigate a specific issue or aspect of relevance. The items of different scales were intertwined in order not to suggest their grouping to the respondents. The score of a scale was calculated as the sum of the scores of all its comprising items.
Designing the pre-implementation questionnaire In order to evaluate the initial user acceptance level [9] of a new data recording and storing system we have designed a six item questionnaire [10]. The items were designed to target two main issues.
The first issue to be investigated was the preference of the respondents to record soundly structured vs. weakly structured data in the research process. We have named the corresponding scale SD (Structuring Data). The scale included three items. The threshold of this scale was set to 10 points, out of a maximum of 15 points. Thus, a score lower than 10 was considered to indicate a preference for weakly structured data, whereas a score higher than 10 was considered to indicate a preference for highly structured data in the research process.
The second issue addressed by this questionnaire was the level of acceptance of the researchers regarding the use of a new software tool, to record and store scientific data related to the studies or experiments they were conducting. A three item scale named ACC (Acceptance) was built, with a threshold of 10 points, out of a maximum of 15 points. Thus a score below 10 would suggest a low level of acceptance whereas a score higher than 10 would indicate a high level of acceptance regarding a new software.
Designing the post-implementation questionnaire After having presented in detail the proposed technology to the two groups of researchers, we aimed to assess the perceived level of functional utility and the new acceptance level regarding the system. In order to achieve this goal we have designed a ten item questionnaire, with four distinct scales.
The new ACC (Acceptance) scale was comprised of three items. These items were in fact similar to the items included in the same scale of the pre-implementation questionnaire, having suffered minor modifications in order to properly fit in the new context.
The ease of use, or ease of operation of the system was measured by a three item scale called OP.
The FL scale comprised two items and was designed to measure the perceived flexibility of the system regarding the structuring of scientific data.
The level of utility regarding the report generating features of the system was assessed using a two item scale labeled RP.
18 table 1. A lower score than the threshold was considered to signify a negative perception, whereas a higher score signified a positive perception of the measured aspect of the system.
Table 1: Scoring thresholds for the post-implementation questionnaire
Scale Threshold
OP 10 out of a maximum of 15 points FL 6 out of a maximum of 10 points RP 6 out of a maximum of 10 points ACC 10 out of a maximum of 15 points
Both questionnaires were checked for internal consistency by using Cronbach’s alpha coefficient [11]. For each scale we interpreted a value of Cronbach’s alpha between 0,7 and 0,8 as signifying an acceptable level of internal consistency and a value above 0,8 to signify good internal consistency [12] [13].
After having gathered the responses using the two questionnaires we have processed the data by using descriptive and inferential statistics.
Processing the pre-implementationquestionnaire For the first questionnaire we have analyzed the mean and distribution of the scores for each of the two scales that were defined. We have also identified two subgroups within our sample using the SD scale: the SD+ group, represented by the researchers who scored higher or equal to 10and the SD- group with scores below 10.
In order to investigate a possible link between the two scales of the pre-implementation questionnaire we have formulated the following hypothesis [14]: “the respondents from the SD+ group have a higher acceptance level for a new software tool as the respondents from the SD- group”. To test this hypothesis we have compared the mean scores of the two groups obtained on the ACC scale using the Mann-Whitney test, with a significance level of 5% (p=0,05) [15].
Processing the post-implementationquestionnaire In order to assess the perceived level of utility regarding the proposed system, we have analyzed the mean and the distribution of the scores for the scales OP, FL and RP of the second questionnaire.
To identify possible perception differences regarding the functional aspects of the system between groups SD+ and SD- we have compared the mean scores of the two groups using the Mann-Whitney test, with a significance level of 5% (p=0,05).
We also aimed to identify any differences in the perceived levels of utility regarding the system between the clinical researchers (group CLIN) and the experimental researchers (group EXP). In order to achieve this goal we have compared the mean scores of the scales OP, FL and RP between these two
groups, using either the t-test or the Mann-Whitney test, depending on the type of frequency distribution of each compared set of scores. The significance level used in each case was 5% (p=0,05).
We have analyzed the mean and the distribution of the scores registered on the ACC scale, thus establishing a post-implementation level of acceptance as perceived by the responding researchers.
In order to establish whether there was a significant change in the level of acceptance following the presentation of the new system, we have compared the means of the ACC scales from both questionnaires, using the Wilcoxon test with a significance level of 5% (p=0,05). Furthermore we have compared the means of the ACC scale between the two questionnaires separately for the SD+ and the SD- groups, and for the CLIN and EXP groups, respectively. For these analyses we have used the Wilcoxon test with a significance level of 5% (p=0,05).
In order to test the normality of the frequency distributions of the scores we have used the Kolmogorov-Smirnov test. All means were reported with their respective standard deviations (meansd). The data was processed using MS Excel 2010, SPSS 17 andGraphPadInStat v. 3.06.
3. Results
An analysis of the responses gathered by using the pre-implementation questionnaire showed that the exclusion criteria was met for two of the respondents. Thus the final size of our sample was reduced to 38 researchers by eliminating two researchers from the CLIN group. The responses to the post-implementation questionnaire did not trigger any exclusion criteria.
The final sample of respondents included both male and female researchers. The gender distribution was 14 (37%) male vs. 24 (63%) female participants.
The internal consistency of both questionnaires was evaluated as acceptable. The Cronbach’s alpha coefficient yielded values between 0.7 and 0.9 for all scales, as shown in table 2.
Table 2: Cronbach’s alpha coefficient for the two questionnaires
Questionnaire Scale Cronbach’s alfa coefficient
Pre-implementation
SD 0,72
ACC 0,88
Post-implementation
OP 0,78
FL 0,75
RP 0,77
ACC 0,86
19 9,323,20. Using the predetermined thresholds we have identified four subgroups using these two scales, as shown in table 3.
Table 3: Subgroups according to the SD and ACC scales of the pre-implementation questionnaire
Subgroup
(pre-implementation) No. of respondents (%)
SD+ 11(29%)
SD- 27(71%)
ACC+ 17(45%)
ACC- 21(55%)
There was a significant difference between the means of the ACC scale computed for the SD+ group (12,092,95) and for the SD- group (8,182,59) (Mann-Whitney test, p=0,0012).
Results of the post-implementationquestionnaire The means and standard deviations recorded on the first three scales of the post-implementation questionnaire were 9,082,41 for the OP scale, 6,032,18 for the FL scale and 6,472,33 for the RP scale. By comparing these means to the preset threshold values we have identified six subgroups, as shown in table 4.
Table 4: Subgroups according to the OP, FL and RP scales of the post-implementation questionnaire
Subgroup
(pre-implementation) No. of respondents (%)
OP+ 15(39%)
OP- 23(61%)
FL+ 21(55%)
FL- 17(45%)
RP+ 22(58%)
RP- 16(42%)
There were no significant differences between the means of the SD+ and SD- groups on the OP scale (Mann-Whitney test, p=0,30) and on the FL scale (t-test, p=0,74). We found however a significant difference between the means of the SD+ (9,002,99) and SD- (5,442,14) groups on the RP scale (Mann-Whitney test, p<0,001).
By comparing the means of the CLIN and EXP groups on the first three scales of the post-implementation questionnaire we found no significant differences on the OP and RP scales (Mann-Whitney test, p=0,26 for both scales). There was a significant difference between the means of the CLIN (4,781,65) and EXP (7,931,38) groups on the FL scale (Mann-Whitney test, p<0,001).
The ACC scale registered a mean of 10,362,98 for the post-implementation questionnaire which is higher than the preset threshold of 10 points. According to this threshold we identified a group of 24(63%) respondents as ACC+ and another group of 14(37%) respondents as the ACC- group.
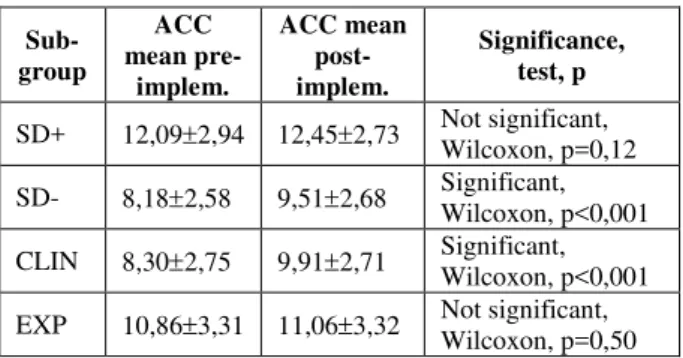
By comparing the means of the ACC scale between the two questionnaires for several subgroups we have found two significant differences, as shown in table 5.
Table 5: Comparison of the means of the ACC scale, between the two questionnaires, for different subgroups
Sub-group
ACC mean
pre-implem.
ACC mean post-implem.
Significance, test, p
SD+ 12,092,94 12,452,73 Not significant, Wilcoxon, p=0,12
SD- 8,182,58 9,512,68 Significant, Wilcoxon, p<0,001
CLIN 8,302,75 9,912,71 Significant, Wilcoxon, p<0,001
EXP 10,863,31 11,063,32 Not significant, Wilcoxon, p=0,50
There was a significant difference between the overall means of the ACC scales of the pre-implementation and the post-implementation questionnaires (Wilcoxon test, p<0,001).
4. Discussion
The pre-implementation questionnaire provided some useful insights into the general approach of the researchers concerning the structuring of the scientific data and the use of specialized software to manage such data. The scores of the SD scale show that less than a third of the respondents are concerned about structuring their data before it is recorded, the majority of the researchers being inclined to address this issue later in the research process, usually before starting the statistical processing of the data. The mean value of the ACC scale is close to the predetermined threshold for high acceptance but remains below it. The answers appeared to be polarized, the frequency of the low-acceptance answers slightly overweighing the one of the high-acceptance responses. Following a detailed item-level analysis, we have interpreted this result not as an explicit opposition but rather as a slight reluctance toward this type of Information Systems, which could be explained by the lack of detailed information about the functionality of these applications.
The SD+ group scored a significantly higher mean on the ACC scale than the SD- group, thus showing that the researchers who have a preference toward soundly structured data have a higher level of acceptance regarding specialized data management software. Although we did not investigate the level of experience of the respondents in using Information Systems, we could hypothesize that the SD+ group has more experience using spreadsheet applications or some other form of data processing software than the SD- group. This issue could be the subject of some future research on this topic.
20 the application, as well as with some useful information for the further development of our system.
The OP scale registered a mean score below our self-imposed standard for the perception of an easy to use system. By a more detailed analysis we have found thatthe Graphical User Interface (GUI) provided for the collection of the scientific data was perceived as being difficult to use. We have further investigated this issue by interviewing a number of respondents. They found that navigating the structure of the trees while inputting large amounts of data can become difficult. In order to address this problem we have proposed two potential solutions to be implemented in future versions of our system:
- developing special data recording GUIs based on tables or aggregate graphical objects, which would be automatically configured by the system according to the user-defined hierarchical structures
- implementing a set of hot-key combinations to make the navigation in the GUI easier The other two aspects assessed by the OP scale (configuring the hierarchical structures and learning to operate the system) received higher scores, thus being perceived more positively by the respondents.
The scores registered on the FL scale showed that more than half of the respondents (55%) appreciated the high degree of flexibility provided by this technology.
The RP scale showed that 58% of the responding researchers had a positive perception regarding the functionality of the reporting module of the application. A detailed analysis showed that the utility of this feature was appreciated more than the ease of its use. This represents a useful piece of information for the future enhancement of our application.
By comparing the results of the SD+ and SD- groups yielded by the post-implementation questionnaire we set out to find any differences in perception between these two types of respondents regarding the functionality of the system. The OP and FL scales presented no significant differences, so we can conclude that both groups perceived in about the same way the functional aspects of the application and appreciated the flexibility provided by the system. The mean of the SD+ group on the RP scale was however significantly higher than the one registered by the SD- group. This shows that researchers who are willing to invest some effort in designing a sound structure for their data, often at the beginning of the research process, appreciate a mechanism which allows them to interrogate the final recorded data using the same structures.The respondents of the SD+ group also found the GUI of the report generating module to be easier to use than the SD- group. This difference could be explained by the presumably higher level of expertise of the SD+ group in processing structured data using specialized
software.
Following the assumption that clinical and experimental researchers have slightly different data processing needs, we aimed to identify any differences in perception between these two groups regarding the functionality of the presented system. The OP and RP scales did not register any significant differences between the CLIN and the EXP groups. A significant difference was recorded on the FL scale, showing that researchers conducting experiments in a laboratory are more interested in flexibility regarding the data structures than clinical researchers are. This could be explained by the fact that experimental researchers often make slight changes to their protocols when repeating an experimentbased on previous results, environmental conditions or errors that may have been discovered in the research process.
The overall acceptance level of the respondents has significantly improved after the presentation of the system, evolving from low-acceptance to high-acceptance according to our preset threshold. The main factor driving this evolution proved to be the change in the perception of the SD- group, as the SD+ group did not register a significant increase on the ACC scale between the two questionnaires. According to the scores of the pre-test questionnaire, the SD+ group started with an already high level of acceptance, whereas the SD- group started with lower scores, thus leaving room for improvement. Similarly, the EXP group did not register a significant difference on the ACC scale between the two questionnaires, whereas the members of the CLIN group significantly improved their acceptance level regarding this technology.
5. Conclusions
Information systems designed to manage medical research data are aiming to provide the end-user with the ability to model complex data structures, paired with sufficient flexibility to adjust these structures as the needs of an ongoing research process demand it.
We have proposed an architecture for such a system based on trees and multitrees, stored in a relational database.Using a pre and a postimplementation questionnaire we have validated the benefits of the proposed system regarding the flexibility of the data structures and the data interrogation mechanisms. We have also identified some aspects that need further improvement: the need for a more efficient GUI to record large volumes of data and some necessary improvements in order to make the reporting module easier to be used.
21 References
[1] Olah, P., M. Marusteri, M. Muji, V. Bacarea, B. Haifa, M. Petrisor, and D. Dobru (2013), A database design pattern for structuring
hierarchical medical data,
ActaMedicaMarisiensis, vol. 58(6), pp. 429-432. [2] Olah, P., M. Măruşteri, C. Biriş, M. Opriş, and D. Dobru (2013), A tree-based approach to modeling medical research data. Comparison with existing approaches in commercial applications,ActaMedicaTransilvanica,vol. II(1), pp. 172-174.
[3] Källén, A. (2011), Understanding Biostatistics,U.S.A.: Wiley.
[4] McNabb, D.E. (2010), Research Methods for Political Science: Quantitative and Qualitative Approaches,U.K.: M.E. Sharp.
[5] Rubin, A. and R. Babbie (2011), Research Methods for Social Work,U.K.: Brooks/Cole. [6] Babbie, R. (2010), The Practice of Social
Research,U.K.: Cengage Learning.
[7] Pitariu, H.D. (2000), Human resources management. Professional performance evaluation, Romania: All/Beck.
[8] Waddell, G., M. Newton, I. Henderson, D. Somerville, and C.J. Main (1993), A Fear-Avoidance Beliefs Questionnaire (FABQ) and the role of fear-avoidance beliefs in chronic low
back pain and disability,Pain, vol. 52(2), pp. 157-68.
[9] McBurney, D.H. and T.L. White (2009), Research Methods, Cengage Learning.
[10] Kumar, R. (2011), Research Methodology,India: APH Publishing.
[11] Streiner, D. (2003), Starting at the beginning: An introduction to coefficient alpha and internal consistency,Journal of Personality Assessment, vol. 80(1), pp. 99-103.
[12] George, D. and P. Mallery (2003), SPSS for Windows step by step: A simple guide and reference. 11.0 update (4th ed.), U.S.A.: Allyn & Bacon.
[13] Kline, P. (1999), The handbook of psychological testing (2nd ed.), U.K.: Routledge.
[14] Hebel, R. and R. McCarter (2011), Study Guide to Epidemiology and Biostatistics,U.S.A.: Jones & Bartlett Learning.