www.biogeosciences.net/10/2931/2013/ doi:10.5194/bg-10-2931-2013
© Author(s) 2013. CC Attribution 3.0 License.
Biogeosciences
Geoscientiic
Geoscientiic
Geoscientiic
Geoscientiic
The large variation in organic carbon consumption in spring in the
East China Sea
C.-C. Chen1, G.-C. Gong2,3,4, F.-K. Shiah2,5, W.-C. Chou2, and C.-C. Hung4,6
1Department of Life Science, National Taiwan Normal University, 88, Sec. 4, Ting-Chou Rd., Taipei 116, Taiwan 2Institute of Marine Environmental Chemistry and Ecology, National Taiwan Ocean University,
Keelung 202-24, Taiwan
3Center of Excellence for the Oceans, National Taiwan Ocean University, Keelung 202-24, Taiwan 4Taiwan Ocean Research Institute, National Applied Research Laboratories, Kaohsiung 852, Taiwan 5Research Center for Environment Changes, Academia Sinica, NanKang, Taipei 115, Taiwan
6Institute of Marine Geology and Chemistry, and Asia-Pacific Ocean Research Center, National Sun Yat-Sen University, Kaohsiung 804, Taiwan
Correspondence to:C.-C. Chen ([email protected])
Received: 17 October 2012 – Published in Biogeosciences Discuss.: 20 November 2012 Revised: 31 March 2013 – Accepted: 7 April 2013 – Published: 2 May 2013
Abstract.A tremendous amount of organic carbon respired by plankton communities has been found in summer in the East China Sea (ECS), and this rate has been signifi-cantly correlated with fluvial discharge from the Changjiang River. However, respiration data has rarely been collected in other seasons. To evaluate and reveal the potential control-ling mechanism of organic carbon consumption in spring in the ECS, two cruises covering almost the entire ECS shelf were conducted in the spring of 2009 and 2010. These re-sults showed that although the fluvial discharge rates were comparable to the high riverine flow in summer, the plank-ton community respiration (CR) varied widely between the two springs. In 2009, the level of CR was double that of 2010, with mean (±SD) values of 111.7 (±76.3) and 50.7 (±62.9) mg C m−3d−1, respectively. The CR was positively correlated with concentrations of particulate organic carbon and/or chlorophylla (Chla) in 2009 (allp <0.01). These results suggest that the high CR rate in 2009 can be at-tributed to high planktonic biomasses. During this period, phytoplankton growth flourished due to allochthonous nu-trients discharged from the Changjiang River. Furthermore, higher phytoplankton growth led to the absorption of an enor-mous amount of fugacity of CO2(fCO2)in the surface wa-ters, even with a significant amount of inorganic carbon re-generated via CR. In 2010, even more riverine runoff nutri-ents were measured in the ECS than in 2009. Surprisingly,
the growth of phytoplankton in 2010 was not stimulated by enriched nutrients, and its growth was likely limited by low water temperature and/or low light intensity. Low tempera-ture might also suppress planktonic metabolism, which could explain why the CR was lower in 2010. During this period, lower surface waterfCO2may have been driven mainly by physical process(es). To conclude, these results indicate that high organic carbon consumption (i.e. CR) in the spring of 2009 could be attributed to high planktonic biomasses, and the lower CR rate during the cold spring of 2010 might be likely limited by low temperature in the ECS. This further suggests that the high inter-annual variability of organic car-bon consumption needs to be kept in mind when budgeting the annual carbon balance.
1 Introduction
2002; Duarte and Agust´ı, 1998; Walsh et al., 1981). Estima-tion of the annual carbon budget will depend on the produc-tion and consumpproduc-tion of organic carbon, although it also will be affected by other processes, e.g. transporting from terres-trial sources, mixing with other water bodies, benthic pro-cesses, etc. Organic carbon production, i.e. primary produc-tivity, has been widely measured at a spatiotemporal scale around the world oceans (e.g. Falkowski and Woodhead, 1992; Thornton, 2012 and citation therein). However, there is relatively little data on the decomposition of organic carbon by plankton respiration (e.g. del Giorgio and Duarte, 2002; del Giorgio and Williams, 2005). Furthermore, highly sea-sonal and annual variability of organic carbon consumption make it even more difficult to budget the carbon balance (e.g. Chen et al., 2009; Smith and Kemp, 1995).
There is also a controversial debate between carbon sinks or sources in the East China Sea (ECS) ecosystem, one of the largest continental shelves in the world. By using the fugac-ity of CO2(fCO2), previous studies showed that remarkably high levels of atmospheric CO2 were drawndown into the surface waters of the ECS (Peng et al., 1999; Tsunogai et al., 1999; Wang et al., 2000). A similar result was also observed in summer, with flourishing planktonic activities; however, supersaturated CO2has regenerated in the subsurface waters below pycnocline in the ECS (Chen et al., 2006; Chou et al., 2009). Therefore, as Chen et al. (2006) propose, whether the ECS shelf acts as a carbon sink or source might depend on the amount of regenerated inorganic carbon in the sub-surface waters released through prevailing physical forces. Furthermore, it has also been validated that the organic car-bon consumption rate correlates with planktonic activities, which is in turn proportional to the fluvial discharge rate (e.g. Chen et al., 2009). These results also indicate that or-ganic carbon respired by the plankton community serves as an important factor in carbon cycling processes, but may vary seasonally under different physical and biogeochemical con-ditions. Since most studies on organic carbon consumption in the ECS were performed in summer (Chen et al., 2003, 2006, 2009), studies on other seasons are needed to conclu-sively reveal the annual carbon budget.
To explore this phenomenon further, data from two spring cruises were used to examine the roles and the potential con-trolling mechanisms of organic carbon consumption. Plank-ton community respiration (CR) was taken as the rate of or-ganic carbon consumption in this study. To evaluate this dif-ference, physical and chemical parameters and biological ac-tivities were analyzed and compared to elucidate the poten-tial causes for the spapoten-tial and inter-annual variations of CR. In addition, the relationship between CR andfCO2was ex-amined to reveal the contribution of the plankton community to thefCO2variation in spring.
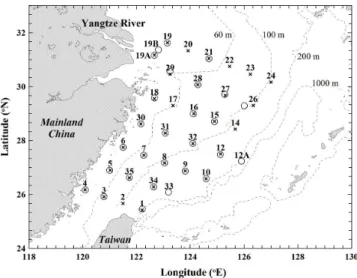
Fig. 1.Map of stations in the spring of 2009 (×) and 2010 () in the East China Sea (ECS) with the station number above the mark. Bottom depth contours (dashed lines; 60, 100, 200 and 1000 m) are also shown; this is also the case in Figs. 2, 3, and 7.
2 Materials and methods
2.1 Study area and sampling
This study is part of the Long-term Observation and Re-search of the East China Sea (LORECS) program. Samples were collected on board the R/VOcean Researcher I, Tai-wan, in the spring of 2009 (29 April–10 May) and 2010 (11 April–22 April), with a total of 32 and 28 stations, re-spectively, in the ECS (Fig. 1). Water samples were collected using Teflon-coated Go-Flo bottles (20 L, General Oceanics Inc., USA) mounted on a General Oceanic rosette assembly (Model 1015, General Oceanics Inc., USA). There were 6 to 9 sampling depths at intervals of 3 to 50 m, depending on the water column depth at each station. Subsamples were taken immediately for further analyses (i.e. nitrate, chlorophylla, and particulate organic carbon) and on-board incubation (i.e. primary production and plankton community respiration). 2.2 Hydrographic and optical measurements
2.3 Nutrients, chlorophylla, particulate organic carbon, and the fugacity of CO2(fCO2)
Water samples for dissolved inorganic nutrients (e.g. ni-trate, phosphate, and silicate) were collected from every sam-pling depth with 100 mL polypropylene bottles and were frozen immediately with liquid nitrogen. A custom-made flow-injection analyzer was used for nitrate, phosphate, and silicate analysis with detection limit of 0.3, 0.01, and 0.5 µM, respectively (Gong et al., 2003). Integrated values for nitrate and other variables in the water column above theZEwere estimated by trapezoidal method, whereby depth-weighted means were computed from vertical profiles and then mul-tiplied byZE(e.g. Smith and Kemp, 1995). Average nitrate concentration over theZEwas estimated from the vertically integrated value divided byZE, and this calculation was also carried out with other variables.
Chlorophylla (Chla) concentration was measured with a Sea Tech fluorometer attached to the SeaBird CTD for a continuous profile of in vivo fluorescence and calibrated by in vitro fluorometry. Water samples (2 L) for in vitro Chla measurement were immediately filtered through GF/F filter paper (Whatman, 47 mm) and stored in liquid nitrogen. The Chla retained on the GF/F filters was determined fluoro-metrically (Turner Design 10-AU-005, Parsons et al., 1984). If applicable, Chla was converted to carbon units using a C : Chl value of 52.9, estimated from the shelf waters of the ECS (Chang et al., 2003).
At selected stations, 2 L of water samples for particu-late organic carbon (POC) were filtered through a What-man 25 mm GF/F filter, wrapped in aluminum foil, and then stored at−20◦C until analysis. Both the filter and aluminum foil were prebaked at 500◦C for 2 h. After fuming the fil-ters with HCl, the POC on the filfil-ters was measured using an elemental analyzer (Elementa, Vario EL-III, Germany; Hung et al., 2010).
The fugacity of CO2in the surface waters was calculated from dissolved inorganic carbon (DIC) and total alkalinity (TA) data using the designed program (Lewis and Wallace, 1998). For details on TA and DIC measurements, refer to Chou et al. (2007).
2.4 Primary production
Primary production was measured by the 14C assimilation method (Gong et al., 1999; Parsons et al., 1984). Water sam-ples were collected from three depths withinZE at selected stations. Samples were prescreened through 200 µm woven mesh (Spectrum), and inoculated with H14CO−3 (final conc. 10 µCi mL−1)in 250 mL clean polycarbonate bottles (Nal-gene). Samples were incubated on board for 2–4 h in cham-bers filled with running surface seawater and illuminated by fluorescent bulbs with a light intensity corresponding to the in situ irradiance levels (Gong et al., 1999). Following re-trieval, samples were filtered on GF/F filters and acidified
overnight after the addition of 0.5 mL 2N HCl. Following immersion in 10 mL of scintillation cocktail (Ultima Gold, Packard), total activity on the filter was counted in a liq-uid scintillation counter (Packard 2700TR). The results of photosynthesis–irradiance curves were used to calculate pri-mary production for stations, with incubation performed (re-fer to Gong et al. (1999) for details). To estimate the euphotic zone-integrated primary production at stations where incu-bation was not performed, an empirical function was applied (please refer to Gong and Liu (2003) for details).
2.5 Plankton community respiration (CR) and statistical analysis
The CR was measured as the decrease in dissolved oxygen (O2)during dark incubation (Gaarder and Grann, 1927). In-cubation was conducted at most of the stations in the ECS, with duplicate samples taken from 2 to 6 discrete depths withinZEat each station. Treatment samples were siphoned into 300 mL biological oxygen demand bottles. The treat-ment involved incubating bottles for 24 h in a dark chamber filled with running surface water, with maximum temperature changes (mean±SD) of 1.89±1.70◦C and 3.33±2.52◦C during each incubations in 2009 and 2010, respectively. Tem-perature differences between top and bottom ofZEin all in-cubation stations were also small with mean (±SD) values of 1.58 (±1.30)◦C and 0.91 (±1.20)◦C in 2009 and 2010, respectively. Concentration of O2was measured by a direct spectrophotometry method with a precision of 0.02 mg l−1 (Chen et al., 2007; Pai et al., 1993). The difference in O2 concentration between initial and dark treatment was used to compute the CR (see Chen et al. (2003) for details). To convert respiration from oxygen to carbon units, a respira-tion quotient (RQ) of 1 was assumed (Hopkinson Jr., 1985; Parsons et al., 1984).
The software SigmaStat (version 3.5, Systat Software, Inc.) was used for the analysis of simple and multiple lin-ear regressions, for analysis of variance (ANOVA), and for the Mann–Whitney Rank Sum test for group comparison.
3 Results and discussion
3.1 Hydrographic patterns in the East China Sea (ECS) in spring
the coastal river discharge, especially from the Changjiang (aka Yangtze River).
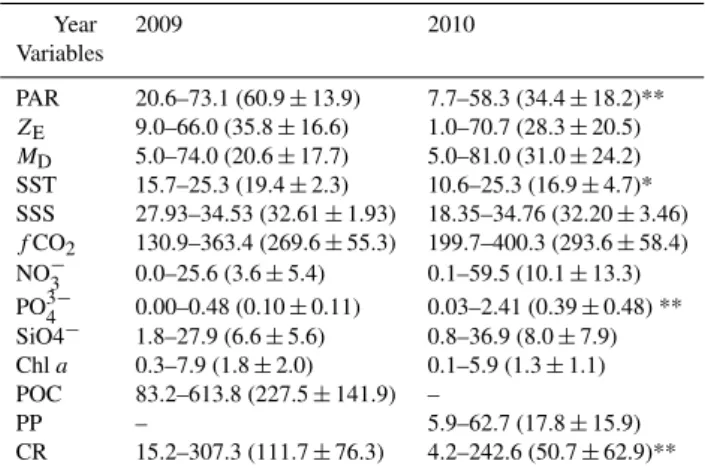
The largest variation of SST and SSS was consistent with periods of high river flow in late spring to early summer in the ECS (Chen et al., 1994; Tseng et al., 2000). High fluvial discharge was also observed in both spring seasons included in this study, and this can be demonstrated in the large area of the Changjiang Diluted Water (CDW; SSS≦31.0), which is assumed to be an index of riverine runoff (refer to Chen et al., 2009 for details). The area of CDW for 2009 (23 638 km2) and 2010 (19 907 km2) in this study were larger than the mean area of CDW (15 604 km2)in summer observed in a previous study (Chen et al., 2009). As expected, the increas-ing trend of SST and SSS from the inner shelf to the slope was also found in both spring seasons included this study, with the lowest values observed in the Changjiang plume re-gion (Fig. 2). This phenomenon was caused by tremendous fluvial discharge from the Changjiang River, which can be verified from the positively linear relationship between SST and SSS in both study periods (allp <0.001).
Even with a similar distribution pattern, larger spatial devi-ations for SST and SSS were observed in 2010 than for 2009 (Table 1; Fig. 2). The values of SST and SSS in 2009 were in the range of 15.7–25.3◦C (mean±SD=19.4±2.3◦C) and 27.93–34.53 (mean±SD=32.61±1.93), respectively (Ta-ble 1; Fig. 2a, b). Their values in 2010 were in the range of 10.6–25.3◦C (mean±SD=16.9±4.7◦C) and 18.35–34.76 (mean ±SD=32.20±3.46), with SST significantly lower in 2010 than in 2009 (Table 1; Fig. 2c, d). It is worth noting that, in 2010, the lowest SSS (18.35) was only observed at St. 19A. However, the mean±SD values of SSS in CDW in 2009 and 2010 were similar, with values of 29.27±0.73 and 29.24±1.61 (St. 19A excluded), respectively. These results all suggest that significant amounts of fresh waters were dis-charged from China’s coast, especially the Changjiang, onto the ECS shelf, and the discharged riverine water was colder during the 2010 study period.
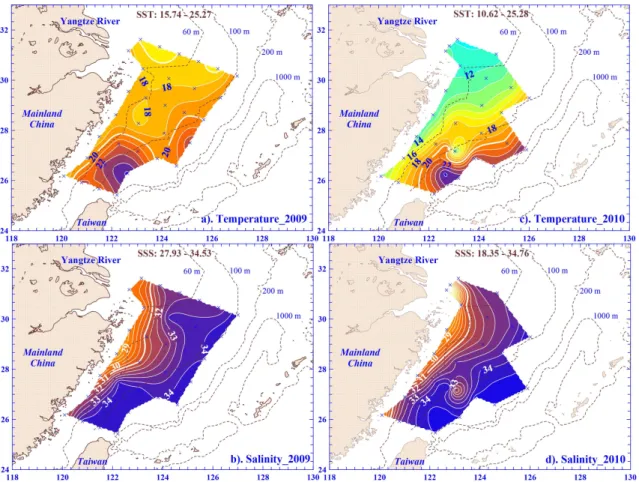
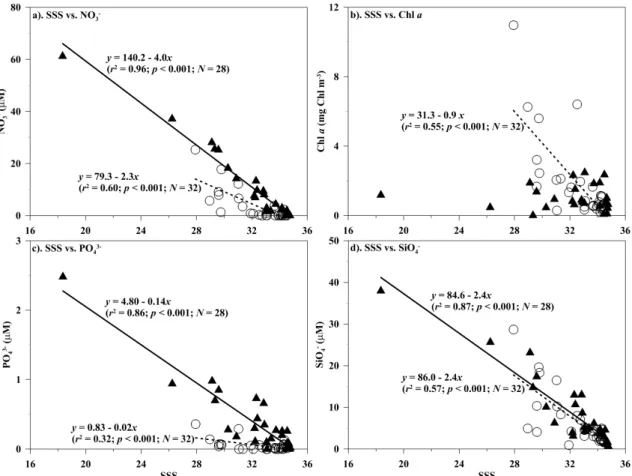
Riverine runoff is usually accompanied by large amounts of dissolved inorganic nutrients and discharged into the shelf ecosystem. In this study, this observation can be validated through the surface contour maps of nitrate, which reveal a similar trend to SSS distribution during both periods, i.e. the nitrate concentration in the surface waters was higher along the inner shelf and nearly depleted in the slope (Fig. 3a, c). A similar spatial pattern was also found for phosphate and silicate in the surface water in this (data not shown) and pre-vious studies (e.g. Gong et al., 1996, 2003). Further analyses show that nitrate concentrations in the surface waters were negatively correlated with SSS in both periods (Fig. 4a; all p <0.001). These inverse relationships are also found be-tween SSS and phosphate or silicate in the surface waters (Fig. 4c, d; allp <0.001). These results indicate that nutri-ents were mixing between riverine water and oceanic water with fluvial runoff as a major nutrient source in the ECS sur-face plume ecosystem.
Table 1.Range of different variables with mean±standard devi-ation (in parentheses) in surface water (2–3 m) and averaged val-ues over euphotic depth (ZE; m) in the ECS in the spring of
2009 and 2010. Surface water variables include water tempera-ture (SST;◦C), salinity (SSS), and fugacity of CO2(fCO2; µatm).
Variables of averaged value include nitrate (NO−3; µM), phos-phate (PO3−4 ; µM), silicate (SiO−4; µM), chlorophylla(Chla; mg Chl m−3), particulate organic carbon (POC; mg C m−3), primary production (PP; mg C m−3d−1), and plankton community respi-ration (CR; mg C m−3d−1). Values ofZEand mixed layer depth
(MD; m) are also shown. In addition, photosynthetically active
ra-diation (PAR; E m−2d−1)is provided for reference. The Mann– Whitney Rank Sum test was applied for variable comparison be-tween 2009 and 2010, and the results are indicated herein.
Year 2009 2010 Variables
PAR 20.6–73.1 (60.9±13.9) 7.7–58.3 (34.4±18.2)** ZE 9.0–66.0 (35.8±16.6) 1.0–70.7 (28.3±20.5) MD 5.0–74.0 (20.6±17.7) 5.0–81.0 (31.0±24.2) SST 15.7–25.3 (19.4±2.3) 10.6–25.3 (16.9±4.7)* SSS 27.93–34.53 (32.61±1.93) 18.35–34.76 (32.20±3.46) fCO2 130.9–363.4 (269.6±55.3) 199.7–400.3 (293.6±58.4) NO−3 0.0–25.6 (3.6±5.4) 0.1–59.5 (10.1±13.3) PO34− 0.00–0.48 (0.10±0.11) 0.03–2.41 (0.39±0.48) ** SiO4− 1.8–27.9 (6.6±5.6) 0.8–36.9 (8.0±7.9) Chla 0.3–7.9 (1.8±2.0) 0.1–5.9 (1.3±1.1) POC 83.2–613.8 (227.5±141.9) –
PP – 5.9–62.7 (17.8±15.9) CR 15.2–307.3 (111.7±76.3) 4.2–242.6 (50.7±62.9)**
–: no data; *:p <0.05; **:p <0.001.
Comparing data of two spring periods, the surface water nitrate was significantly lower in 2009 than in 2010, with values in the range of undetectable – 25.3 µM (mean ±SD value=3.1±5.8 µM) and undetectable – 61.3 µM (mean±SD value=10.5±14.4 µM), respectively (p <0.005; Fig. 3a, c). The mean value of average nitrate concentration over the euphotic zone in 2009 and 2010 were 3.6 µM and 10.1 µM, respectively (p=0.14; Table 1). Inter-estingly, a previous study showed that the nutrient concen-tration was positively related to the area of CDW in summer (Chen et al., 2009). Nitrate concentration, however, was rel-atively lower in 2009, even with the larger CDW area, when compared to 2010. This implies that growth of various plank-ton communities might be at different stages of bloom be-tween 2009 and 2010 following the intrusion of riverine wa-ters enriched with nutrients and organic matter.
3.2 Responses of plankton community in spring
Fig. 2.Contour plots of surface seawater temperature (SST) and salinity (SSS) of the ECS in 2009(a),(b)and 2010(c),(d), with contour lines of SST=20◦C and SSS=31 were bolded for reference. Contour intervals of temperature and salinity are 1◦C and 0.5, respectively.
thanZEin 2009, but the difference was not statistically sig-nificant. TheMD was slightly larger thanZE in 2010 with mean±SD values of 31.0±24.2 m and 28.3±20.5 m, re-spectively (Table 1). Overall, theMDwas lower than or close toZE in this study. For comparison, the biomass and rate of plankton communities were therefore integrated overZE, since most of them were measured withinZE.
Phytoplankton is one of the major plankton communi-ties and responds instantaneously following intrusion of en-riched nutrient diluted water. In the ECS, previous stud-ies found a higher biomass of phytoplankton in the CDW during high riverine flow periods in summer, with a mean value of 3.3 mg Chl m−3(Gong and Liu, 2003; Gong et al., 2003). The surface water Chlashowed a similar trend, with the highest value found in the CDW in 2009 of this study (Fig. 3b). The values were in the range of 0.20–10.96 mg Chl m−3with a mean±SD value of 1.81±2.36 mg Chl m−3 during this period.
The mean Chla value over theZEwas almost the same as that of surface water (Table 1). Even though the mean value was not as high as the 3.3 mg Chl m−3value observed during the peak summer season, the highest value (10.96 mg Chl m−3)was comparable to that measured in summer (Gong
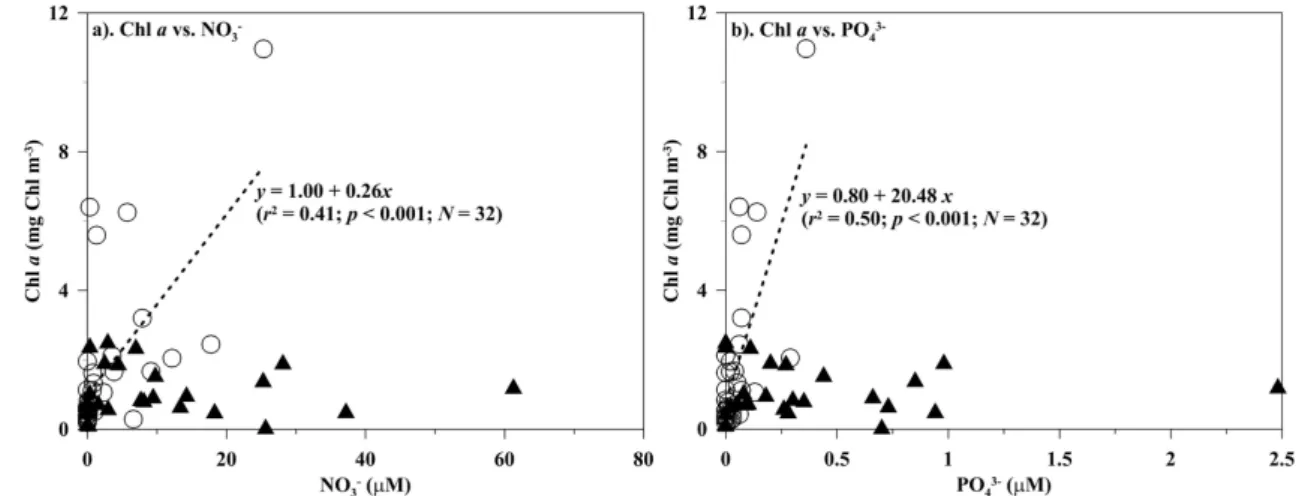
and Liu, 2003; Gong et al., 2003) and in late spring (Hung et al., 2009). Moreover, the Chl a spatial trend was simi-lar to surface water nitrate distribution in the spring of 2009 (Fig. 3a, b). One would therefore expect that the phytoplank-ton biomass would be associated with available nutrients dur-ing this study period. This assumption was confirmed by the positively linear relationship found between Chl a and ni-trate concentrations in the surface waters in 2009 (Fig. 5a; p <0.001). It was also supported by linear correlations ob-served between Chla and phosphate or silicate concentra-tions of the surface waters (Fig. 5b;p <0.001). In addition to surface water variables, linear regressions were also statis-tically significant between the averaged values over ZE of Chl a, on the one hand, and nitrate or silicate concentra-tions, on the other, in the spring of 2009 (data not shown; p <0.001). These results all suggest that high phytoplankton biomass might be enhanced by dissolved inorganic nutrients, enriched from the intrusion of riverine water into the ECS in this period (Fig. 5).
Fig. 3.Contour plots of nitrate and chlorophylla(Chla)in the surface waters of the ECS in 2009(a),(b)and 2010(c),(d). The contour intervals of nitrate and Chlaare 2 µM and 1 mg Chl m−3, respectively.
water in 2009 (Fig. 4b). Surprisingly, the spatial trend was somewhat different in surface water Chla in 2010, and the higher value was observed in the middle shelf (Fig. 3d). In the spring of 2010, the surface water Chl a value was in the range of 0.03–2.48 mg Chl m−3with a mean±SD value of 1.03±0.72 mg Chl m−3. Although nitrate concentrations were higher in 2010 than in 2009, both mean Chla values in the surface waters and averaged overZE were relatively low in 2010 compared to 2009. However, this difference was statistically insignificant (Fig. 3b, d; Table 1). This result sug-gests that nitrate availability might not have limited growth of phytoplankton in the spring of 2010, which can explain why phytoplankton biomass did not increase with nitrate concen-tration increasing in this period (Fig. 5a). Besides available dissolved inorganic nitrogen, phytoplankton growth limited by phosphate has been observed in the ECS, especially in the CDW (Chen et al., 2004; Gong et al., 1996; Harrison et al., 1990). However, this might not be the case since the mean ±SD value of phosphate in the surface water in the CDW was as high as 0.85±0.77 µM in 2010. Furthermore, the mean molar ratio of N/P in the surface waters was 17.5 for the stations around the CDW regions (e.g. Sts. 19 and 21). These results indicate that dissolved inorganic nutrients may
not limit growth of phytoplankton in terms of either avail-ability or N/P molar ratio in 2010, especially in the CDW.
Beyond nutrients, phytoplankton growth may have been regulated by temperature, light intensity, and/or herbivorous grazers. Among the analyzed variables, SST was signifi-cantly lower in 2010 (mean=16.9◦C) than that in 2009 (mean=19.4◦C; Table 1). Moreover, the mean SST was much lower in the CDW region in 2010 (mean=12.2◦C) than in 2009 (mean=18.0◦C; Fig. 2a, c). To explore this further, Chl a concentrations in the surface waters were positively and negatively correlated, respectively, with SST <15◦C and ≧15◦C in 2010 (Fig. 6). The positive lin-ear regression found in SST<15◦C indirectly showed ev-idence that the growth of phytoplankton might be limited by cold temperature, but not nutrient availability (mean value=20.9 µM; Fig. 5) in 2010.
Fig. 4.Relationships between salinity (SSS) vs.(a)nitrate (NO−3),(b)chlorophylla(Chla),(c)phosphate (PO3−4 ), and(d)silicate (SiO−4)
of the surface waters in the spring of 2009 (; dashed lines) and 2010 (N; solid lines) of the ECS. Bothpandr2values of linear regression are also shown if statistical significance was evidenced.
intensity on primary production (PP) in aquatic ecosystems is well known, and PP usually increases hyperbolically with an increase in light intensity (Kirk, 1994). As stated above, a previous study showed that the highest PP, seasonally, was observed in summer with mean values of integrated PP and PAR of about 1000 mg C m−2d−1and 79.9 E m−2d−1, respectively (Gong et al., 2003). The mean (±SD) val-ues of integrated PP and averaged PP over ZE were 485.9 (±571.9) mg C m−2d−1and 17.8 (±15.9) mg C m−3d−1, re-spectively, in the spring of 2010 (Table 1). This mean inte-grated PP value was only about half of that observed during the high production season in summer (Gong et al., 2003). Light limitation on phytoplankton growth was even more critical due to a largerMD(31.0 m) and smallerZE(28.3 m) in the spring of 2010 (Table 1). To conclude, these results im-ply that the growth of phytoplankton was limited by both the cold water temperature and low light intensity in spring of 2010. This can explain why the phytoplankton biomass (i.e. Chla)was lower in 2010 than in 2009 although there were more available nutrients in the spring of 2010 (Table 1).
3.3 High organic carbon consumption in spring 2009
Fig. 5.Relationships between chlorophylla(Chla)vs.(a)nitrate (NO3−)and(b)phosphate (PO3−4 )of the surface waters in the spring of 2009 (; dashed lines) and 2010 (N) of the ECS. Bothpandr2values of linear regression are also shown if statistical significance was evidenced.
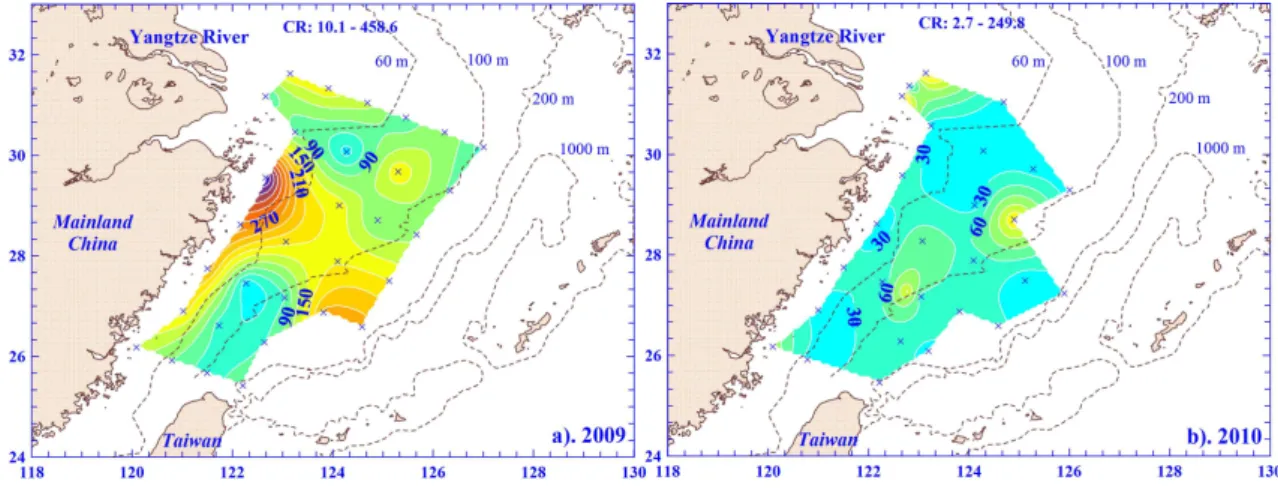
The CR contour demonstrates spatial patterns of biotic or-ganic consumption across the entire shelf of the ECS. The CR in the surface waters ranged from 10.1 to 458.6 mg C m−3d−1with a mean (±SD) value of 132.0 (±95.6) mg C m−3d−1in 2009 (Fig. 7a). Spatially, in 2009, the higher CR values were mostly along the coast, and surprisingly, in part of the outer shelf of the ECS (e.g. Sts. 9, 10, and 12). The higher CR can be attributed to the higher planktonic biomass; a positive correspondence between CR and phytoplankton biomass or primary production has been observed widely in marine ecosystems (e.g. Jensen et al., 1990; Robinson et al., 2002; Smith and Kemp, 1995). A linear relationship was also apparent between CR and Chl a either in surface wa-ters (r2=0.34;p <0.001) or using averaged values overZE (r2=0.25;p <0.01) in this period. The result still holds true when using Chla expressed in carbon units. Further, phyto-plankton respiration was estimated using a biomass specific rate of respiration of 0.25 (Geider, 1992). Results show that of all the CR in the spring of 2009, 23.3 % was contributed by phytoplankton.
Among other plankton communities, bacterioplankton has been recognized as an important component of organic car-bon consumption in many aquatic ecosystems (e.g. Chin-Leo and Benner, 1992; del Giorgio and Duarte, 2002; Griffith et al., 1990). Shiah et al. (2000b) estimated that in the ECS, heterotrophic bacterioplankton has completely consumed in situ particulate organic carbon production. Unfortunately, this component was not measured in the present study. How-ever, to examine how CR relates to plankton communities, POC can be assumed to be an indicator of total plank-tonic biomass. The averaged POC value overZEwas in the range of 82.2–613.8 mg C m−3, with a mean (±SD) value of 227.5 (±141.9) mg C m−3in 2009 (Table 1). Phytoplank-ton biomass approximately accounted for 42 % of the mean POC, if Chla was expressed per carbon units. Although the
mean Chlavalue (1.8 mg Chl m−3)in 2009 was not as high as the mean value (3.3 mg Chl m−3)observed in summer in previous studies (Table 1; Gong and Liu, 2003; Gong et al., 2003), the POC values in this study were higher than those found in a previous study in summer in the ECS (Chen et al., 2009). Moreover, the high CR rate was linearly regressed with POC both in the surface waters (r2=0.38;p <0.001) and using averaged values over ZE (r2= 0.31; p <0.01) in this period. These results imply that high rates of CR in 2009 were associated with a higher planktonic biomass. The high POC suggested that, in addition to phytoplank-ton, other plankton communities (e.g. bacterioplankphytoplank-ton, pro-tozoan, and zooplankton) might serve as important compo-nents contributing to the CR in this period.
3.4 Low organic carbon consumption in the spring of 2010
Fig. 6.Relationship between Chlaand temperature in the surface waters in the spring of 2010. Linear regressions between Chlavs. temperature<15◦C (; solid line) or temperature≧15◦C (N; dashed line) withr2andpare also shown.
In addition, a linear relationship between the integrated val-ues of CR and PP was also proven for this period (data not shown;r2=0.89;p <0.001). These results further support the assumption that lower CR observed in 2010 might be re-lated to the low biomass and production of phytoplankton.
Besides phytoplankton, the CR might also have been ited by the lower temperature in the spring of 2010. A lim-itation of temperature on the growth of bacteria has been found in the ECS, particularly for water temperatures be-low 20◦C (Shiah et al., 1999, 2000a). The mean value of SST was 16.9◦C in the spring of 2010 (Table 1). This in-dicates that bacterial growth, as well as CR, was potentially confined by the low water temperature. Even though the low temperature limitation on bacterial biomass and production could not be verified, since it was not measured in this study, the temperature limitation on phytoplankton could be indi-rectly validated from the positively linear relationship be-tween Chlaconcentrations and SST<15◦C in the surface waters (p≦0.001; Fig. 6). Moreover, the integrated CR val-ues were positively linearly regressed with the averaged tem-perature overZEin 2010 (r2=0.27;p <0.01). These results suggest that the lower CR in 2010 might be due to the low planktonic biomass and the low temperature restriction on the metabolic rates of plankton communities.
To elucidate whether an ecosystem is autotrophic or het-erotrophic, the ratio of primary production to respiration (P /Rratio) is applied. In this study, the ratio of integrated values (mg C m−2d−1) of primary production to CR was used to explore organic carbon utilization between produc-tion and consumpproduc-tion in the spring of 2010 in the ECS. The results showed that theP /Rratios were in the range of 0.06 to 2.30 with a mean (±SD) value of 0.85 (±0.71). There
were five stations with aP /Rratio≧1 (mean value=1.47), and these stations (Sts. 5, 21, 29, and 30) were mostly in the inner shelf (isobath≦60 m; Fig. 1; Beardsley et al., 1985), except for St. 28. Interestingly, the lowerP /Rratios (<1) were observed mostly in the middle (isobath within 60– 100 m) to outer shelves (isobath>100 m) in this period, ex-cept for St. 19A. These results suggest that, in the ECS in spring 2010, the inner shelf ecosystem was autotrophic, but the middle to outer shelves were more heterotrophic. Pre-vious studies have also shown that the ECS shelf was a net heterotrophic ecosystem in other seasons (Chen et al., 2003, 2006), except for the inner shelf with high primary productivity (>3500 mg C m−2d−1). To support the claim that the ECS is net heterotrophic, high bacterial consump-tion has been suggested and supported by the observaconsump-tion of a tremendous amount of organic carbon discharged from coastal rivers, especially the Changjiang River (Cauwet and Mackenzie, 1993; Chen et al., 2003; Chen and Wang, 1996). However, high CR was not observed during the high riverine discharge period of 2010 (Table 1; Fig. 2c, d).
Bacterial activity might be limited by lower water temper-ature (mean value=12.2◦C in the CDW region), even with an enormous amount of organic carbon in the inner shelf. This can further explain why an autotrophic ecosystem was still found in this low primary production region. The low P /Rratio (i.e. 0.85) in this period was also consistent with previous studies, in which such a low ratio (i.e.<1) has been widely observed in coastal regions with low primary produc-tivity (e.g. del Giorgio et al., 1997; Duarte and Agust´ı, 1998).
3.5 Effect of plankton community respiration onfCO2
Fig. 7.Contour plots of plankton community respiration (CR) in the surface waters of the ECS in(a)2009 and(b)2010, with a contour interval of 30 mg C m−3d−1.
strong absorption by photosynthesis. Although primary pro-duction was not measured in 2009, this assumption could still be indirectly evaluated from relationships between fCO2 and Chla, POC, or CR – particularly CR, which is an inte-grated response of planktonic activities. To verify this, it was found that fCO2 was indeed negatively linearly regressed against CR in the surface waters in 2009 (p <0.05; Fig. 8a). A similar relationship still held true betweenfCO2and the averaged CR overZEin 2009 (p <0.01). The higher CR in-dicates that planktonic activities were vigorous. The lower fCO2 observed in 2009 implies that more CO2 was ab-sorbed via photosynthesis than that regenerated from CR in regions with higher planktonic activities, and this could also explain the huge deficiency observed between surface wa-terfCO2 (269.6 µatm) in 2009 and atmospheric CO2 (ap-prox. 360 µatm). This implication is supported by the nega-tively linear relationship found betweenfCO2and POC in the surface waters of 2009 (r2=0.43;p <0.001). In addi-tion, surface water fCO2 might also be affected by a sig-nificant amount of freshwater discharge into the ECS. To evaluate, the conservative mixing of TA and DIC data be-tween freshwater and seawater end-members were applied. The TA and DIC data reported by Zhai et al. (2007) for the Changjiang River in spring was used as the freshwater end-member data point (both TA and DIC=1575 µmol kg−1), whereas the averaged surface data at Sts. 10, 12, 24 and 26 in the spring of 2009 were chosen to represent the sea-water end-member (SSS=34.4, TA=2279 µmol kg−1, and DIC=1960 µmol kg−1; W. C. Chou, unpublished data). The result shows thatfCO2varies from 262 to 277 µatm within a salinity range between 20 and 34.4, which is relatively small compared to the observed inter-annual variation offCO2. It also implies that the effect of the Changjiang River discharge onfCO2in the ECS might be minor in the spring. In addi-tion, these results suggest that there was a strong carbon sink during this study period, especially due to biological uptake.
There was no significant relationship observed between fCO2and CR or Chlain surface water for 2010 (Fig. 8a). Further, thefCO2was regressed against net community pro-duction (NCP), i.e. PP–CR, estimated from measured val-ues since thefCO2should be more directly related to NCP. As expected, a negatively linear relationship was signifi-cantly evident betweenfCO2and NCP in 2010 (r2=0.42; p <0.001; Fig. 8b). This relationship, however, became sta-tistically insignificant if two smaller NCP data points, ob-served from St. 19A, were excluded from this analysis. These results also imply that effect of biological activity onfCO2 might be trivial, especially during a cold period with low primary production. ThefCO2 might therefore have been driven mostly by the physical properties (e.g. temperature) of seawater during this period. This can further explain why a heterotrophic ecosystem with a low P/R ratio (0.85) would still have a small mean value offCO2(293.6 µatm). Overall, these results suggest that the relative contribution of plank-tonic activities and physical processes to shelf carbon cy-cling in spring might depend on the magnitude of planktonic growth. That is, plankton communities could have a signifi-cant impact on surface waterfCO2during flourishing plank-tonic growth. However, surface waterfCO2might be mostly controlled by physical factor(s) and less influenced by plank-tonic activities in a cold spring period.
4 Conclusions
flu-Fig. 8.Relationships between fugacity of CO2 (fCO2)vs.(a)plankton community respiration (CR) in the surface waters and(b) net
community production (NCP=PP–CR) in the spring of 2009 (•; dashed line) and 2010 (; solid line). Primary production was used the measured values where incubation performed. Bothpandr2values of linear regression are also shown if statistical significance was evident.
vial discharge. The hydrographic results showed that spatial distribution patterns in temperature (SST) and salinity (SSS) of the surface waters were similar in both springs, i.e. both SST and SSS increased from the inner shelf toward the slope. However, the mean value of SST was significantly lower in 2010 (16.9◦C) than in 2009 (19.4◦C).
Spatially, nitrate concentration in the surface waters also revealed a similar trend to SSS distribution in both periods, but the mean value of nitrate was statistically higher in 2010 (10.5 µM) than in 2009 (3.1 µM). These results also suggest that nutrients follow a dilution pattern, with riverine runoff as a major nutrient source in the ECS surface plume. Surpris-ingly, even with higher nitrate concentration, the mean Chla value in surface waters was lower in 2010 (1.03 mg Chl m−3) compared to 2009 (1.81 mg Chl m−3). Further analyses show that the growth of phytoplankton in spring of 2010 might be limited by low water temperature and light intensity, but not by nutrients.
Even though the phytoplankton biomass was slightly higher in 2009, the CR in this period was twice (mean value=111.7 mg C m−3d−1) that of 2010 (mean value=50.7 mg C m−3d−1). This CR rate in 2009 was com-parable to the highest rate observed in summer in the ECS (Chen et al., 2006, 2009). Spatially, the higher rates of CR were mostly observed along the coast, an observation which corresponded to the higher Chla concentration, suggesting that a remarkable amount of organic carbon consumption was respired by flourishing plankton communities in 2009. Although no other planktonic biomass was measured in this study, its contribution to CR can be indirectly evidenced from the high particulate organic carbon (mean value=227.5 mg C m−3)observed in 2009.
Even with the high CR, a huge amount of fugacity of CO2 (fCO2)in the surface waters was still drawn down due to vigorous phytoplankton activity in this period. This also can
explain why mean fCO2 during the warm spring of 2009 (mean value=269.6 µatm) was even lower than that in the cold spring of 2010 (mean value=293.6 µatm). In contrast, the mean CR value in 2010 was at the lower end of the re-ported CRs in the ECS and in the coastal shelf, as well as slope regions (e.g. Biddanda et al., 1994; Chen et al., 2003, 2006, 2009; Williams, 1984). The results suggest that the low CR might have been caused by the low biomass and metabolism of plankton, which was suppressed by the low water temperature. During this period, thefCO2of the sur-face waters might mainly have been driven by physical pro-cesses, and the effect of biological activity onfCO2could be trivial.
To conclude, these results indicate that the contribution of plankton communities to organic carbon consumption and fCO2 in surface waters could have high inter-annual vari-ability. While planktonic growth is flourishing, the produc-tion and consumpproduc-tion of organic carbon by plankton commu-nities could have a significant impact on surface waterfCO2. However, surface waterfCO2might be mainly controlled by physical factor(s) and less influenced by planktonic activities in cold periods. The results also suggest that special attention is needed when budgeting annual carbon balances due to this inter-annual variability.
Supplementary material related to this article is available online at: http://www.biogeosciences.net/10/ 2931/2013/bg-10-2931-2013-supplement.pdf.
and NSC-101-2611-M-003-003 to C.-C. Chen. The work of G.-C. Gong was partly supported by Center of Excellence for the Oceans, National Taiwan Ocean University. We are furthermore indebted to the officers and crew of theOcean Researcher Ifor their assistance. The authors are also grateful to guest editor, H. B. Liu at the Hong Kong University of Science and Technology, and three anonymous reviewers for providing valuable and constructive comments to improve the manuscript.
Edited by: H. Liu
References
Beardsley, R. C., Limeburner, R., Yu, H., and Cannon, G. A.: Dis-charge of the Changjiang (Yangtze River) into the East China Sea, Cont. Shelf Res., 4, 57–76, 1985.
Biddanda, B., Opsahl, S., and Benner, R.: Plankton Respiration and Carbon Flux through Bacterioplankton on the Louisiana Shelf, Limnol. Oceanogr., 39, 1259–1275, 1994.
Calbet, A. and Landry, M. R.: Phytoplankton growth, microzoo-plankton grazing, and carbon cycling in marine systems, Limnol. Oceanogr., 49, 51–57, 2004.
Cauwet, G. and Mackenzie, F. T.: Carbon inputs and distribution in estuaries of turbid rivers: the Yang Tze and Yellow rivers (China), Mar. Chem., 43, 235–246, 1993.
Chang, J., Shiah, F. K., Gong, G. C., and Chiang, K. P.: Cross-shelf variation in carbon-to-chlorophyllaratios in the East China Sea, summer 1998, Deep-Sea Res. Pt II, 50, 1237–1247, 2003. Chen, C.-C., Shiah, F.-K., Gong, G.-C., and Chiang, K.-P.:
Plank-tonic community respiration in the East China Sea: importance of microbial consumption of organic carbon, Deep-Sea Res. Pt II, 50, 1311–1325, 2003.
Chen, C.-C., Chiang, K.-P., Gong, G.-C., Shiah, F.-K., Tseng, C.-M., and Liu, K.-K.: Importance of planktonic commu-nity respiration on the carbon balance of the East China Sea in summer, Glob. Biogeochem. Cy., 20, Gb4001, doi:10.1029/2005GB002647, 2006.
Chen, C.-C., Gong, G.-C., and Shiah, F.-K.: Hypoxia in the East China Sea: One of the largest coastal low-oxygen areas in the world, Mar. Environ. Res., 64, 399–408, 2007.
Chen, C.-C., Shiah, F.-K., Chiang, K.-P., Gong, G.-C., and Kemp, W. M.: Effects of the Changjiang (Yangtze) River discharge on planktonic community respiration in the East China Sea, J. Geo-phys. Res., 114, C03005, doi:10.1029/2008jc004891, 2009. Chen, C. S., Beardsley, R. C., Limeburner, R., and Kim, K.:
Com-parison of winter and summer hydrographic observations in the Yellow and East China Seas and adjacent Kuroshio during 1986, Cont. Shelf Res., 14, 909–929, 1994.
Chen, C. T. A. and Wang, S. L.: Carbon and nutrient budgets on the East China Sea continental shelf, Biogeochemical processes in the North Pacific, Proceedings of the International Marine Science Symposium 12–14 November, Mutsu, Japan, 169–186, 1996.
Chen, Y.-L. L., Chen, H.-Y., Gong, G.-C., Lin, Y.-H., Jan, S., and Takahashi, M.: Phytoplankton production during a summer coastal upwelling in the East China Sea, Cont. Shelf Res., 24, 1321–1338, 2004.
Chin-Leo, G. and Benner, R.: Enhanced bacterioplankton produc-tion and respiraproduc-tion at intermediate salinities in the Mississippi
River plume, Mar Ecol-Prog Ser, 87, 87–103, 1992.
Chou, W. C., Sheu, D. D., Chen, C. T. A., Wen, L. S., Yang, Y., and Wei, C. L.: Transport of the South China Sea subsurface wa-ter outflow and its influence on carbon chemistry of Kuroshio waters off southeastern Taiwan, J. Geophys. Res., 112, C12008, doi:10.1029/2007jc004087, 2007.
Chou, W. C., Gong, G. C., Sheu, D. D., Jan, S., Hung, C. C., and Chen, C. C.: Reconciling the paradox that the heterotrophic wa-ters of the East China Sea shelf act as a significant CO2sink
dur-ing the summertime: Evidence and implications, Geophys. Res. Lett., 36, L15607, doi:10.1029/2009gl038475, 2009.
de Haas, H., van Weering, T. C. E., and de Stieger, H.: Organic carbon in shelf seas: sinks or sources, processes and products, Cont. Shelf Res., 22, 691–717, 2002.
del Giorgio, P. A. and Duarte, C. M.: Respiration in the open ocean, Nature, 420, 379–384, 2002.
del Giorgio, P. A. and Williams, P. J. le B.: Respiration in aquatic ecosystems, Oxford University Press, New York, 315 pp., 2005. del Giorgio, P. A., Cole, J. J., and Cimbleris, A.: Respiration rates in bacteria exceed phytoplankton production in unproductive aquatic systems, Nature, 385, 148–151, 1997.
Duarte, C. M. and Agust´ı, S.: The CO2balance of unproductive
aquatic ecosystems, Science, 281, 234–236, 1998.
Gaarder, T. and Grann, H. H.: Investigations of the production of plankton in the Oslo Fjord. Rapport et Proces-Verbaux des Re-unions, Conseil Permanent International pour l’Exploration de la Mer, 42, 3–31, 1927.
Geider, R. J.: Respiration: Taxation without representation?, in: Pri-mary productivity and biogeochemical cycles in the sea, edited by: Falkowski, P. G., and Woodhead, A. D., Plenum Press, New York, 333–360, 1992.
Gong, G.-C. and Liu, G.-J.: An empirical primary production model for the East China Sea, Cont. Shelf Res., 23, 213–224, 2003. Gong, G.-C., Chen, Y.-L. L., and Liu, K.-K.: Chemical hydrography
and chlorophylladistribution in the East China Sea in summer: implication in nutrient dynamics, Cont. Shelf Res., 16, 1561– 1590, 1996.
Gong, G.-C., Chang, J., and Wen, Y.-H.: Estimation of annual pri-mary production in the Kuroshio waters northeast of Taiwan us-ing a photosynthesis-irradiance model, Deep-Sea Res. I, 46, 93– 108, 1999.
Gong, G.-C., Wen, Y.-H., Wang, B.-W., and Liu, G.-J.: Seasonal variation of chlorophyll a concentration, primary production and environmental conditions in the subtropical East China Sea, Deep-Sea Res. Pt. II, 50, 1219–1236, 2003.
Goyet, C., Millero, F. J., Poisson, A., and Shafer, D. K.: Temper-ature dependence of CO2fugacity in seawater, Mar. Chem., 44,
205–219, 1993.
Falkowski, P. G. and Woodhead, A. D.: Primary production and bio-geochemical cycles in the sea, Plenum Press, New York, 545 pp., 1992.
Griffith, P. C., Douglas, D. J., and Wainright, S. C.: Metabolic activity of size-fractionated microbial plankton in estuarine, nearshore, and continental shelf waters of Georgia, Mar. Ecol.-Prog. Ser., 59, 263–270, 1990.
Hern´andez-Le´on, S. and Ikeda, T.: A global assessment of mesozoo-plankton respiration in the ocean, J. Plankton Res., 27, 153–158, 2005.
Hopkinson Jr., C. S.: Shallow-water benthic and pelagic metabolism: evidence of heterotrophy in the nearshore Georgia Bight, Mar. Biol., 87, 19–32, 1985.
Hopkinson Jr., C. S., Sherr, B., and Wiebe, W. J.: Size fractionated metabolism of coastal microbial plankton, Mar. Ecol.-Prog. Ser., 51, 155–166, 1989.
Hung, C.-C., Gong, G.-C., Chiang, K. P., Chen, H. Y., and Yeager, K. M.: Particulate carbohydrates and uronic acids in the northern East China Sea, Estuar. Coast. Shelf Sci., 84, 565–572, 2009. Hung, C.-C., Gong, G.-C., Chou, W.-C., Chung, C.-C., Lee,
M.-A., Chang, Y., Chen, H.-Y., Huang, S.-J., Yang, Y., Yang, W.-R., Chung, W.-C., Li, S.-L., and Laws, E.: The effect of ty-phoon on particulate organic carbon flux in the southern East China Sea, Biogeosciences, 7, 3007–3018, doi:10.5194/bg-7-3007-2010, 2010.
Jensen, L. M., Sand-Jensen, K., Marcher, S., and Hansen, M.: Plankton community respiration along a nutrient gradient in a shallow Danish estuary, Mar. Ecol. Prog. Ser., 61, 75–85, 1990. Kirk, J. T. O.: Light and photosynthesis in aquatic ecosystems,
Cambridge University Press, New York, 509 pp., 1994. Levitus, S.: Climatological atlas of the word ocean, NOAA
profes-sional paper No. 13, US Government Printing Office, Washing-ton, DC, 173 pp., 1982.
Lewis, E. and Wallace, D. W. R.: Program developed for CO2
sys-tem calculations, Rep. ORNL/CDIAC-105, Carbon Dioxide Inf. Anal. Cent., Oak Ridge Natl. Lab., Oak Ridege, Tenn., 1998. Liu, K.-K., Peng, T.-H., Shaw, P.-T., and Shiah, F.-K.: Circulation
and biogeochemical processes in the East China Sea and the vicinity of Taiwan: an overview and a brief synthesis, Deep-Sea Res. Pt II, 50, 1055–1064, 2003.
Pai, S.-C., Gong, G.-C., and Liu, K.-K.: Determination of dissolved oxygen in seawater by direct spectrophotometry of total iodine, Mar. Chem., 41, 343–351, 1993.
Parsons, T. R., Maita, Y., and Lalli, C. M.: A manual of chemical and biological methods for seawater analysis, Pergamon Press, New York, 173 pp., 1984.
Peng, T. H., Hung, J. J., Wanninkhof, R., and Millero, F. J.: Carbon budget in the East China Sea in spring, Tellus B, 51, 531–540, 1999.
Robinson, C., Serret, P., Tilstone, G., Teira, E., Zubkov, M. V., Rees, A. P., and Woodward, E. M. S.: Plankton respiration in the East-ern Atlantic Ocean, Deep-Sea Res. I, 49, 787–813, 2002.
Shiah, F.-K., Gong, G.-C., and Liu, K.-K.: Temperature vs. substrate limitation of heterotrophic bacteriaoplankton production across trophic and temperature gradients in the East China Sea, Aquat. Microb. Ecol., 17, 247–254, 1999.
Shiah, F.-K., Liu, K.-K., Kao, S.-J., and Gong, G.-C.: The cou-pling of bacterial production and hydrography in the southern East China Sea, Cont. Shelf Res., 20, 459–477, 2000a.
Shiah, F.-K., Gong, G.-C., Chen, T.-Y., and Chen, C.-C.: Tempera-ture dependence of bacterial specific growth rates on the conti-nental shelf of the East China Sea and its potential application in estimating bacterial production, Aquat. Microb. Ecol., 22, 155– 162, 2000b.
Smith, E. M. and Kemp, W. M.: Seasonal and regional variations in plankton community production and respiration for the Chesa-peake Bay, Mar. Ecol. Prog. Ser., 116, 217–231, 1995.
Thornton, D. C. O.: Primary production in the ocean, in: Advances in Photosynthesis – Fundamental Aspects, edited by: Najafpour, M. M., InTech, Rijeka, Croatia, 563–588, 2012.
Tseng, C., Lin, C., Chen, S., and Shyu, C.: Temporal and spatial variations of sea surface temperature in the East China Sea, Cont. Shelf Res., 20, 373–387, 2000.
Tsunogai, S., Watanabe, S., and Sato, T.: Is there a “continental shelf pump” for the absorption of atmospheric CO2?, Tellus B, 51,
701–712, 1999.
Walsh, J. J.: Importance of continental margins in the marine bio-geochemical cycling of carbon and nitrogen, Nature, 350, 53–55, 1991.
Walsh, J. J., Rowe, G. T., Iverson, R. L., and McRoy, C. P.: Bio-logical export of shelf carbon is a sink of the global CO2cycle,
Nature, 291, 196–201, 1981.
Wang, S. L., Chen, C. T. A., Hong, G. H., and Chung, C. S.: Carbon dioxide and related parameters in the East China Sea, Cont. Shelf Res., 20, 525–544, 2000.
Williams, P. J. le B.: A review of measurements of respiration rates of marine plankton populations, in: Heterotrophic activity in the sea, edited by: Hobbie, J. E., and Williams, P. J. le B., Plenum Press, New York, 357–389, 1984.
Wollast, R.: Evaluation and comparison of the global carbon cycle in the coastal zone and in the open ocean, in: The Sea, the global coastal ocean, processes and methods, edited by: Brink, K. H. and Robinson, A. R., Wiley, New York, 213–252, 1998. Zhai, W. D., Dai, M. H., and Guo, X. G.: Carbonate system and CO2