Working
Paper
345
Anticipatory effects in the FTSE 100
index revisions
Marcelo Fernandes
João Mergulhão
CEQEF - Nº13
– • •
Os artigos dos Textos para Discussão da Escola de Economia de São Paulo da Fundação Getulio
Vargas são de inteira responsabilidade dos autores e não refletem necessariamente a opinião da
FGV-EESP. É permitida a reprodução total ou parcial dos artigos, desde que creditada a fonte.
Escola de Economia de São Paulo da Fundação Getulio Vargas FGV-EESP
Anticipatory effects in the FTSE 100 index revisions
Marcelo Fernandes Jo˜ao Mergulh˜ao
Sao Paulo School of Economics, FGV Sao Paulo School of Economics, FGV and Queen Mary University of London
This version: November 11, 2013
Abstract: This paper examines the price impact of trading due to expected changes in the
FTSE 100 index composition. We focus on the latter index because it employs
publicly-known objective criteria to determine membership and hence it provides a natural context
to investigate anticipatory trading effects. We propose a panel-regression event study that
backs out these anticipatory effects by looking at the price impact of the ex-ante
proba-bility of changing index membership status. Our findings reveal that anticipative trading
explains about 40% and 23% of the cumulative abnormal returns of additions and deletions,
respectively. We confirm these in-sample results out of sample by tracking the performance
of a trading strategy that relies on the addition/deletion probability estimates. The
perfor-mance is indeed very promising in that it entails an average daily excess return of 11 basis
points over the FTSE 100 index.
JEL classification numbers: G12, G15, C14
Keywords: additions, deletions, imperfect substitutes, index composition, liquidity, price pressure. We are grateful to Pedro Saffi, Ana Paula Serra and Pedro Valls for helpful comments as well as to seminar participants at Queen Mary, FGV School of Business at So Paulo, University of Porto, Insper Business School as well as at the Luso-Brazilian Finance conference (Bzios 2013), and at the meetings of the European Financial Management Association (Barcelona 2012), the Brazilian Finance Society (So Paulo 2012), ANPEC (Iguazu Falls 2011), and the Midwest Finance Association (New Orleans 2011). The usual disclaimer applies.
1
Introduction
This paper examines price and volume reactions to entering or leaving the FTSE 100 index.
We focus on the FTSE index for a number of reasons. First, membership depends exclusively
on relative market capitalization. As the latter is public information, changes in the index
composition are in principle devoid of information and hence should not affect prices. This
is contrast to membership in the S&P 500 index, which could well convey information about
a stock’s future performance given that the Standard & Poor’s also minimizes turnover in
index composition (see, e.g., Jain, 1987; Dhillon and Johnson, 1991). Second, the FTSE
100 index constituents are essentially very large UK-domiciled firms, accounting for about
85% of the market capitalization in the London Stock Exchange. As a result, it is not very
compelling in principle to associate abnormal performance either with future increases in
the monitoring of management (Denis, McConnell, Ovtchinnikov, and Yu, 2003) or with
changes in investor awareness (Chen, Noronha, and Singal, 2004). Third, we expect only
very limited short-lived effects due to portfolio rebalancing of index funds given that the vast
majority of the index-tracking funds in the UK actually track the FTSE All-Share index
rather than the FTSE 100 index (Brealey, 2000). Altogether, this makes the announcement
of the FTSE 100 index composition a natural event for testing whether stocks indeed have
perfectly elastic (i.e., horizontal) demand curves and whether investors anticipate revisions
in the index composition.
The empirical findings in the literature are very much in line with a downward sloping
demand curve in that inclusions and deletions command significant positive and negative
wealth effects, respectively. On the one hand, Harris and Gurel (1986) and Blouin, Raedy,
and Shackelford (2003) find that demand curves for stocks slope down only in the short
run, with index effects dissipating in the long run. This is consistent with the price pressure
hypothesis, according to which temporary effects are essentially due to index-related trading.
On the other hand, Scholes (1972), Shleifer (1986), Beneish and Whaley (1996), Lynch and
Mendenhall (1997), Kaul, Mehrotra, and Morck (2000), Wurgler and Zhuravskaya (2002),
and Blume and Edelen (2004) document permanent effects consistent with a long-term
contradicting to some extent the general notion that stock prices ensue from fundamental
asset valuation.
Ahern (2009a) puts forth two alternative explanations for why stocks exhibit downward
sloping demand curves. The first considers a setup with asymmetric information, in which
investors’ demand for a stock becomes less sensitive to price movements if the available
information is poor (Grossman and Stiglitz, 1980). The second story is in line with Harris
and Raviv’s (1993) model of investors with heterogeneous beliefs. If investors form different
opinions about the value of a stock given common information, their reservation values must
then differ and, at the aggregate level, demand curves for stocks should slope down. The
second explanation is more plausible in the context of FTSE 100 index revisions. The index
constituents are among the largest firms in the UK and hence it is hard to argue that the
available information is poor.
Index revision also affects liquidity. The change in equity ownership composition due
to index trading alters the proportion of liquidity-motivated trades as well as the degree of
competition among informed traders (Kyle, 1985). Accordingly, liquidity should increase
for stocks that enter the index and decrease for stocks that exit the index. This impact in
liquidity explains, at least partially, price responses to index revisions (Beneish and Whaley,
1996; Erwin and Miller, 1998; Hegde and McDermott, 2003; Gregoriou and Ioannidis, 2006;
Chordia, 2008). For instance, if the inclusion of a stock in the index leads to a lower
bid-ask spread, stock prices should rise in a permanent fashion (Amihud and Mendelson, 1986;
Brennan and Subrahmanyam, 1996). The same applies to variations in trading volumes and
quoted depths (Stoll, 1972). As they increase, there is a significant reduction in the direct
cost of trading. Moreover, the information gap between informed and uninformed traders
also shrinks, lowering the asymmetric costs of trading (Kim and Verecchia, 1994).
This paper contributes to this literature by carrying out an event study that explicitly
controls for anticipatory effects and hence for selection bias. Additions and deletions do not
occur to random stocks, unfolding respectively because of relative increases and decreases in
market value within the previous quarter. Given that the number of shares outstanding is
Stocks with relatively high price increases (decreases) in the previous quarter are more
likely to get into (exit, respectively) the FTSE 100 index. Standard event study analyses
completely ignore this selection issue and hence presumably overestimate price and volume
effects.1
We account for anticipatory trading effects by means of a two-step panel-regression
procedure. In the first step, we run panel probit regressions for each day in the pre-event
window in order to estimate the conditional probability of a given stock to enter or leave
the index in the next quarter. We thus end up with addition probability estimates for
non-index stocks as well as with deletion probability estimates for the non-index constituents for
each event day. In the second step, apart from the standard dummy variables for
pre-and post-announcement days, we also include addition/deletion probability estimates in the
panel-regression event analysis. The probit estimates adjusts the event study for anticipative
trading, whereas the coefficients of the dummy variables entail selection-adjusted estimates
for the pre- and post-announcement effects. Our approach is to some extent similar in spirit
to Heckman’s (1976, 1979) two-part estimation procedure to correct for sample selection.
The first step is indeed virtually identical. The only difference is that we have to run one
probit model for each day within the pre-event window so as to cope with the time-varying
uncertainty over index membership.
We unveil strong evidence in favor of a downward sloping demand curve even after
controlling for the fact that investors can partly predict index revisions. The impact of index
membership is not only strong, but also highly asymmetric. This is the only result we share
in common with Chen, Noronha, and Singal (2004). In stark contrast to their findings, we
show not only that the impact of index exclusions is much stronger than the effect of index
additions, but also that there is no evidence of price reversals after the announcement. As
in Lynch and Mendenhall (1997), we find that index revision commands a price impact
that does not seem to revert even after 22 days of the event. In particular, the cumulative
abnormal return (CAR) is of 13.34% for additions and -24.27% for deletions in the
pre-1
event window, whereas they are respectively 2.20% and -6.97% in the post-announcement
window. However, once we control for anticipatory trading, the pre-announcement CAR
decreases to 7.94% for additions and -18.66% for deletions, amounting to 40% and 23%
reductions, respectively.
A liquidity-based explanation for the price impact of index revisions also does not seem
to fit well in the context of the FTSE 100 index. A similar event analysis for volume
uncovers a strong increase in the liquidity of the stocks that either enter or exit the index,
even if one controls for anticipative trading. This is in stark contrast with previous results,
such as Hegde and McDermott (2003), though the differences are partly due to the shorter
post-event window we employ in our analysis. Given that deletion claims a much higher
price impact, it is difficult to argue that the abnormal performance of stocks joining the
index is partly due to the rise in liquidity. Further analysis is obviously in need given that
volume is just one of the many dimensions of liquidity and hence it would be interesting to
see what happens, for instance, with market depth and the bid-ask spread.
Although we are the first to propose a methodology that explicitly accounts for
antici-patory effects, there are a few papers that raise similar concerns (see, among others, Denis,
McConnell, Ovtchinnikov, and Yu, 2003; Mase, 2007). The usual fix is to employ post-event
data for the estimation of the market model so as to alleviate the dependence between
ad-ditions/deletions and the parameter estimates. However, it is virtually impossible to have
a decent sample size within a post-event estimation window that does not feature
contam-ination from the next quarter’s index revision. Mase (2007) also examines whether traders
attempt to anticipate these announcement effects by looking at nearly in/out stocks. These
stocks display significant anticipatory trading, though post-announcement effects revert the
pre-announcement returns almost exactly. In addition, taking their difference with respect
to the truly added/deleted stocks as a measure of the selection-adjusted impact reflects
a pointwise reduction of about 47% of the pre-announcement effects for additions and of
17.5% for deletions. Although we do not observe price reversals as in Mase (2007), our
estimates of the anticipatory effects are of similar magnitude.
revi-sions. We thus ask whether it is possible to take advantage of these effects by means of a
trading strategy. This is a very important question for a number of reasons. First, it is
very difficult to pin down statistical significance of the anticipatory effects given that we
focus on their impact on those very few stocks that are really likely to enter/exit the FTSE
100 index (rather than the usual average effect). Investigating their economic significance
thus becomes even more important. In addition, examining the performance of a trading
strategy requires a truly out-of-sample exercise as opposed to the purely in-sample event
study. Finally, it is obviously interesting to understand per se whether it is profitable to
exploit this index revision anomaly.
We first examine a very simple strategy in which we take a long position on the two
stocks most likely to join the index and a short position on the two stocks with the highest
chance to drop from the index in the next revision. After the announcement, we simply
buy the additions, if any, and short the deletions, if any. Although this strategy seems to
outperform the FTSE 100 index in the 2000s, it has two shortcomings. First, the turnover
is very high and hence the profits evaporate once we control for transaction costs. Second,
it turns out that most of the profits come from the short positions in periods of bearish
markets. We thus modify the trading strategy slightly so as to circumvent these drawbacks.
To alleviate the high turnover, we smooth the addition/deletion probability estimates at
time t that we extract from the probit models by taking their average over the last three
days. Smoothing makes the probability rankings more persistent and hence reduces the
need for rebalancing the portfolio. In addition, to deal with the dependence of the short
portfolio returns on the market cycle, we start taking short positions on the most likely
stocks to exit the index only if the past 22-day return on the FTSE 100 index is negative.
The resulting strategy performs extremely well, outclassing a passive strategy that buys and
hold the FTSE 100 index even after controlling for transaction costs in a very conservative
manner.
The remainder of this paper ensues as follows. Section 2 provides some institutional
background concerning the FTSE 100 index revision. Section 3 describes the event-study
and then reports the findings of the event study analysis. Section 4 shows how to build a
trading strategy that takes advantage of the cumulative abnormal returns we uncover in
the event study, whereas Section 5 offers some concluding remarks.
2
Eligibility and membership to the FTSE 100 index
The FTSE Europe/Middle East/Africa Regional committee meets quarterly to review the
compositions of the family of FTSE indices. This happens on the Wednesday after the
first Friday in March, June, September and December. There is a public announcement of
the revisions in the index memberships right after the meeting, even if the actual revision
occurs only on the next trading day following the expiry of the LIFFE futures and options
contracts. The latter normally takes place on the third Friday of the same month.
The FTSE 100 index consists of the largest 100 eligible companies in the UK, measured
by market capitalization value. Only premium listed equity shares that trades on the
London Stock Exchange are eligible for inclusion in the FTSE 100 index. Other eligibility
criteria include price, size and liquidity aspects, including the following among others:
(a) The stock share must have a Sterling-denominated price that is accurate and reliable
enough for the determination of the market value of the company.
(b) The company must have a free-float of at least 50% after adjusting for restrictions and
cross-holdings.
(c) Securities must have a turnover of at least 0.035% of their shares in issue as measured
by the median daily trade per month for at least 10 out of the 12 months prior to the
annual index review in June. This threshold falls to 0.025% for at least 8 months in
the case of index constituents.
The rules for adding and deleting securities are designed to provide stability in the
selection of constituents of the FTSE family of indices. At the quarterly reviews, a given
stock will join the FTSE 100 index if its market value ranking rises to the 90th position or
above among the eligible stocks, whereas a constituent will exit the index if its market value
rises or falls in market capitalization and thus market representativeness.
Given that the number of constituents is constant for the FTSE 100 index, there are
special rules for situations of imbalance between the number of additions and deletions. If
a greater number of companies qualify to join the index relative to those qualifying to exit
the index, the lowest ranking constituents will also exit the index to equate the number
of additions and deletions. Likewise, if there are more deletions than additions, the FTSE
committee will insert the securities of the highest ranking companies that are currently not
in the index so as to match the total number of deletions.2
Before moving to the event study analysis, it is important to stress once again that
these rules are objective. They leave no discretionary power to the committee. This is
very convenient because it rules out a situation in which index membership says something
about the stock’s future prospects.
3
Sample description and methodology
We consider changes in the index from June 1992 to March 2010. We exclude from the
sample all unscheduled changes due to corporate action, such as mergers and acquisitions,
yielding a total of 138 additions and 146 deletions. To estimate probit models for the
addition probabilities within the pre-announcement window, we also include eligible stocks
that are out of the index in the sample. To ensure that the samples for computing addition
and deletion probabilities have similar sizes, we attempt to consider in the overall sample
the largest 200 firms in the UK as measured by market capitalization. We use the largest
eligible stocks in the London Stock Exchange that are not part of the FTSE 100 index in the
estimation of the probit models for additions and the index constituents in the estimation
of the probit models for deletions. Retrieving a complete data set from Thomson Reuters
Datastream is not straightforward, though. We first have to control for stock splits when
computing returns, volume rate, and market values. Moreover, the panel is unbalanced not
only because of the variations in the market value, but also because of delistings, mergers
and acquisitions. The latter events make it particularly difficult to keep the balance between
2
the number of stocks in and out of the index.
(A) (B)
(C) (D)
(E) (F)
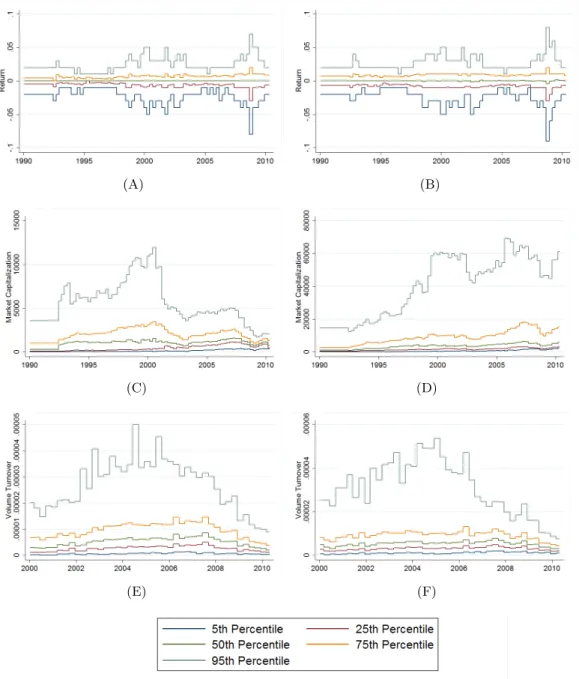
Figure 1: Distributional features of the addition and deletion subsamples
We plot the time series of the 5th, 25th, 50th, 75th and 95th quantiles of the daily returns, market capitalization and volume rate for the addition and deletion subsamples. Panels (A), (C) and (E) refer to the addition subsample, whereas Panels (B), (D) and (F) relate to the deletions sample.
Figure 1 depicts some key quantiles for the returns, market capitalizations, and volume
turnovers in both subsamples over time. Stock returns show a similar behavior in both
subsamples for the median and the extreme quantiles. The former is always very close to
periods of market uncertainty. In contrast, the interquartile range is clearly higher for
the addition subsample, reflecting the fact that smaller caps are typically riskier. Not
surprisingly, market capitalization is much lower for stocks out of the index than for index
constituents. There is also a big difference in market value between the lower and upper
tails within both subsamples. As per the time-series dimension, it is interesting to observe
that the recent credit crunch has a much stronger impact on the smaller caps, even relative
to the previous financial crises. Finally, the last panel plots the distribution of the volume
rate since January 2000. It is striking how liquidity decreases substantially throughout the
recent credit crunch. It is worth noting that liquidity falls proportionally more for the most
liquid stocks.
3.1 Regression-based event analysis
For the traditional event study, we employ a panel regression model with unit market beta
for every stock and individual fixed effects. We include the latter to let at least alpha
vary freely across stocks. As the committee meets every quarter to announce the index
revisions, the event window ranges from 44 days before the announcement to 22 days after
the announcement, with τ = 0 denoting the day of the committee meeting. This ensures
that the post-event window after any committee meeting does not overlap with the
pre-event window of the next revision announcement. We then regress the excess returns on
the individual stocks over the FTSE 100 index on dummy variables for pre- and post-event
days (Dτ,t for τ = −44, . . . ,22) as well as to addition/deletion dummy variables for each
day within the event window:
Ri,t−RM,t=αi+ 22 X
τ=−44
γτDτ,t+ 22 X
τ=−44
γτADAi,τ,t+ 22 X
τ=−44
γτDDi,τ,tD +ei,t (1)
where Di,τ,tA and DDi,τ,t with τ = −44, . . . ,22 are equal to Dτ,t if stock i respectively
en-ters/exits the index at τ = 0, zero otherwise. The addition/deletion dummy coefficients
reflect the average abnormal return for every event time τ, e.g., γτA denotes the average
abnormal return at calendar daytacross stocks that join the index at timet−τ. To obtain
cumulative abnormal returns (CAR) fromτ1 andτ2(−44< τ1< τ2<22), it suffices to sum
up the corresponding dummy coefficients, namely, Pτ2
τ=τ1γ
A
τ for additions and Pτ2
τ=τ1γ
for deletions.
Next, we propose a two-stage procedure to account for anticipatory trading effects. The
idea is similar to the Heckit method for correcting sampling selectivity (Heckman, 1976;
1979). We initially estimate a probit model for each day in the pre-event window to back
out the conditional probability of a given stock to change its membership status in the next
FTSE committee meeting. This results in addition probability estimates for the sample of
stocks that are not in the index as well as deletion probability estimates for the sample of
index constituents.
In the second pass, we merge the two subsamples to run the regression-based event
study analysis. By construction, constituents have zero probability of joining the index,
whereas stocks that are not in the index have zero probability of exiting the index. Apart
from the standard dummy variables for pre- and post-announcement days, we then include
addition/deletion probability estimates in the panel regression, yielding
Ri,t−RM,t=αi+ 22 X
τ=−44
γτDτ,t+ 22 X
τ=−44
γτADi,τ,tA + 22 X
τ=−44
γτDDDi,τ,t
+ −1 X
τ=−44
λAτ πi,τ,tA + −1 X
τ=−44
λDτ πDi,τ,t+ui,t (2)
withπi,τ,tA andπDi,τ,tdenoting the probability at timetthat stockiwill respectively join/exit
the index in the next index composition review at time t−τ. The idea is essentially
that the probability estimates will capture the anticipative trading effects, whereas the
coefficients of the dummy variables will entail selection-adjusted estimates for the pre- and
post-announcement effects.
The average anticipatory effect is given byλAτ π¯Aτ for additions andλDτ ¯πDτ for deletions at
any date prior to the meeting (i.e.,τ <0). Note that we must average the addition/deletion
probability estimates both across stocks and over the calendar time. To obtain cumulative
average effects fromτ1 andτ2(−44< τ1< τ2<−1), one must then sum up the
correspond-ing average impacts, namely, Pτ2
τ=τ1λ
A
τ π¯τA for additions and Pτ2
τ=τ1λ
D
τ π¯τD for deletions.
The interpretation of these average effects (cumulative or not) is a bit tricky, however. The
addition/deletion subsamples include many stocks that are very unlikely to move into/out
anticipatory trading effects. Instead, it seems much more sensible to assess the latter by
evaluating the addition/deletion probabilities only for the few stocks that are most likely
to change their membership status.
Our methodology also resembles the antitrust analysis of mergers based on McGuckin,
Warren-Boulter, and Waldstein (1992) event-probability case study procedure. The goal
of their event-probability approach is to analyze the effect of merger announcements on
stock returns of rival firms using a regression in calendar time. McGuckin, Warren-Boulter,
and Waldstein replace the usual event-window dummy in the standard market model with
the change in the probability that the merger will indeed take place. They interpret the
corresponding coefficient as the change in the value of the rival firm in case the merger
happens. Their framework differs from ours in several aspects. First, we include both the
event-window dummy variables and the revision probabilities as regressors in the market
model for returns. By adding the addition/deletion probability estimates to the event study
we aim to account for anticipatory effects. We keep the pre-event dummy variables in the
specification so as to capture the price runs (either up or down) that lead to the change in the
index membership status. Second, they show that the return to a rival firm depends on the
change in the merger probability, so that one is back to the standard market model if there
is no change in information about the merger likelihood. In the context of additions and
deletions, what matters for the investors is the stocks with the highest probability to change
their membership status. That is why we add the probability levels rather than their first
differences into the specification. Third, whereas we run probit regressions to obtain the
addition/deletion probability estimates, McGuckin, Warren-Boulter, and Waldstein back
out the merger probability using a valuation technique that relies on the estimation of the
standard market model for a sample period prior to the event window.
3.2 Probit specification for additions and deletions
To determine the potential regressors for the probit specifications, we build on the FTSE
rules of index revision. We thus rank the stocks in our sample every day by their total
market value and then compute the difference in market capitalization relative to the firms
binary variables indicating whether the above differences in market value are positive or
not. We also consider the current ranking and market value as well as the change in
the ranking position since the last committee meeting. The latter is useful because it
conveys information on whether the stock has been experiencing a price run relative to the
eligible stocks since the last index membership review, thereof controlling to some extent
for momentum.
For each day in the pre-event window (τ =−44, . . . ,−1), we then estimate the
probabil-ity of a stock to enter the index as well as of a constituent to exit the index using a stepwise
regression approach. The latter involves adding and/or deleting variables sequentially
de-pending on their F-statistics. The advantage is that it ensures parsimonious probit models
for every day within the pre-announcement window. The drawback is that statistical
infer-ence becomes nonstandard because of the sequentiality of the F-tests. The problem is that
we could end up with probit models that fit the data well only within the sample period.
We have two reasons to believe that the benefits outweigh the limitations of the stepwise
regression approach in our case. First, the in-sample estimates of the anticipatory effects
are in line with previous results by Mase (2007) and hence they do not appear to be an
artifact due to data mining. Second, the trading strategy analysis we carry out in Section 5
replicates out of sample the performance of the stepwise regression. See Hocking (1976) for
more details on statistical inference within stepwise regressions and, among others, Baker
and Haslem (1974), Jobson and Korkie (1983), Fung and Hsieh (2000) and Agarwal and
Naik (2004) for applications in finance.
4
FTSE 100 index revision impact and anticipatory effects
We start with the classical event study. Figure 2 plots the cumulative abnormal returns for
additions and deletions in the pre- and post-announcement windows. Panel A displays the
pre-announcement price impact of the additions, as measured by the cumulative abnormal
return (CAR) from τ1 = −44 up to τ2 = 0, and their 95% confidence interval based on
over the 45 trading days prior to the FTSE committee meeting.3 Panel B reveals that the
post-announcement CAR fromτ1= 1 to τ2 = 22 is much smaller, even if one considers the
difference in the length of the time interval. The 95% confidence interval reveals that the
CAR is borderline significative over the 22 days after the committee review. Nevertheless,
what really matters is that we find no evidence of price reversal in the post-event window.
Panels C and D document similar patterns for deletions. The CAR over the 44 days prior
to the announcement is of about -24.27%, whereas it is of -6.97% in the post-event window.
This implies that the price impact of exiting the index is much stronger than the price
impact of joining the index. As before, there is no evidence of price reversals. Altogether,
these preliminary results indicate that the impact of changing index membership status is
permanent.
(A) (B)
(C) (D)
Figure 2: Average cumulative abnormal returns
We depict the average cumulative abnormal returns for changes in the index composition from 44 days before to 22 days after the FTSE committee announcements based on the traditional event-study regression. Panels (A) and (B) refer to the pre- and post-event cumulative abnormal performance for stocks joining the index, whereas Panels (C) and (D) relate to corresponding figures for stocks that exit the index.
3
Table 1
Descriptive statistics for the addition/deletion probability estimates
Apart from the mean, median, standard deviation and skewness of the probit estimates at different pre-event days, we report the first and third quartiles as well as the upper tail percentiles of their distribution.
percentile standard probability
25% 50% 75% 90% 95% 99%
mean
deviation
skewness
addition
τ=−1 1.57E-31 1.10E-03 0.021 0.083 0.16 0.51 0.03 0.09 5.83 τ=−5 7.96E-31 1.56E-23 3.59E-13 0.023 0.06 0.21 0.01 0.05 10.04 τ=−10 3.42E-08 3.33E-06 2.23E-04 0.017 0.04 0.15 0.01 0.04 12.18 τ=−20 2.06E-05 1.31E-04 7.23E-04 0.018 0.04 0.14 0.01 0.04 12.36 τ=−30 3.80E-05 2.47E-04 1.20E-03 0.019 0.05 0.15 0.01 0.04 10.91 τ=−40 8.77E-06 2.02E-04 2.34E-03 0.019 0.05 0.14 0.01 0.03 10.66 deletion
τ=−1 8.60E-07 6.53E-05 1.61E-03 0.037 0.09 0.38 0.02 0.08 7.76 τ=−5 7.81E-06 1.73E-04 1.22E-03 0.037 0.10 0.37 0.02 0.08 7.53 τ=−10 7.87E-07 7.87E-05 8.20E-04 0.050 0.12 0.33 0.02 0.07 7.39 τ=−20 1.75E-04 9.94E-04 4.00E-03 0.057 0.12 0.30 0.02 0.07 7.57 τ=−30 5.73E-04 3.64E-03 0.010 0.062 0.12 0.29 0.02 0.06 6.92 τ=−40 4.85E-04 5.23E-03 0.014 0.068 0.11 0.23 0.02 0.05 7.68
We next examine what happens with the cumulative abnormal returns if we control for
the probability of changing the index membership status as in (2). We start with a brief
discussion about the probit estimates we obtain for the likelihood of either joining or exiting
the FTSE 100 index. The stepwise regression approach we employ to automatically select
the variables that drive the addition/deletion likelihoods seems to work pretty well. The
resulting probit models are not only parsimonious and congruent, but also very sensible as
what concerns the choice of regressors over the different pre-event dates (and their signs).
The main drivers are the current ranking, the variation in the ranking since the last meeting,
and the dummy variables indicating whether the current position is above 80th, 90th and
110th. The differences in market value relative to the firms at the 90th and 110th positions
are also significant for the majority of the pre-event days. As expected, the predictive power
of the probit models, as measured by the pseudoR2 measure, increases linearly from about
25%-30% to 50% as the announcement date approaches.4
Table 1 reports some descriptive statistics for the probit estimates at different pre-event
dates. The distributions are actually very similar in that the most pronounced feature is
4
clearly the asymmetry. Both the mean and median probit estimates are about 1% for the
additions and 2% for deletions regardless of how close we are to the announcement. This
happens because only a few stocks within each subsample have real chances to join/exit
the index. In fact, the probit estimates remain quite low up to the 90% percentile. It is
striking how the not-so-large values of the 99% percentile are still about threefold the values
of the 95% percentile. It is also interesting to observe that deletions are more predictable
than additions in that their probit estimates are much larger for most days in the pre-event
window. As expected, as the announcement approaches, the probit estimates become more
divergent across stocks and hence the standard deviation increases. The skewness coefficient
is nonetheless quite stable within the pre-event window, around 7 for deletions and slightly
above 10 for additions (except to one day before the announcement).
(A) (B)
(C) (D)
We now turn our attention to the results of the event study after the inclusion of the
probit estimates into the regression. Figure 3 shows that a large proportion of the ex-ante
price impact of additions and deletions is actually due to anticipatory trading. The
pre-announcement CAR now amounts only to 7.94% for additions and to -18.66% for deletions.
This means that anticipatory trading effects respond for respectively 40% and 23% of the
price impact for additions and deletions. It is also apparent from Panels B and D that, as
expected, adding the addition/deletion probability estimates into the event-study regression
has virtually no effect in the CAR over the post-announcement window. We thus conclude
that index revisions entail a significant price impact in the stocks that either join or exit the
FTSE 100 index despite controlling for anticipative trading. Even if most of the response
takes place prior to the FTSE committee review, we are unable to uncover any price reversal
in the post-announcement window for both additions and deletions.
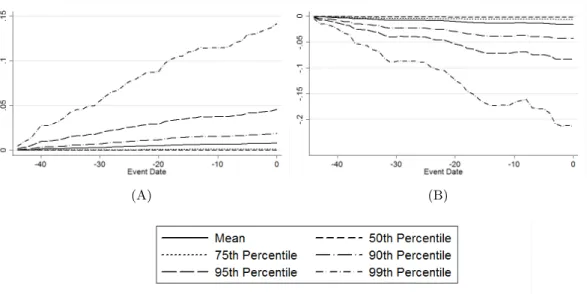
(A) (B)
Figure 4: Cumulative anticipatory effects
We plot the cumulative anticipatory trading effects at different percentiles of the addi-tion/deletion probability estimates in the pre-event window. Panel (A) refers to the impact of anticipative trading for the addition subsample, whereas Panel (B) illustrates the corre-sponding impact for the deletion subsample.
To better understand the impact of anticipatory trading, Figure 4 depicts how it varies
with the percentile of the addition/deletion probability estimates. Panels A and B display
very similar patterns. The average repercussion is quite close to zero for both additions and
the median and third quartile of the probit estimates. The impact becomes more material
if we employ the 95% percentile, yielding a cumulative effect of 4.61% for additions and
of -8.37% for deletions. As we move to the 99% percentile, the impact of anticipatory
trading on returns becomes very large, namely, about 14.18% for additions and -21.31%
for deletions. Given that the FTSE committee reviews normally change the membership
status of at most 6 stocks (i.e., 3 additions and 3 deletions), it makes much more sense to
assess the anticipatory trading effects by looking at the 95% and 99% percentiles than at
the mean/median values.
The results so far indicate that index inclusions and exclusions entail significant wealth
effects even after 22 days of the announcement. As in Chen, Noronha, and Singal (2004),
we find that the price impact of a revision in the index composition is asymmetric. Perhaps
surprisingly given previous results in the literature, we document that the CAR on deletions
is much larger in magnitude than the CAR on additions. Given that the FTSE 100 index
constituents are very large firms in the UK, attributing these wealth effects either to better
monitoring or to changes in investor awareness is not very convincing. The certification
hypothesis also does not hold much water because the FTSE index revision rules are 100%
objective. In addition, there is little price pressure in that most index-tracking funds in
the UK focus on the FTSE All-Share index. Before concluding that stocks have downward
sloping demand curves, it remains to check whether liquidity effects could also explain
the market reaction to the FTSE 100 index additions and deletions. The next subsection
examines this possibility.
4.1 Impact on market liquidity
To better understand what happens with market liquidity around the dates of the FTSE
committee reviews, we carry out a further event analysis using the volume rate as the
dependent variable. We measure the volume rate (or turnover) of a given stock by the ratio
of the number of traded shares to the number of outstanding shares. As before, we start
with a standard regression-based event study based on
VRi,t =αV,i+βVVOftse,t+ 22 X
τ=−44
γV,τDτ,t+ 22 X
τ=−44
γV,τA Di,τ,tA + 22 X
τ=−44
where VRi,t denotes the logit of the volume rate (or turnover) of theith stock time tand
VOftse,t is the total number of shares traded within the index at time t. We find that
the impact in market liquidity is quite asymmetric in that volume increases much more
for deletions than for additions, especially prior to the announcement. In particular, the
cumulative abnormal logit of the volume turnover is about 7.70 for additions within the
pre-event window, whereas it amounts to 18.74 for deletions. The asymmetry subsides
considerably within the post-event window, with cumulative logit effects of about 5.96 and
7.15 for additions and deletions, respectively.5
To control for anticipative trading effects in the market liquidity, we consider a second
specification in which we include the addition/deletion probability estimates:
VRi,t =αV,i+βVVOftse,t+ 22 X
τ=−44
γV,τDτ,t+ 22 X
τ=−44
γV,τA DAi,τ,t+ 22 X
τ=−44
γV,τD DDi,τ,t
+ −1 X
τ=−44
λAV,τπV,i,τ,tA + −1 X
τ=−44
λDV,τπV,i,τ,tD +uV,i,t. (4)
We then gauge the cumulative abnormal volume rate fromτ1 and τ2 (−44< τ1 < τ2 <22)
by summing up the corresponding dummy coefficients, viz., Pτ2
τ=τ1γ
A
V,τ for additions and Pτ2
τ=τ1γ
D
V,τ for deletions. In turn, the cumulative average anticipatory effect from τ1 and
τ2, with −44< τ1< τ2<−1, is given by Pτ2
τ=τ1λ
A
V,τπ¯V,τA and Pτ2
τ=τ1λ
D
V,τπ¯DV,τ, respectively.
As before, it is perhaps more informative to consider anticipatory trading quantile effects
so as to focus on the few stocks that are most likely to change their membership status.
Figure 5 reveals that liquidity, as measured by the volume rate, increases for both
additions and deletions even after we correct for anticipatory trading. As before, the
pre-event impact is massively asymmetric with cumulative logit effects of 6.94 for additions and
17.10 for deletions, whereas the post-announcement effects are more similar (viz., 6.17 for
additions and 7.34 for deletions). Relative to the estimates we obtain without adjusting
for anticipatory effects, we observe a reduction of about 10% in the pre-announcement
cumulative logit effect as well as a slight increase of about 3% in the post-event impact on
the logit of the volume rate. The evidence of liquidity increase we uncover is pretty robust.
5
(A) (B)
(C) (D)
(E) (F)
Figure 5: Cumulative abnormal volume rates and anticipatory trading effects
First, we find similar results if we proxy liquidity by the bid-ask spread. It decreases for
both additions and deletions, though significantly only for the latter. Second, the ex-ante
increase in liquidity becomes insignificant for both addition and deletions if we also control
for the market capitalization of the stocks. For the sake of brevity, we do not report these
results, though they are obviously available from the authors upon request.
The boost in the volume rate for stocks that enter the index is consistent with the
liquidity-based explanation for cumulative abnormal returns for additions. However, this
is only the half of the story. Stoll (1972) and Kyle (1985) predict that liquidity and, in
particular, volume and market depth should decrease for stocks that exit the index given that tracking funds will not trade them anymore. The fact that the volume rate grows for
deletions does not bode well for their liquidity theory. In fact, it is also the case that most
index funds in the UK track the FTSE All-Share index and hence it is hard to believe that
portfolio rebalancing due to index trading answers for such sizeable changes in liquidity.
In addition, alternative liquidity-based explanations based on trading costs (Amihud and
Mendelson, 1986; Kim and Verecchia, 1994; Brennan and Subrahmanyam, 1996) do not
seem to fit the data as well. Increases in the volume rate should bring about a hike in stock
prices due to the lower costs of trading. In contrast, the cumulative abnormal returns and
volume rates have opposite signs for stocks that exit the index.
We thus conclude that the wealth effects we observe for deletions are not consistent
with liquidity effects and hence the cumulative abnormal performances we uncover for both
additions and deletions are most likely due to downward sloping demand curves.
5
Taking advantage of the addition/deletion price impacts
Our sample results identify substantial wealth effects for changes in the FTSE 100
in-dex composition. Accounting for anticipatory trading effects reduce, but do not eliminate
them. It rests to see whether these results remain significant out of sample. In what follows,
we develop a simple trading strategy that attempts not only to anticipate additions and
deletions to and from the FTSE 100 index before the committee reviews, but also to
trading strategy from January 2000 to March 2010 using rolling estimation samples that
span three years of data. The first step is to re-estimate the probit models using lagged
explanatory variables. Given that market values are somewhat persistent, the hope is that
replacing contemporaneous with lagged regressors will not affect too much the predictive
ability of the probit models. As before, we employ a stepwise approach to select the set of
explanatory variables we will use for each day within the pre-event window.
The next step is to define how to take benefit from the addition/deletion probit
esti-mates. We start with a very simple trading strategy. Prior to the announcement date, we
take long positions in the two stocks most likely to join the index and short the two stocks
with the highest deletion likelihoods. After the announcement, if necessary, we rebalance
the portfolio so as to hold long positions in every stocks that moves into the index and short
positions in all stocks that drop from the index. Preliminary results show that this very
simple strategy outperforms the FTSE 100 index in the 2000s. There are three caveats,
though. First, this is a period of bearish markets in the UK and so it does not take much
to beat the FTSE 100 index. Second, the excess returns over the FTSE 100 index depend
heavily on the short positions, which obviously perform particularly well in bearish
mar-kets. Third, the turnover of the strategy is too high due to the wide variation in the early
rankings of the addition/deletion probit estimates. As a result, transaction costs eat away
and ultimately eliminate the excess return over the buy-and-hold passive strategy.
To come around these shortcomings, we consider two adjustments to the above
antici-patory trading strategy. We attempt to scale down the portfolio turnover by smoothing the
addition/deletion probability estimates. In particular, we employ a three-day moving
aver-age of the addition/deletion probit estimates. The motivation is to increase the persistence
in the probability rankings so as to lessen the rebalancing needs. Moreover, we also exploit
the dependence of the short portfolio returns on the market cycle by shorting only if the
past 22-day return on the FTSE 100 index is negative. More precisely, the trading strategy
works as follows. We start with 100 in a cash account. At time τ =−30, we purchase the
two stocks with most likely to join the index, as measured by the smoothed probit estimates
the same amount on the two stocks with highest smoothed probabilities of moving out the
index. The criteria are the same for every date in the pre-event window. We rebalance
our portfolio every day there is a change in the first two positions of the addition/deletion
probability rankings, always reinvesting the proceedings. Note that we also close the short
positions if the 22-day FTSE 100 index return becomes positive, cashing in/out the
pro-ceedings. After the announcement, in the absence of uncertainty, we simply purchase the
additions and short the deletions. We cash in the long positions after 15 days (i.e.,τ = 15),
whereas we close the short positions after at most 25 days (i.e., τ = 25). We revert all
proceedings to the cash account and then wait for the next round of trading around the
following committee review. Finally, in the absence of better measures of trading costs, we
discount either 10, 20 or 30 basis points of every transaction we make. Given that we are
dealing with stocks from large UK firms, we believe that the above costs are quite on the
conservative side.
Figure 6 shows that the resulting strategy performs very well, achieving a much higher
cumulative return than simply buying and holding passively the FTSE 100 index. The
turnover is much lower and, as such, the performance is much more robust to transaction
costs. Indeed, excess returns over the FTSE 100 index are significantly positive even
as-suming very conservative costs of trading. Interestingly, it turns out that every component
of the adjusted trading strategy yields positive excess return. Given that we trade only
around FTSE committee review, there are many instances in which we have only cash in
the portfolio, entailing a zero return.6 The peaks in the long and short portfolios within
the pre-event window are thicker than the ones in the post-announcement window due to
the difference in their lengths.
Table 2 summarizes the main distributional features of the returns on the trading
strat-egy. For the sake of comparison, we also report the corresponding statistics for the excess
return over the FTSE 100 index as well as for the returns on the latter. The average return
of our trading strategy is threefold the average return of the passive strategy. The standard
6
Figure 6: Performance of the anticipatory trading strategy
The first two plots respectively display the cumulative returns to the portfolios that trade on the pre-event addition and deletion probit estimates from January 2000 to March 2010. The third and fourth plots depict the performance of the portfolios that trade on the the effective additions and deletions, respectively. The last plot gives the cumulative return on the overall portfolio considering different trading costs (viz., 10, 20 and 30 bps) as well as the cumulative return to a passive strategy that buys and holds the FTSE 100 index.
deviation is also higher due to the fact that there is not much diversification going on.
Interestingly, although there is a large positive difference between the maxima of the active
and passive strategies, the difference between their third quartile is negative. Apart from
trading strategy also lead to a very large positive skewness and excess kurtosis. In contrast,
the distribution of the FTSE 100 index returns is much more symmetric, even if it exhibits
some excess kurtosis. The Box plots in Figure 7 manifest this difference in the degrees of
Table 2
Performance of the anticipative trading strategy
Apart from the mean, standard deviation, skewness and kurtosis of the annualized returns on the anticipative trading strategy and on the FTSE 100 index, we also report the minimum, first quartile, median, third quartile, and maximum values of the daily returns. We consider a transaction cost of 20 basis points. In addition, we also relay the corresponding figures for the excess returns of the anticipative trading strategy over the the FTSE 100 index. Lastly, we compute some annualized performance and risk measures for the active trading strategy, namely, market beta, Jensen’s alpha, appraisal ratio, Sharpe ratio, and Sortino ratio.
FTSE 100 index trading strategy excess return
all open all open all open
mean −0.0213 0.0710 0.3527 0.1924 0.2137 0.2818
semi-variance 0.0661 0.0350 0.0418 0.0418 0.0683 0.0471 standard deviation 0.3528 0.3637 0.4558 0.6172 0.5033 0.6073 skewness −0.0138 0.0247 0.7369 0.5417 0.4247 0.4327
kurtosis 3.0295 3.0384 3.9949 3.5363 0.4707 0.4008
minimum −0.1800 −0.1000 −0.2065 −0.2065 −0.2865 −0.2865
first quartile −0.0122 −0.0128 −0.0008 −0.0052 −0.0108 −0.0107
median 0.0000 0.0008 0.0000 −0.0002 −0.0004 −0.0001
third quartile 0.0126 0.0139 0.0006 0.0053 0.0099 0.0090 maximum 0.1800 0.1800 0.7341 0.7341 0.6341 0.6341
beta 1 1 0.3168 0.5457
alpha 0 0 0.2008 0.3140
appraisal ratio 0 0 0.4245 0.4640
Sharpe ratio
Table 2 also reports some risk and performance measures. In particular, the anticipative
trading strategy entails a market beta of 0.5498, showing that it has much less systematic
risk despite the higher standard deviation. As for the performance measures, the annualized
Jensen’s alpha is pretty large at 45.89%, though it is only borderline significant at the 10%
level due to the high residual volatility. Treynor and Black’s (1973) appraisal ratio (or
information ratio), as measured by annualized alpha divided by the annualized residual
volatility in the CAPM regression, is of 56.47%. This is very close to Grinold and Kahn’s
(1999) out-of-sample estimate of the third quartile of the appraisal ratio of the after-fee
data on active equity mutual funds in the US. The Sharpe ratio of the active strategy is
almost threefold the one of the FTSE 100 index despite the higher standard deviation. Note
that the Sharpe ratio is actually a very conservative performance measure of our anticipative
trading strategy if one considers its very large positive skewness. For instance, the difference
in the Sortino measures, which standardize the average returns by the semi-variance (rather
than the standard deviation), is indeed even more extreme.
It is perhaps difficult to assess the statistical significance of the cumulative abnormal
returns and anticipative effects for the changes in the FTSE 100 index composition.
How-ever, the above out-of-sample analysis manifest their economic relevance given the excellent
performance that we observe for our anticipative trading strategy.
6
Conclusion
We show that additions and deletions to and from the FTSE 100 index command significant
wealth effects from 44 days before to 22 days after the committee review meetings. Most
of the impact is within the pre-event window, with cumulative abnormal returns stabilizing
after the announcement. Anticipatory trading responds for a substantial part of these
effects, viz., 40% for additions and 23% for deletions. We thus develop a simple trading
strategy that attempts to anticipate the outcomes of the FTSE committee review so as to
take advantage of these cumulative abnormal returns. The out-of-sample analysis indicates
that such a trading strategy easily outperforms a passive strategy that tracks the FTSE
Figure 7: Distribution of the active and passive trading strategy returns
We characterize by means of Box plots the distribution of the returns and excess returns on the anticipative trading strategy over the passive strategy that simply buys and holds the FTSE 100 index from January 2000 to March 2010.
There are several explanations for addition/deletion effects in the literature. We deem
reasons. First, the FTSE index membership rules are completely objective and hence it
does not make much sense to speak about the certification hypothesis. Second, the FTSE
100 index constituents are very large firms in the UK. It is thus hard to sell that the
repercussion in stock prices stems from better monitoring in the future or from changes
in investor awareness. The latter is also not in line with the fact we find no evidence of
price reversal in the post-announcement window. Third, most of index-tracking funds in
the UK follow the FTSE All-Share index rather than the FTSE 100 index. This means
that passive portfolio rebalancing should not affect much FTSE 100 index revisions and
hence the price-pressure hypothesis does not hold much water. Fourth, the liquidity-based
explanation predicts that rises in the volume rate should lower transaction costs, therefore
increasing prices permanently. This is in stark contrast with what we observe for stocks
that exit the FTSE 100 index. Their stock prices actually go down in a very substantial
manner as their volume rate grows, especially in the pre-event window. It is important
to stress, however, that the volume rate is just one dimension of liquidity and hence one
should also look at other liquidity indicators, such as market depth and bid-ask spread,
before completely ruling out liquidity-based causes for these addition/deletion effects.
References
Agarwal, Vikas, and Narayan Y. Naik, 2004, Risks and portfolio decisions involving hedge funds, Review of Financial Studies 17, 63–68.
Ahern, Kenneth R., 2009a, Do common stocks have perfect substitutes?, working paper, University of Michigan.
Ahern, Kenneth R., 2009b, Sample selection and event study estimation, Journal of Em-pirical Finance 16, 466–482.
Amihud, Y., and H. Mendelson, 1986, Asset pricing and the bid-ask spread, Journal of Financial Economics 17, 223–249.
Baker, H. Kent, and John A. Haslem, 1974, Toward the development of client-specified valuation models,Journal of Finance 29, 1255–1263.
Beneish, M. D., and R. E. Whaley, 1996, An anatomy of the ‘S&P game’: The effects of changing the rules, Journal of Finance 51, 1909–1930.
Blume, M., and R. Edelen, 2004, On replicating the S&P 500 index, Journal of Portfolio
Management 30, 37–46.
Brealey, Richard A., 2000, Stock prices, stock indexes and index funds, Bank of England Quarterly Bulletin February, 61–68.
Brennan, Michael J., and A. Subrahmanyam, 1996, Market microstructure and asset pricing: On the compensation for illiquidity in stock returns,Journal of Financial Economics 41, 441–464.
Brown, Stephen J., William N. Goetzmann, and Stephen A. Ross, 1995, Survival,Journal of Finance 50, 853–873.
Chen, Honghui, Gregory Noronha, and Vijay Singal, 2004, The asymmetric price response to S&P 500 index additions and deletions: Evidence and explanation,Journal of Finance
59, 190l–1940.
Chordia, Tarun, 2008, Liquidity and returns: The impact of inclusion into the S&P 500 index, in Fran¸cois-Serge Lhabitant, andGreg N. Gregoriou, eds.: Stock Market Liquidity
(John Wiley and Sons, Hoboken, NJ ).
Copeland, Thomas E., and David Mayers, 1982, The valueline enigma (1965-1978): A case study of performance evaluation issues,Journal of Financial Economics 10, 289–321. Denis, D. K., J. J. McConnell, A. V. Ovtchinnikov, and Y. Yu, 2003, S&P additions and
earnings expectations, Journal of Finance 58, 1821–1840.
Dhillon, U., and H. Johnson, 1991, Changes in the Standard and Poor’s 500 list, Journal of Business 64, 75–85.
Dimson, E., and P. Marsh, 1986, Event study methodologies and the size effect: The case of UK press recomendations,Journal of Financial Economics 17, 113–142.
Erwin, G. R., and J. M. Miller, 1998, The liquidity effects associated with addition of a stock to the S&P 500 index: Evidence from bid/ask spreads,Financial Review 33, 131–146. Fung, William, and David A. Hsieh, 2000, Performance characteristics of hedge funds and
commodity funds: Natural vs. spurious biases, Journal of Financial and Quantitative Analysis 35, 291–307.
Gregoriou, Andros, and Christos Ioannidis, 2006, Information costs and liquidity effects from changes in the FTSE 100 list, European Journal of Finance 12, 347–360.
Grinold, Richard C., and Ronald N. Kahn, 1999,Active Portfolio Management. (McGraw-Hill, New York) 2nd edn.
Grossman, Sanford J., and Joseph E. Stiglitz, 1980, On the impossibility of informationally efficient markets, American Economic Review 70, 393–408.
Harris, L. E., and E. Gurel, 1986, Price and volume effects associated with changes in the S&P 500 list: New evidence for the existence of price pressures, Journal of Finance 41, 815–829.
Heckman, James, 1976, The common structure of statistical models of truncation, sample selection, and limited dependent variables and a simpler estimator of such models,Annals
of Economic and Social Measurement 5, 475–592.
Heckman, James, 1979, Sample selection bias as a specification error, Econometrica 47, 153–161.
Hegde, S., and J. B. McDermott, 2003, The liquidity effects of revisions to the S&P 500 index: An empirical analysis,Journal of Financial Markets 6, 413–459.
Hocking, R. R., 1976, The analysis and selection of variables in linear regression,Biometrics
32, 1–49.
Jain, P., 1987, The effect on stock price of inclusion in or exclusion from the S&P 500,
Financial Analysts Journal 43, 58–65.
Jobson, J. D., and Bob Korkie, 1983, Statistical inference in two-parameter portfolio theory with multiple regression software, Journal of Financial and Quantitative Analysis 18, 189–197.
Kaul, A., V. Mehrotra, and R. Morck, 2000, Demand curves for stocks do slope down: New evidence from an index weights adjustment, Journal of Finance 55, 893–912.
Kim, O., and R. E. Verecchia, 1994, Liquidity and volume around earnings announcements,
Journal of Accounting and Economics 17, 41–67.
Kyle, A. S., 1985, Continuous auctions and insider trading,Econometrica 53, 1315–1335. Lynch, A., and R. Mendenhall, 1997, New evidence on stock price effects associated with
changes in the S&P 500, Journal of Business 70, 351–384.
Mase, Bryan, 2007, The impact of changes in the FTSE 100 index,The Financial Review
42, 461–484.
McGuckin, Robert H., Frederik R. Warren-Boulter, and Peter Waldstein, 1992, The use of stock market returns in antitrust analysis of mergers, Review of Industrial Organization
7, 1–11.
Scholes, M., 1972, The market for securities: Substitution versus price pressure and the effects of information on share prices, Journal of Business 45, 179–211.
Shleifer, A., 1986, Do demand curves for stocks slope downward?, Journal of Finance 41, 579–590.
Stoll, H., 1972, The supply of dealer services in securities markets,Journal of Finance 33, 1133–1151.
Treynor, Jack, and Fischer Black, 1973, How to use security analysis to improve portfolio selection,Journal of Business 46, 66–86.
Wurgler, J., and E. Zhuravskaya, 2002, Does arbitrage flatten demand curves for stocks?,