Correlation between Ribosome Biogenesis
and the Magnitude of Hypertrophy in
Overloaded Skeletal Muscle
Satoshi Nakada1*, Riki Ogasawara1, Shigeo Kawada2, Takahiro Maekawa1, Naokata Ishii1
1Department of Life Sciences, Graduate School of Arts and Sciences, The University of Tokyo, Tokyo, Japan,2Department of Sport and Medical Science, Teikyo University Faculty of Medical Technology, Tokyo, Japan
*s.nakada.d@gmail.com
Abstract
External loads applied to skeletal muscle cause increases in the protein translation rate, which leads to muscle hypertrophy. Although some studies have demonstrated that increases in the capacity and efficiency of translation are involved in this process, it remains unclear how these two factors are related to the magnitude of muscle hypertrophy. The present study aimed to clarify the roles played by the capacity and efficiency of translation in muscle hypertrophy. We used an improved synergist ablation in which the magnitude of compensatory hypertrophy could be controlled by partial removal of synergist muscles. Male rats were assigned to four groups in which the plantaris muscle was unilaterally subjected to weak (WK), moderate (MO), middle (MI), and strong (ST) overloading by four types of synergist ablation. Fourteen days after surgery, the weight of the plantaris muscle per body weight increased by 8%, 22%, 32% and 45%, in the WK, MO, MI and ST groups, respectively. Five days after surgery, 18+28S rRNA content (an indicator of translational capacity) increased with increasing overload, with increases of 1.8-fold (MO), 2.2-fold (MI), and 2.5-fold (ST), respectively, relative to non-over-loaded muscle (NL) in the WK group. rRNA content showed a strong correlation with relative muscle weight measured 14 days after surgery (r = 0.98). The phosphorylated form of p70S6K (a positive regulator of translational efficiency) showed a marked increase in the MO group, but no further increase was observed with further increase in overload (increases of 22.6-fold (MO), 17.4-fold (MI), and 18.2-fold (ST), respectively, relative to NL in the WK group). These results indicate that increases in ribosome biogenesis at the early phase of overloading are strongly dependent on the amount of overloading, and may play an important role in increasing the translational capacity for further gain of muscular size.
Introduction
In skeletal muscle, it is generally known that the increase of muscle mass subsequent to applica-tion of an external load is achieved by the accumulaapplica-tion of increasing of protein synthesis [1]. Among the processes involved in protein synthesis, protein translation has a central role in determining the amount of protein synthesized.
OPEN ACCESS
Citation:Nakada S, Ogasawara R, Kawada S,
Maekawa T, Ishii N (2016) Correlation between Ribosome Biogenesis and the Magnitude of Hypertrophy in Overloaded Skeletal Muscle. PLoS ONE 11(1): e0147284. doi:10.1371/journal. pone.0147284
Editor:Ashok Kumar, University of Louisville School of Medicine, UNITED STATES
Received:November 10, 2015
Accepted:January 2, 2016
Published:January 29, 2016
Copyright:© 2016 Nakada et al. This is an open access article distributed under the terms of the Creative Commons Attribution License, which permits unrestricted use, distribution, and reproduction in any medium, provided the original author and source are credited.
Data Availability Statement:All relevant data are within the paper and its Supporting Information files.
Funding:This work was supported by JSPS
KAKENHI Grant Number 15H03078.
Competing Interests:The authors have declared
To ascertain the part played by translation in overload and/or exercise-induced muscle hypertrophy, contributions of the capacity and efficiency of translation must be considered [2]. Both processes have been thought to be important in the exercise-induced increase in protein synthesis. However, most studies have focused on the mechanisms controlling translational efficiency (e.g., ribosome activation through the mammalian target of rapamycin (mTOR) C1 signaling pathway [3,4]) and not on the contribution of“translational capacity”.
Translational capacity is determined by the amount of“translational machinery”per unit volume of cells: ribosome numbers, transfer ribonucleic acid (tRNA) molecules, and transla-tional factors. All three factors are important, but the number of ribosomes present in the cell has been thought to be a primary determinant of translational capacity [5]. Therefore, ribo-some biogenesis may have an essential role in the control of protein synthesis and cell growth [6,7]. Involvement of ribosome biogenesis has been shown in the growth of cardiac muscle [5,8–10], but little is known about the contribution of ribosome biogenesis to hypertrophy of skeletal muscle. Recently, some studies have shown increased ribosome content in skeletal muscle hypertrophied by synergist ablation in rats [11–15] and in human skeletal muscle after resistance-exercise training [16]. However whether a quantitative relationship exists between the external loads applied to the muscle and ribosome biogenesis is not known.
“Translational efficiency”is defined as the rate of protein synthesis per ribosome, and is lim-ited mainly by the initiation step of translation. Baar and Esser reported a strong positive corre-lation between phosphorycorre-lation-induced activation of p70S6K (an initiator of transcorre-lation) and the magnitude of hypertrophy in muscles subjected to mechanical loading [17]. Therefore, p70S6K could be the main regulator of the mass of skeletal muscle. However, more recent stud-ies have shown weak or no correlation between p70s6k phosphorylation and the magnitude of muscle hypertrophy [18–20].
Thus, our aims were: (i) to establish an animal model of muscle hypertrophy in which the magnitude of hypertrophy can be controlled in a stepwise manner; and (ii) to ascertain if the magnitude of muscle hypertrophy is correlated with ribosome biogenesis and/or p70S6K acti-vation in the early phase of overloading.
Materials and Methods
Animals
Sixty-four male Wistar rats (11 weeks; 330 g) were purchased from CLEA Japan (Tokyo, Japan). They were housed in individual cages at regulated temperature (22°C), humidity (60%), and illumination cycles (12-h light and 12-h dark). They were allowed to eat commer-cial rat chow (CE2; CLEA Japan) and drink waterad libitum. The health status of the rats was monitored everyday in terms of signs of infections or wound openings. No rats showed any signs of illness or died at any time prior to the experimental endpoint. Rat care and all experi-mental procedures employed were in accordance with the policy statement of the American College of Sports Medicine on research with experimental animals. The Ethical Committee for Animal Experiments at the University of Tokyo approved this study.
Overload Surgery
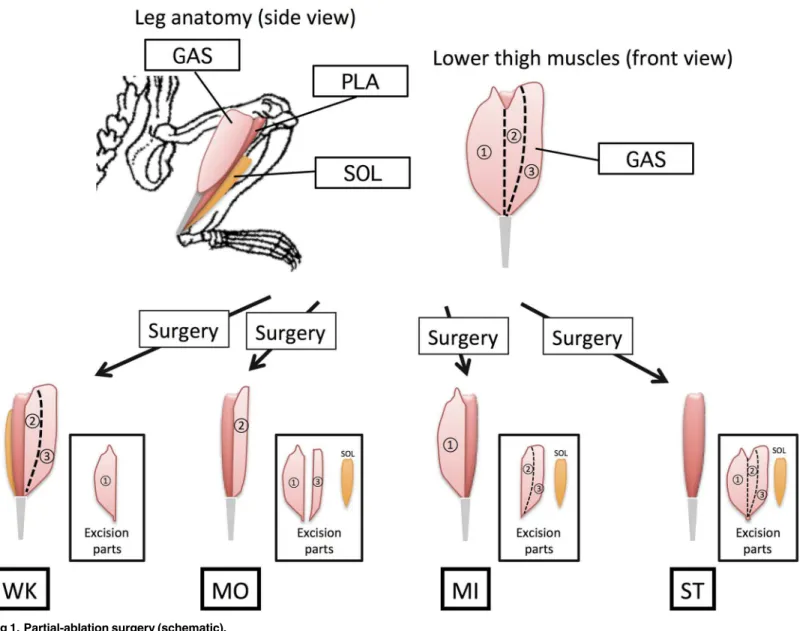
Rats were divided into four weight-matched groups of 16. They were subjected to four types of ablation surgery of synergist muscles:“weak”overload surgery (WK);“moderate”overload sur-gery (MO);“middle”overload surgery (MI);“strong”overload surgery (ST).
control (overloaded side (OL); Non-overloaded side (NL)). To control the magnitude of over-load to the plantaris muscle, we altered the extent of surgical ablation of synergist muscle (Fig 1).
The ST group was subjected to ablation surgery, in which two major synergist muscles of the plantaris muscle, gastrocnemius (GAS) and soleus (SOL), were excised. In addition to this procedure, weaker overload was imposed on the plantaris muscle. In the WK group, the GAS muscle was cut longitudinally and its medial part removed; in the MO group, the medial and half of the lateral part of GAS and SOL muscles were removed; and in the MI group, the lateral part of GAS and SOL muscles were removed. During partial-ablation surgery, we ensured that the tendons and motor neurons of the GAS muscle remained intact to maintain the contractile function of the remaining part of the GAS muscle. In a preliminary experiment, the remaining parts of the GAS muscle were shown to be intact without any sign of atrophy, suggesting that they had normal function. After surgery, the incision was closed with a 4–0 nylon suture. Rats were returned to their cages and kept sedentary until sacrifice. To observe early responses of Fig 1. Partial-ablation surgery (schematic).
the plantaris muscle to overloading, rats were sacrificed 5 days after surgery (described as“5 days OL”; N = 8 in each group). Morphologic changes of muscle were investigated for rats sac-rificed 14 days after surgery (“14 days OL”; N = 8 in each group).
Muscle Sampling
Five days or 14 days after surgery, rats were sacrificed by an overdose of sodium pentobarbital (120 mg/kg body weight, i.p.). Samples of the plantaris muscle were taken immediately. Each muscle was weighed and cut transversely at its middle position. The distal half was soaked into optimal cutting temperature compound (Sakura Finetek, Tokyo, Japan), and then frozen quickly in isopentane chilled with liquid nitrogen. Samples were stored at–80°C until morpho-logic analyses. The proximal half was frozen quickly, powdered with liquid nitrogen, and stored at–80°C until biochemical analyses. Since the plantaris muscle weight is affected by the body weight[21], it was expressed relative to body weight (muscle weight / body weight).
Cross-Sectional Analysis
Cross-sections (thickness, 10μm) were cut from frozen samples of 14 days OL plantaris muscle
and stained with hematoxylin & eosin (Sakura Finetek) according to standard procedures. Stained cross-sections were observed under a bright field microscope (Eclipse TE300; Nikon, Tokyo, Japan) and captured with a digital camera (DS-5M; Nikon, Tokyo, Japan). From photo-micrographs of each muscle, cross-sectional area (CSA) of1000 fibers was measured using ImageJ v. 1.46r (National Institutes of Health, Bethesda, MD, USA). The plantaris muscle has slow fibers in its deep region and fast fibers with different fiber size in its middle to surface region [22]. To avoid such a region-dependent bias, the measurement of CSA were made evenly for fibers in all captured images. As with muscle weight, fiber CSA is thought to be affected by body weight, so that it was expressed relative to body weight, too (CSA/body weight).
Quantification of Ribosomal RNA (rRNA)
For rRNA quantification, total RNA was extracted from powdered samples of 5days OL using an RNA extraction kit (ISOGEN; Nippon Gene, Tokyo, Japan). Obtained RNA pellets were eluted with nuclease-free TE buffer (10 mM Tris-HCl, 1 mM ethylenediamine tetra-acetic acid (EDTA), pH 8.0). RNA concentration was measured with a spectrometer (Smart Spec; Bio-Rad, Hercules, CA, USA) at 260 nm and total RNA content in 1 mg of muscle determined. Total RNA solution equivalent to 125μg of muscle tissue was electrophoresed on 1% agarose
gel, stained with fluorescent dye (GRR-1000GR Red; Bio-Craft, Tokyo, Japan) and viewed under ultraviolet light. Using captured electrophoresis images, densitometric measurements were made for 18S rRNA and 28S rRNA using ImageJ. For direct comparison, samples from the eight experimental conditions (four groups × both legs) were run on the same gel.
Western Blotting
Western blotting was undertaken according to the method described by Ogasawara et al. [23] with slight modifications. Powdered samples of 5 days OL were weighed and homogenized using shaking machine (Beads CrusherμT-12; Taitec, Koshigaya, Japan) with zirconia beads
Roche). Homogenates were centrifuged at 15,000 ×gfor 15 min at 4°C and supernatants col-lected. Protein concentrations of supernatants were determined using a protein quantification kit (Protein Assay Rapid Kit; Wako Pure Chemical Industries, Osaka, Japan). Samples were mixed with ×3 sample buffer (1.0%v/v2-mercaptoethanol, 4.0%w/vSDS, 0.16 M Tris-HCl (pH 6.8), 43%v/vglycerol, and 0.2% bromophenol blue) and heated at 95°C for 5 min. Samples with 50μg of total protein were electrophoresed using polyacrylamide gel (gradient, 4%–20%),
and transferred to polyvinylidene difluoride (PVDF) membranes. After transfer, membranes were washed with Tris-buffered saline containing 0.1% Tween-20 (TBST) and blocked with 5% skimmed milk in TBST for 1 h at room temperature. Membranes were then washed and incu-bated overnight with primary antibodies at 4°C. Primary antibodies (Cell Signaling Technol-ogy, Danvers, MA, USA) used were: phospho-p70S6 kinase (Thr389), total p70S6 kinase, and total ribosomal protein S6 (rpS6). After reactions with primary antibodies, membranes were washed and incubated with horseradish peroxidase-conjugated anti-rabbit antibodies for 1 h at room temperature. After washing, chemiluminescent reagents (Luminata Forte; Millipore, Bedford, MA, USA) were used to facilitate detection of protein bands. Images were scanned using a chemiluminescence detector (GeneGnome; Syngene, Cambridge, UK). After measure-ments, membranes were stripped using stripping buffer (Restore™Plus; Pierce, Rockford, IL, USA) and stained with Coomassie Brilliant Blue (CBB) to verify equal loading in all lanes [24]. Using captured images, band intensities were measured using ImageJ. For direct comparison, samples from the eight experimental conditions were run on the same gel.
Statistical Analyses
Data are the mean ± SEM. Results of body weights were analyzed by using two-way analysis of variance (ANOVA; Pre or Post- experiment × groups) with repeated measures on time. Fol-lowing significant main or interaction effects, Sidak post hoc tests were used for pairwise com-parison between time points and individual groups. For other variables, paired t-tests were used to comparing between NL and OL in each group. Differences between four groups’NL legs or OL legs were determined by one-way analysis of variance (ANOVA) with Tukey’s post hoc testing. Pearson’s r product moment correlation coefficient was used to explore the rela-tionship between different variables.P<0.05 was considered significant.
Results
Changes in Body Weight
Table 1displays changes of body weight pre and post experiment. There was not significant interaction between time and groups in both 5-day OL and 14-day OL (P= 0.29, 0.23, respec-tively). Body weight did not change significantly in any group after 5-day overloading (P= 0.14), but increased by ~12% after 14-day overloading in each group (P<0.0001). After 14-day overloading, percentage changes in body weight were not significantly different between groups (P= 0.098).
Changes in Muscle Weight
suggest that surgical treatment caused graded increases in muscle weight. Relative weight of the plantaris muscle in NL legs between groups did not show significant differences (P= 0.22), sug-gesting that surgical treatment did not affect muscles in NL legs.
Histological Changes
Typical photomicrographs of cross-sections of the plantaris muscle are shown inFig 3A. In all four groups, muscle fibers exhibited hypertrophy without any sign of abnormality (e.g., edema, necrosis, apoptosis) (Fig 3A-b–e).
Absolute value of fiber CSA is shown inTable 2, and fiber CSA of fibers expressed relative to body weight is shown inFig 3B. MO_OL, MI_OL, and ST_OL showed significant increases in relative fiber CSA compared with NL legs (increases of 29.0 ± 5.5% in MO_OL, 23.9 ± 3.9% Table 1. Body weight of 5 and 14day OL rats.
Group n Body weight, g
Pre-experiment Post-experiment % increase
5day
WK 8 355.4 sesei 361.5 sesei 1.76 sesei
MO 8 351.0 sesei 353.4 sesei 0.69 sesei
MI 8 386.5 sesei 385.1 sesei -0.34 seseim
ST 8 355.9 sesei 357.0 sesei 0.37 sesei
14day
WK 8 332.4 sesei 375.4 sesei 12.86 seseim
MO 8 352.1 sesei 384.5 sesei 9.25 sesei
MI 8 327.3 sesei 366.6 sesei 12.02 seseim
ST 8 334.1 sesei 371.3 sesei 11.03 seseim
Values are means±SEM;n, number of rats.
doi:10.1371/journal.pone.0147284.t001
Fig 2. Plantaris muscle weight/body weight measured 14 days after surgery.Values are the mean±SEM (N = 8).*Significantly different from NL in the same group (P<0.05). Different alphabetical letters denote significant differences between OL groups (P<0.05).
in MI_OL, and 28.9 ± 2.2% in ST_OL compared with contralateral NL (P= 0.0011,P= 0.0005, P= 0.0001, respectively)), whereas in WK_OL, the change was not significant but tended to larger than WK_NL (P= 0.07). Comparing between each group’s OL legs, magnitude of the change in relative fiber CSA was significantly different between WK_OLvs. MI_OL (P= 0.045), WK_OLvs. ST_OL (P= 0.0003), and MO_OLvs. ST_OL (P= 0.049). Relative fiber CSA in NL legs between groups did not show significant differences (P= 0.18).
Fig 3. Morphologic analyses of the plantaris muscle obtained 14 days after surgery.A, Cross-sections of the plantaris muscle stained with hematoxylin & eosin. a, NL; b, WK_OL; c, MO_OL; d, MI_OL; e, ST_OL. Bar = 100μm. B: Mean muscle fiber CSA/body weight. Values are the mean±SEM (N = 8; measurements were made for1000 fibers in each muscle).*Significantly different from NL in the same group (P<0.05). Different alphabetical letters denote significant differences between OL groups (e.g., AB is different from C, but not different from A and B (P<0.05)).
doi:10.1371/journal.pone.0147284.g003
Table 2. Absolute value of fiber CSA (14day OL rats).
Group n NL OL
WK 8 2651.8. Abs 2926.8. Abso
MO 8 2578.8. Abs 3366.8. Abso
MI 8 2724.7. Abs 3346.6. Abso
ST 8 2665.2. Ab.0 3759.8. Ab.0
Values are means±SEM;n, number of rats.
Ribosome Biogenesis
The 18+28S rRNA content in a 1-mg sample of plantaris muscle, expressed relative to that in WK_NL, is shown inFig 4A. In MO_OL, MI_OL, and ST_OL, it showed graded increases of 75.6 ± 12.1%, 117.9 ± 12.9%, and 153.5 ± 18.2%, respectively. Significant differences were seen in WK_OL vs. MO_OL, WK_OL vs. MI_OL, WK_OL vs. ST_OL, and MO_OL vs. ST_OL (P= 0.0032,P<0.0001,P<0.0001,P= 0.0018, respectively). These results suggested that rRNA content per muscle volume increased gradually with the increasing mechanical loading.
Total rpS6 content per unit weight of plantaris muscle is shown inFig 4B. In all groups, total rps6 in OL legs was increased significantly compared with each NL legs (WK;P= 0.043, MO;P= 0.029, MI;P= 0.0004, ST;P= 0.0014, respectively). When the increase in 18+28S rRNA was plotted against the increase in rpS6, a strong correlation was found (r= 0.73, P<0.0001,Fig 4C). The slope of least-squares regression was 0.911. Concomitant increases in rRNA and ribosomal protein suggested that ribosomal biogenesis is strongly stimulated by mechanical overloading of muscle.
Fig 4. Content of 18+28S rRNA (A) and total rpS6 protein (B) in the plantaris muscle measured 5 days after surgery.C, Correlation between rRNA content and rpS6 content. Solid line represents least-squares linear regression (y = 0.9114x + 0.2064,r= 0.73,P<0.0001), and broken lines denote its limits at 95% confidence intervals. Symbols and alphabetical letters are similar to those described in Figs2and3.
Phosphorylation of p70S6K
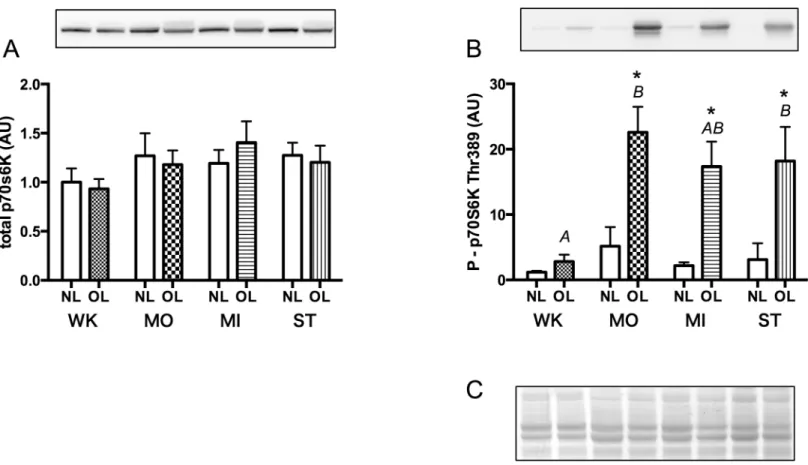
Changes in expression of p70S6K and its phosphorylated form in the plantaris muscle are shown inFig 5. CBB staining of PVDF membranes showed that an equal amount of total pro-tein was loaded onto each electrophoresis lane (Fig 5C). Total content of p70S6K protein showed no significant differences between NL legs vs. OL legs in each group (WK;P= 0.18, MO;P= 0.51, MI;P= 0.25, ST;P= 0.24), or between groups in each leg (NL;P= 0.62, OL; P= 0.28) (Fig 5A).
However, p70s6K phosphorylation at Thr 389 in the muscles of OL legs showed a marked increase in the moderate loading condition (MO), but thereafter, no significant differences between MO, MI and ST groups were observed (MO_OL vs. MI_OL;P= 0.77, MO_OL vs. ST_OL;P= 0.85, MI_OL vs. ST_OL;P= 0.99) (Fig 5B). These results suggested that p70S6K phosphorylation readily reached a maximum and was kept almost constant even though the muscle size increased further with increasing mechanical loading.
Relations between Muscle Weight and Contents of rRNA and
Phosphorylated p70S6K
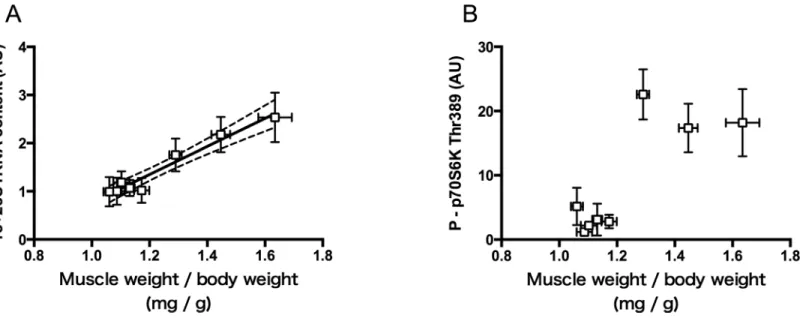
To obtain an insight into the significance of the early increases of rRNA and phosphorylated p70S6K in determining the magnitude of hypertrophy, contents of 18+28S rRNA and phos-phorylated p70S6K measured at 5d after the surgery were plotted against the magnitude of hypertrophy measured at 14d after the surgery (Fig 6A and 6B). A strong linear relationship
Fig 5. Content of total p70S6K (A) and its phosphorylated form (B) in the plantaris muscle measured 5 days after surgery.C, Representative CBB staining pattern of membranes: an almost identical amount of protein was loaded on electrophoretic lanes. Symbols and alphabetical letters are similar to those described in Figs2and3.
was found between relative muscle weight and 18+28S rRNA content (r= 0.98,P<0.0001,Fig
6A).
On the other hand, the content of phosphorylated p70S6K showed a marked increase with relative muscle weight by up to ~20%, thereafter appeared to be almost constant despite of fur-ther increase in muscle weight (Fig 6B).
Discussion
Muscle Hypertrophy Caused by Synergist Ablation
Few studies have reported the relationship between the amount of mechanical stress and the magnitude of hypertrophy in overloading-induced muscle hypertrophy [17,25]. One of the major reasons for this is the difficulty in controlling the strength of mechanical overloading of muscle in animal models. Thus, we tried to develop a novel method of synergist ablation in which the amount of overloading of a given muscle can be controlled by partial removal of its synergist muscles (Fig 1).
The partial-ablation method described here caused plantaris muscle hypertrophy of varying magnitudes: 8%, 22%, 34% and 45%. Muscle fibers showed similar, graded increases in CSA. These results suggest that the strength of mechanical loading is one of the primary factors that determines the magnitude of muscle hypertrophy during a given time period. However, factors other than mechanical stress are also to be considered. For example, removal of the larger part of synergist muscles may give rise to the stronger stress in the nervous, endocrine and immune systems. In par-ticular, increased inflammatory responses caused by synergist ablation surgery may produce a large amount of cytokines that may stimulate regeneration and /or growth of the subjected muscle.
Ribosome Biogenesis
Previous studies have shown that ribosome biogenesis were activated in mouse muscles 7 days after synergist ablation [11] or serum-activated myotubes [26]. However, a quantitative
Fig 6. Relations between relative weight of the plantaris muscle and contents of 18+28S rRNA (A) and phosphorylated p70S6K (B).Relative muscle weight was measured 14 days after surgery, whereas levels of rRNA and phosphorylated p70S6K were measured 5 days after surgery (see Figs4Aand5B). rRNA content is expressed relative to that in WK_NL. Mean±SEM values are plotted. In A, the solid line represents least-squares linear regression (y = 3.171x−215.3,r= 0.98,P<0.0001), and broken lines denote its limits at 95% confidence intervals.
relationship between ribosome biogenesis and the magnitude of muscle hypertrophy has not been reported.
We showed that expression of 18+28S rRNA, an indicator of ribosome content in the cell, increased significantly after synergist ablation, as has been shown in previous studies[11,14,27–
30]. In addition, we found that rRNA content measured 5 days after surgery increased with the increase in relative muscle weight measured 14 days after surgery (Fig 4A). When rRNA con-tent was plotted against the relative increase in muscle weight, a strong correlation was found (r= 0.98,P<0.0001;Fig 6A), suggesting that activation of ribosome biogenesis at an early phase of overloading has an important role in increasing the translational capacity for subse-quent muscle hypertrophy.
However, an appropriate amount of ribosomal protein commensurate with the increment in rRNA expression must be synthesized to assemble mature ribosomes. Chaillou et al. showed an increase in rpS6 (a component of the 40S ribosomal subunit) after synergist ablation [30]. We also showed that rpS6 content increased with an increase in muscle weight. In addition, a strong correlation was found between rRNA content and rpS6 content (r = 0.73,Fig 4C). A similar correlation between rRNA and expression of ribosomal protein has been reported for liver regeneration after hepatic resection, and is regarded as a reliable measure of ribosome bio-genesis [31,32].
At present, it remains unclear whether ribosome biogenesis is necessary for attaining a large magnitude of muscle hypertrophy. Further studies on the relationship between ribosome bio-genesis and protein synthesis, and on the effects of specific inhibitors of ribosome biobio-genesis are needed.
Phosphorylation of p70s6K
Weigl demonstrated that p70s6K (a downstream protein in the mTOR signaling cascade) acti-vates protein translation when phosphorylated at its Thr 389 residue at an early phase of mechanical overloading [33]. Some positive correlations have been reported between p70S6K phosphorylation and the magnitude of overloading-induced muscle hypertrophy, even though the range of hypertrophy was limited [17,34]. Therefore, the degree of p70s6K phosphorylation at an early phase of mechanical overloading may be a determinant of the magnitude of muscle hypertrophy [35]. However, more recent clinical studies of resistance exercise have shown weak or no correlation between p70S6K phosphorylation and the magnitude of hypertrophy [18–20].
The present study showed that a wide range of muscle hypertrophy (approximately 10%– 50%) could be attained by controlling the degree of synergist ablation. A marked increase in p70S6K phosphorylation after moderate overloading was observed, a finding that was in accor-dance with other studies [11,27,28,30]. However, no further increase in p70S6K phosphoryla-tion was observed with further increase in overload (Fig 5B). When phosphorylation level was plotted against the magnitude of muscle hypertrophy, it was found to reach a maximal phos-phorylation level at ~20% hypertrophy, which remained almost constant thereafter (Fig 6B).
Conclusion
In conclusion, the present study with a modified synergist ablation method showed that increase in ribosome biogenesis at an early phase of compensatory muscle hypertrophy was strongly correlated with the magnitude of hypertrophy, suggesting that it plays an important role in increasing the translational capacity for sustained protein synthesis. Further studies are required to clarify the role played by ribosome biogenesis in exercise-induced muscle hypertrophy.
Supporting Information
S1 Dataset. The dataset of sample groups used in the analysis. (XLSX)
Author Contributions
Conceived and designed the experiments: SN SK TM NI. Performed the experiments: SN RO TM. Analyzed the data: SN RO NI. Contributed reagents/materials/analysis tools: SN RO. Wrote the paper: SN NI.
References
1. Goldberg AL. Protein synthesis during work-induced growth of skeletal muscle. J Cell Biol. 1968 Mar; 36(3):653–8. PMID:5645554
2. Nader GA, Hornberger TA, Esser KA. Translational Control: Implications for Skeletal Muscle Hypertro-phy. Clin Orthop Relat Res. 2002;(403: ):178–87.
3. Csibi A, Cornille K, Leibovitch MP, Poupon A, Tintignac L a., Sanchez AMJ, et al. The translation regu-latory subunit eiF3f controls the kinase-dependent mTOR signaling required for muscle differentiation and hypertrophy in mouse. PLoS One. 2010; 5(2).
4. Mayhew DL, Hornberger T a, Lincoln HC, Bamman MM. Eukaryotic initiation factor 2B epsilon induces cap-dependent translation and skeletal muscle hypertrophy. J Physiol. 2011 Jun 15; 589(Pt 12):3023–
37. doi:10.1113/jphysiol.2010.202432PMID:21486778
5. Chaillou T, Kirby TJ, McCarthy JJ. Ribosome biogenesis: emerging evidence for a central role in the regulation of skeletal muscle mass. J Cell Physiol. 2014 Nov; 229(11):1584–94. doi:10.1002/jcp.24604
PMID:24604615
6. Warner JR. The economics of ribosome biosynthesis in yeast. Trends Biochem Sci. 1999; 24(Novem-ber):437–40. PMID:10542411
7. Granneman S, Tollervey D. Building Ribosomes: Even More Expensive Than Expected? Curr Biol. 2007; 17:415–7.
8. Zhang Z, Liu R, Townsend P a., Proud CG. P90RSKs mediate the activation of ribosomal RNA synthe-sis by the hypertrophic agonist phenylephrine in adult cardiomyocytes. J Mol Cell Cardiol. Elsevier Ltd; 2013; 59:139–47. doi:10.1016/j.yjmcc.2013.03.006PMID:23510923
9. Hannan RD, Luyken J, Rothblum LI. Regulation of ribosomal DNA transcription during contraction-induced hypertrophy of neonatal cardiomyocytes. J Biol Chem. 1996; 271:3213–20. PMID:8621723 10. Goodfellow SJ, Innes F, Derblay LE, MacLellan WR, Scott PH, White RJ. Regulation of RNA
polymer-ase III transcription during hypertrophic growth. EMBO J. 2006; 25(7):1522–33. PMID:16541106 11. Goodman C a, Frey JW, Mabrey DM, Jacobs BL, Lincoln HC, You J-S, et al. The role of skeletal muscle
mTOR in the regulation of mechanical load-induced growth. J Physiol. 2011 Nov 15; 589(Pt 22):5485–
501. doi:10.1113/jphysiol.2011.218255PMID:21946849
12. Machida M, Takeda K, Yokono H, Ikemune S, Taniguchi Y, Kiyosawa H, et al. Reduction of ribosome biogenesis with activation of the mTOR pathway in denervated atrophic muscle. J Cell Physiol. 2012 Apr; 227(4):1569–76. doi:10.1002/jcp.22871PMID:21678406
14. von Walden F, Casagrande V, Östlund Farrants A-K, Nader G a. Mechanical loading induces the expression of a Pol I regulon at the onset of skeletal muscle hypertrophy. Am J Physiol Cell Physiol. 2012 May 15; 302(10):C1523–30. doi:10.1152/ajpcell.00460.2011PMID:22403788
15. Nader G a, von Walden F, Liu C, Lindvall J, Gutmann L, Pistilli EE, et al. Resistance exercise training modulates acute gene expression during human skeletal muscle hypertrophy. J Appl Physiol. 2014 Mar 15; 116(6):693–702. doi:10.1152/japplphysiol.01366.2013PMID:24458751
16. Figueiredo VC, Caldow MK, Massie V, Markworth JF, Cameron-Smith D, Blazevich AJ. Ribosome bio-genesis adaptation in resistance training-induced human skeletal muscle hypertrophy. Am J Physiol—
Endocrinol Metab. 2015;ajpendo.00050.2015.
17. Baar K, Esser K. Phosphorylation of p70(S6k) correlates with increased skeletal muscle mass following resistance exercise. Am J Physiol. 1999 Jan; 276(1 Pt 1):C120–7. PMID:9886927
18. Mitchell CJ, Churchward-Venne T a, Bellamy L, Parise G, Baker SK, Phillips SM. Muscular and sys-temic correlates of resistance training-induced muscle hypertrophy. PLoS One. 2013 Jan; 8(10): e78636. doi:10.1371/journal.pone.0078636PMID:24130904
19. Mitchell CJ, Churchward-Venne T a, West DWD, Burd N a, Breen L, Baker SK, et al. Resistance exer-cise load does not determine training-mediated hypertrophic gains in young men. J Appl Physiol. 2012 Jul; 113(1):71–7. doi:10.1152/japplphysiol.00307.2012PMID:22518835
20. Burd N a, Holwerda AM, Selby KC, West DWD, Staples AW, Cain NE, et al. Resistance exercise vol-ume affects myofibrillar protein synthesis and anabolic signalling molecule phosphorylation in young men. J Physiol. 2010 Aug 15; 588(Pt 16):3119–30. doi:10.1113/jphysiol.2010.192856PMID:
20581041
21. Tamaki T, Uchiyama S. Absolute and relative growth of rat skeletal muscle. Physiol Behav. Elsevier; 1995 May; 57(5):913–9. PMID:7610144
22. van der Meer SFT, Jaspers RT, Jones D a, Degens H, VanderMeer SFT, Jaspers RT, et al. The time course of myonuclear accretion during hypertrophy in young adult and older rat plantaris muscle. Ann Anat. Elsevier GmbH.; 2011 Feb 20; 193(1):56–63. doi:10.1016/j.aanat.2010.08.004PMID:20833519 23. Ogasawara R, Kobayashi K, Tsutaki A, Lee K, Abe T, Fujita S, et al. mTOR signaling response to resis-tance exercise is altered by chronic resisresis-tance training and detraining in skeletal muscle. J Appl Phy-siol. 2013 Jan 31; 114:934–40. doi:10.1152/japplphysiol.01161.2012PMID:23372143
24. Welinder C, Ekblad L. Coomassie staining as loading control in Western blot analysis. J Proteome Res. 2011 Mar 4; 10(3):1416–9. doi:10.1021/pr1011476PMID:21186791
25. Roy RR, Monke SR, Allen DL, Edgerton VR. Modulation of myonuclear number in functionally over-loaded and exercised rat plantaris fibers. J Appl Physiol. 1999 Aug; 87(2):634–42. PMID:10444623 26. Nader GA, Mcloughlin TJ, Esser KA, Gustavo A, Physiol AJ, Physiol C, et al. mTOR function in skeletal
muscle hypertrophy: increased ribosomal RNA via cell cycle regulators. Am J Physiol Cell Physiol. 2005 Dec; 289(6):C1457–65. PMID:16079186
27. Adams GR, Caiozzo VJ, Haddad F, Baldwin KM. Cellular and molecular responses to increased skele-tal muscle loading after irradiation. Am J Physiol Cell Physiol. 2002 Oct; 283(4):C1182–95. PMID:
12225982
28. Miyazaki M, McCarthy JJ, Fedele MJ, Esser K a. Early activation of mTORC1 signalling in response to mechanical overload is independent of phosphoinositide 3-kinase/Akt signalling. J Physiol. 2011 Apr 1; 589(Pt 7):1831–46. doi:10.1113/jphysiol.2011.205658PMID:21300751
29. Chaillou T, Lee JD, England JH, Esser K a, McCarthy JJ. Time course of gene expression during mouse skeletal muscle hypertrophy. J Appl Physiol. 2013 Oct 1; 115(7):1065–74. doi:10.1152/
japplphysiol.00611.2013PMID:23869057
30. Chaillou T, Koulmann N, Simler N, Meunier A, Serrurier B, Chapot R, et al. Hypoxia transiently affects skeletal muscle hypertrophy in a functional overload model. Am J Physiol Regul Integr Comp Physiol. 2012 Mar 1; 302(5):R643–54. doi:10.1152/ajpregu.00262.2011PMID:22189670
31. Tsurugi K, Morita T, Ogata K. Effects of the Inhibition of Ribosomal-RNA Synthesis on the Synthesis of Ribosomal Structural Proteins in Regenerating Rat Liver. Eur J Biochem. 1972; 29:585–92. PMID:
5083511
32. Tsurugi K, Morita T, Ogata K. Studies on the Metabolism of Ribosomal Structural Proteins of Regener-ating Rat Liver. Sites of Biosynthesis of Structural Proteins of Large Subunit and of Their Assembly with RNA Moiety. Eur J Biochem. 1972 Jan; 25(1):117–28. PMID:5023577
33. Weigl LG. Lost in translation: regulation of skeletal muscle protein synthesis. Curr Opin Pharmacol. Elsevier Ltd; 2012 Jun; 12(3):377–82. doi:10.1016/j.coph.2012.02.017PMID:22445545
35. Phillips SM. Physiologic and molecular bases of muscle hypertrophy and atrophy: impact of resistance exercise on human skeletal muscle (protein and exercise dose effects). Appl Physiol Nutr Metab. 2009 Jun; 34(3):403–10. doi:10.1139/H09-042PMID:19448706