Differential DNA Methylation Regions in Cytokine and
Transcription Factor Genomic Loci Associate with
Childhood Physical Aggression
Nadine Provenc¸al1,2,3, Matthew J. Suderman1,3,6, Doretta Caramaschi2, Dongsha Wang1,2, Michael Hallett6, Frank Vitaro2,7, Richard E. Tremblay2,4,5*., Moshe Szyf1,3
*.
1Department of Pharmacology and Therapeutics, McGill University, Montreal, Quebec, Canada,2Research Unit on Children’s Psycho-Social Maladjustment and Ste-Justine Hospital Research Center, University of Montreal, Montreal, Quebec, Canada,3Sackler Program for Epigenetics and Psychobiology, McGill University, Montreal, Quebec, Canada,4Department of Psychology and Pediatrics, University of Montreal, Montreal, Quebec, Canada,5School of Public Health and Population Science, University College Dublin, Dublin, Ireland,6McGill Centre for Bioinformatics, McGill University, Montreal, Quebec, Canada,7School of Psycho-Education, University of Montreal, Montreal, Quebec, Canada
Abstract
Background: Animal and human studies suggest that inflammation is associated with behavioral disorders including aggression. We have recently shown that physical aggression of boys during childhood is strongly associated with reduced plasma levels of cytokines IL-1a, IL-4, IL-6, IL-8 and IL-10, later in early adulthood. This study tests the hypothesis that there is an association between differential DNA methylation regions in cytokine genes in T cells and monocytes DNA in adult subjects and a trajectory of physical aggression from childhood to adolescence.
Methodology/Principal Findings:We compared the methylation profiles of the entire genomic loci encompassing the IL-1a, IL-6, IL-4, IL-10 and IL-8 and three of their regulatory transcription factors (TF) NFkB1, NFAT5 and STAT6 genes in adult males on a chronic physical aggression trajectory (CPA) and males with the same background who followed a normal physical aggression trajectory (control group) from childhood to adolescence. We used the method of methylated DNA immunoprecipitation with comprehensive cytokine gene loci and TF loci microarray hybridization, statistical analysis and false discovery rate correction. We found differentially methylated regions to associate with CPA in both the cytokine loci as well as in their transcription factors loci analyzed. Some of these differentially methylated regions were located in known regulatory regions whereas others, to our knowledge, were previously unknown as regulatory areas. However, using the ENCODE database, we were able to identify key regulatory elements in many of these regions that indicate that they might be involved in the regulation of cytokine expression.
Conclusions:We provide here the first evidence for an association between differential DNA methylation in cytokines and their regulators in T cells and monocytes and male physical aggression.
Citation:Provenc¸al N, Suderman MJ, Caramaschi D, Wang D, Hallett M, et al. (2013) Differential DNA Methylation Regions in Cytokine and Transcription Factor
Genomic Loci Associate with Childhood Physical Aggression. PLoS ONE 8(8): e71691. doi:10.1371/journal.pone.0071691
Editor:James D. Clelland, The Nathan Kline Institute, United States of America
ReceivedJanuary 16, 2013;AcceptedJuly 2, 2013;PublishedAugust 19, 2013
Copyright:ß2013 Provenc¸al et al. This is an open-access article distributed under the terms of the Creative Commons Attribution License, which permits
unrestricted use, distribution, and reproduction in any medium, provided the original author and source are credited.
Funding:This work was supported by a fellowship from the Genes, Environment and Health Training Program from CIHR to NP, grants from the Canadian
Institutes of Health Research, the Social Sciences Humanities Research Council of Canada, the Quebec Health Research Fund (FRSQ) and the Quebec Social Science and Culture Fund (FQRSC) to RET, grants from the Canadian Institutes of Health Research, the Sackler Program in Psychobiology and Epigenetics at McGill University and from the Canadian Institute for Advanced Research to MS. The funders had no role in study design, data collection and analysis, decision to publish, or preparation of the manuscript.
Competing Interests:The authors have declared that no competing interests exist.
* E-mail: richard.tremblay@ucd.ie (RET); moshe.szyf@mcgill.ca (MS)
.These authors contributed equally to this work.
Introduction
Physical violence is an important health problem, especially among males [1]. The development of physical aggression has been studied with large population based longitudinal studies from birth to adulthood. Results show that children start using physical aggressions by the end of the first year after birth, increase their frequency from 2 to 4 years of age [2–5], and then reduce the frequency from school entry to adulthood [6]. However, a minority of children (4–7%), mainly males, maintain a high frequency of physical aggression from childhood to adolescence
[5–7]. These children tend to be impulsive, hyperactive, opposi-tional and rejected by their peers, they also tend to fail in school and have serious social adjustment problems during adulthood [8– 12]. There is good evidence that the parents of children on a high trajectory of physical aggression exhibit similar behavioral problems creating early childhood family environments which do not support learning to regulate physically aggressive reactions [5,7,13–16].
A growing body of research suggests that inflammatory cytokines might have systemic effects in addition to their role in the immune response. Recent studies have shown that changes in
cytokine expression levels are associated with various behavioral disorders such as anxiety, depression, suicide, childhood mood disorder and post-traumatic stress disorder (PTSD) [17–28]. In normal men, assessments of hostility, physical aggression, and verbal aggression were positively associated with lipopolysaccha-ride stimulated TNF-a expression in blood monocytes [29]. Moderate to severe maltreatment during childhood was also observed to be positively correlated with overall change in stress-induced IL-6 concentrations [30]. Other studies examined the association between cytokines and aggression in animals. Gene knockout depletion of IL-6 (2/2) in mice resulted in increased aggression compared to control mice and over-expression of IL-6 in the brain of normal mice increases affiliative behavior [31]. We have recently shown that consistent with these data in mice, physical aggression of boys during childhood is associated with reduced plasma levels of cytokines later in early adulthood [32]. Compared to the control group, men on a chronic physical aggression trajectory from childhood to adolescence had consis-tently lower plasma levels of five cytokines: pro-inflammatory interleukins IL-1a and IL-6, anti-inflammatory interleukin IL-4 and IL-10, and chemokine IL-8. However, the mechanisms that differentially regulate cytokine expression in white blood cells in chronically aggressive humans are unknown.
DNA methylation is involved in programming cell type specific gene expression during development [33]. Consistent with this developmental role of DNA methylation, it is involved in naive CD4+T cells differentiation into Th1 and Th2 cells [34,35]. The Th2 cytokine locus (IL-4-IL-13-Rad50-IL-5 locus) expressed in Th2 and the IFNc locus expressed in Th1, undergo chromatin remodeling and DNA demethylation during differentiation ([35] and [36] for review). DNA methylation regulates cytokine gene expression (IL-1a[37], IL-6 [38], IL-8 [39], IL-10 [40] and IL-4 [36]) as well as the expression of the transcription factors (TF) that regulate cytokine expression (NFAT5 [41], STAT6 [42] and STAT1 [43]). TFs are also involved in epigenetic reprogramming of their cytokine targets. For example, STATs are required for maintenance of histone acetylation states in the IL-4 and IFNc locus [44] and establishment of histone acetylation and DNA demethylation in IL-4 locus requires the presence of STAT6 [44,45].
Evidence is emerging that in addition to its role in regulating gene expression during differentiation, the DNA methylation pattern is responsive to external environmental exposures includ-ing the social environment [46] in animals [47–54] and in humans [55–59]. Importantly, DNA methylation alterations associated with social exposures are not restricted to the brain and are detected in whole blood cell (WBC) DNA [27,55,57,58,60–67]. It is therefore plausible that alteration in DNA methylation of cytokine regulatory regions and the transcription factors that regulate them occur in response to social signals and play a role in human behavior, including aggression.
Previous studies from our group and others that have examined associations of genome wide DNA methylation profiles with behavioral exposures have pointed to immune pathways, partic-ularly cytokines. We have shown that maternal deprivation in rhesus macaques is associated with changes in DNA methylation in promoters regulating genes in the immune response pathways [68]. Specifically, transcription factors, cytokines and their receptors, such as NFkB2, IL-16 and IFNcR2 gene promoters, were identified to be differentially methylated in T cells. In humans, we have described association between early life socioeconomic position (SEP) and adult WBC DNA methylation signatures in chemokines (CCL3, CXCL9, CCR1, CCR10, CCR3, CCR6), interleukins (IL-2, IL-4, IL-8, IL1RN), cytokine
receptors (IL10RB, IL6RB) and transcription factors regulating cytokine gene expression (NFATC1, NF-IL3, IkBb) [60]. DNA methylation alterations in white blood cell DNA that were associated with PTSD, included genes involved in inflammation, such as CLEC9A, ANXA2, TLR8 [27]. Lastly, in subjects with a lifetime history of depression, IL-6 and CRP serum levels were found to be elevated, where IL-6 methylation in WBC DNA showed an inverse correlation with circulating IL-6 and CRP [69]. We have previously reported lower plasma cytokines levels in aggressive subjects [32]. We therefore compared the methylation profiles of IL-1a, IL-6, IL-4, IL-10 and IL-8 gene loci and three of their transcription factors NFkB1, NFAT5 and STAT6 gene loci in adult males on a chronic physical aggression trajectory (CPA) between 6 and 15 years of age and males with the same background who followed a normal physical aggression trajectory (control group). Although the promoter area and the immediate 59 regulatory regions play an important role in regulation of gene expression, it is also clear that methylation-dependent regulatory sequences could be found in other parts of the body of the gene or its flanking sequences. Most genome-wide DNA methylation screens focus on promoter regions for reasons of feasibility. By focusing on a short-list of selected genes we were able to examine the entire genomic loci of these genes using a combination of methylated DNA immunoprecipitation (MeDIP) and comprehen-sive high-density oligonucleotide arrays. Our study provides evidence for association between male physical aggression and differentially methylated regions in cytokines and their transcrip-tion factor genomic loci.
Results
Associations of Differential DNA Methylation with Physical Aggression in Cytokine Genes
We generated and analyzed DNA methylation profiles covering the genomic loci of five cytokines (IL-1a, 6, 8, 4 and IL-10) and three transcription factors (NFkB, NFAT5 and STAT6) known to regulate these cytokines. Profiles were generated from T cells and monocytes of adult males with normal (control) and chronic physical aggressive (CPA) trajectories from childhood to late adolescence. The five cytokines were selected for profiling because they have been shown to have lower plasma levels in CPA adult males [32]. As describe above, previous studies have shown that WBCs DNA methylation is associated with environmental exposure and correlate with circulating cytokine levels [61,63,70]. Since WBCs comprise heterogeneous cell populations, which could mask cell-type specific methylation differences, we isolated and examined CD3+T cells and monocytes since these cell types express the cytokines and transcription factors that were previously shown to be different in the CPA group. The profiles were generated using MeDIP followed by hybridization to microarrays with probes placed at 100 bp-spacing starting from about240 Kb before the transcription start site of each gene of interest to about 40 Kb after its transcription end site. Thus, the profiles included not only the promoters and bodies of these genes but also more distant sites in order to identify any genomic site with methylation levels altered in CPA individuals that might explain the previously observed lower cytokine levels. Differences between the CPA and control groups were found throughout each cytokine loci in both cell types analyzed (Table 1). In total, 48 differentially methylated regions associated with CPA (,1000 bp, log2-fold .0.5, FDR
,0.2) were identified in the cytokine loci, 20 in T cells and 28 in monocytes. Surprisingly, none of these were located in the promoters of the candidate cytokines, defined as the region from 22000 bp to+1000 bp of the transcription start site, although one DNA Methylation in Cytokine Genes and Aggression
differentially methylated region was found just outside the promoter (22042 bp) of IL-6 (Figure 1). Two differentially methylated regions were found in the enhancer/insulator locus control region (LCR) of the IL-4 and IL-10 loci (Figure 2). Each cytokine gene loci included several other genes, and some of these non-candidates were in fact closer to several differentially methylated regions than the originally short-listed genes. Tables listing all differentially methylated regions associated with aggres-sion for each cell type along with the gene nearest to the region can be found in Spreadsheet S1.
To better understand the regulatory factors potentially affected by the differentially methylated regions associated with aggression, we compared each differentially methylated region against transcription factor binding sites, DNase clusters and histone mark enrichments recorded in the Encyclopedia of DNA Elements (ENCODE) database (http://genome.ucsc.edu/ENCODE/),
de-rived previously from 24 different cell lines (histone mark profiles were available for only 8 of the cell lines). In total, 25 of the 48 differentially methylated regions associated with CPA coincided with transcription factor binding sites (Table 1), and many of the bound transcription factors are known regulators of cytokines such as NFkB, GR, PU.1, STAT and BAFF family members. A high fraction of the differentially methylated regions associated with aggression (35 of 48) coincided with DNase hypersensitive clusters indicating that these regions have an open chromatin state in at least one cell line and therefore likely to play regulatory roles (Table 1). The number of cell lines in which the DNase clusters were observed is shown in Figures 1, 2, 3 as well as in the Figures S1, S2, S3. Histone marks are included in Figures 1, 2, 3 and Figures S1, S2, S3 but only those delineated in cell lines related to T cell and monocytes: a lymphocyte cell line (GM12878), a lymphoblastoid cell line, and K562, an erythroleukemia cell line.
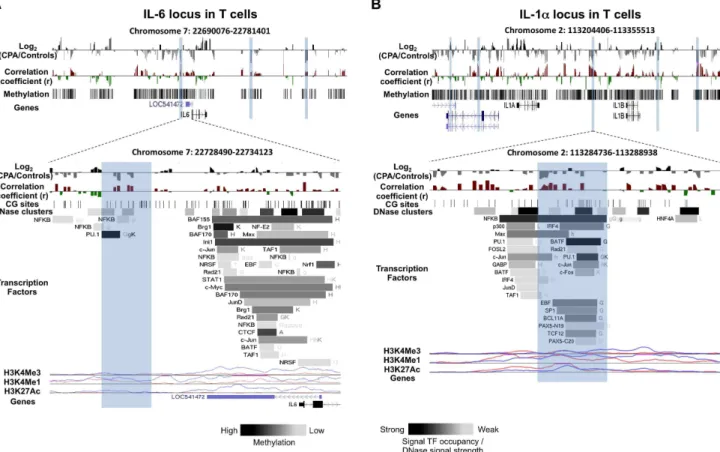
Figure 1. DNA methylation differences between CPA (n = 8) and control (n = 12) groups in pro-inflammatory cytokines IL-6 and IL-1a
loci in T cells.Expanded views from the UCSC genome browser of IL-6 (A) and IL-1a(B) loci located on chromosomes 7 and 2 are depicted (top
panel). In both panels, the first track shows the average MeDIP probe log2-fold differences (scale top panel:20.4 to 0.4, botom panel:21.0 to 1.0)
between chronic physical aggressive (CPA) and control groups for T cells. In black are probes that are more methylated and in gray are those that are less methylated in the CPA group. Highlighted in blue are regions significantly differentially methylated between the groups. The second track shows
Pearson’s correlation coefficient values (scale top panel:20.4 to 0.4, botom panel:20.7 to 0.7) calculated between the MeDIP microarray probe
intensities and the plasma IL-6 (A) and IL-1a(B) levels obtained from the same subjects (n = 20). In red are probes whose methylation levels correlate
positively with the cytokine level in plasma and in green are those that correlated negatively. In the top panel, the lowest track shows the average methylation level for all the subjects in T cells estimated from the microarray data. The bottom panel zooms on the closest region upstream of the
TSS where the CPA group is found significantly less methylated than the control group in the IL-6 (A) and IL-1a(B) loci. In both regions, an overall
positive correlation between methylation and cytokine level in plasma is observed but only reached significance after correcting for multiple testing
in IL-1a(B) differentially methylated region. The regulatory elements from ENCODE identified in these regions (see methods) are shown in the
additional tracks. First, shown with black lines, is the location of individual CpG sites. Second, is the location of DNase hypersensitive clusters where black indicate strong signal and grey a weaker signal from ChIP-seq data in 24 cell lines. Third is the location of transcription factors (TF) identified from ChIP-seq data in 24 cell lines where black indicate a strong and grey weaker signal occupancy. The letter next to the TF boxes identified the cell line where it was found enriched (see Table S1 for the full legend). The last tracks, identified the level of enrichment of three histone marks determined from ChIP-seq assay, histone 3 lysine 4 tri- and mono-methylation as well as histone 3 lysine 27 acetylation in two cell lines, GM12878 (pink) and K562 [106].
doi:10.1371/journal.pone.0071691.g001
DNA Methylation in Cytokine Genes and Aggression
In several examples enrichment of particular histone marks coincides with differential methylation associated with CPA. The H3K4Me1 histone mark is mainly associated with enhancers and with DNA regions downstream of transcription start sites whereas H3K4Me3 is mainly associated with promoters and enhancers that are active or poised to be activated [71]. The H3K27Ac mark is thought to enhance transcription possibly by blocking the spread of the repressive histone mark H3K27Me3 [72].
Associations between Differentially Methylated Regions and Cytokine Levels
Using previously measured cytokine protein levels in the same set of males [32], we were able to test for associations between
DNA methylation and cytokine levels. Of the 48 differentially methylated regions associated with aggression, 7 regions were significantly correlated with cytokine levels encoded by the closest genes in blood plasma (FDR,0.2; Table 1). All but two were positively correlated with the cytokine levels in blood.
The differentially methylated region associated with aggression closest to a cytokine transcription start site was located 2042 bp upstream of the pro-inflammatory cytokine IL-6 and was less methylated in the CPA group compared to controls in T cells (Figure 1A and Figure S1). This region contains a DNAse hypersensitive site and a peak of H3K4Me1 in the two lymphocytes cell lines that were studied in the ENCODE project. Interestingly, this region also coincides with the binding sites of
Figure 2. DNA methylation differences between CPA (n = 8) and control (n = 12) groups in anti-inflammatory cytokines 4 and IL-10 loci in T cells.Expanded views from the UCSC genome browser of IL-4 (A) and IL-10 (B) loci located on chromosomes 5 and 1 are depicted (top
panel). In both panels, the first track shows the average MeDIP probe log2-fold differences (scale top panel:20.4 to 0.4, botom panel:21.0 to 1.0)
between chronic physical aggressive (CPA) and control groups are shown for T cells. In black are probes that are more methylated and in gray are those that are less methylated in the CPA group. Highlighted in blue are regions significantly differentially methylated between the groups in T cells
for IL-4 (A) and IL-10 (B). The second track shows Pearson’s correlation coefficient (scale top panel:20.4 to 0.4, botom panel:20.7 to 0.7) calculated
between the MeDIP microarray probe intensities and the plasma IL-4 (A) and IL-10 (B) levels obtained from the same subject (n = 20). In red are
probes whose methylation levels correlate positively with the cytokine level in plasma and in green are those that correlated negatively. In the top
panel, the last track shows the average methylation level for all the subjects in T cells for IL-4 (A) and IL-10 (B) estimated from the microarray data.
The bottom panel shows differentially methylated regions located within known Th2 LCRs where the CPA group is found significantly less methylated
than the control group in the IL-4 locus (A) and significantly more methylated in the IL-10 locus (B). For the first differentially methylated region in
IL-4, an overall positive correlation between methylation and IL-4 level in plasma is observed but did not reach significance after correcting for multiple
testing (A, bottom panel). In the region more methylated in the CPA group of the IL-10 locus (B, bottom panel), the overall correlation with IL-10 level
in plasma is negative although not significant after corrections for multiple testing. The regulatory elements from ENCODE identified in these regions (see methods) are shown in the additional tracks. First, shown with black lines, is the location of individual CpG sites. Second, is the location of DNase hypersensitive clusters where black indicate strong signal and grey a weaker signal from ChIP-seq data in 24 cell lines. Third is the location of transcription factors (TF) identified from ChIP-seq data in 24 cell lines where black indicate a strong and grey weaker signal occupancy. The letter next to the TF boxes identified the cell line where it was found enriched (see Table S1 for the full legend). The last tracks, identified the level of enrichment of three histone marks determined from ChIP-seq assay, histone 3 lysine 4 tri- and mono-methylation as well as histone 3 lysine 27 acetylation in two cell lines, GM12878 (pink) and K562 [106].
doi:10.1371/journal.pone.0071691.g002
DNA Methylation in Cytokine Genes and Aggression
Table 1.Differentially methylated regions between CPA (n = 8) and control (n = 12) groups and correlation with cytokine levels in plasma.
Gene locus Distance from TSS (kb) More methylated in Pearson’s correlation coefficient R (FDR) Transcription factors (ENCODE)
DNase cluster (ENCODE)
Monocytes T cells Monocytes T cells
24 Control NFkB, PU.1 yes
IL-6 18 CPA Control – yes
35 Control Control 0.5 (0.08) NRSF yes
+33.5 CPA – yes
21 Control Pbx3 yes
19 Control Control PU.1 yes
7 Control – –
224 Control 0.45 (0.07) CEBPB yes
IL-1a 226 Control 0.52 (0.14) NFkB, Max, C-Jun, FOSL2, EBF, SP1, BATF,
IRF4, BCL11A, JunD, Pax5, TAF1, TCF12, Rad21, c-Fos, PU.1
yes
240 Control – –
244.5 Control – yes
246.5 Control NFkB, EBF, Pbx3, BCL11A, TCF12 yes
249.5 CPA – –
260.5 CPA Control 20.58 (0.02) – yes
281 Control 0.8 (0.1) – –
240 CPA – yes
236.5 CPA c-Myc, BAF155, STAT1, JunD yes
229.5 CPA – –
227 CPA 20.53 (0.07) – yes
IL-8 219 CPA c-Jun, JunD yes
216.5 CPA – yes
8 Control – –
+13.5 CPA – yes
17 Control – yes
32 CPA PU.1 yes
36 Control 0.6 (0.06) c-Jun, GR yes
235 Control NFkB yes
Th2 LCR
231.5 Th2 LCR Control NFKB, BCL3, SP1, EBF, IRF4, POU2F2,
BCL11A, EBF, p300, BATF
yes
216.5 Control PU.1, Rad21, NFkB, CTCF, EBF, BCL3 yes
IL-4 +3 (Intron 2) Control c-Jun, BAF155, BAF170, Brg1, Ini1, NFkB,
CTCF, GR, TAF-1, JunD
yes
DNA
Methyla
tion
in
Cytokine
Genes
and
Aggressio
n
PLOS
ONE
|
www.ploson
e.org
5
August
2013
|
Volume
8
|
Issue
8
|
Table 1.Cont.
Gene locus Distance from TSS (kb) More methylated in Pearson’s correlation coefficient R (FDR) Transcription factors (ENCODE)
DNase cluster (ENCODE)
Monocytes T cells Monocytes T cells
+8 (Intron 3) Control NFkB, SREBP2 yes
+23.5 CPA SREBP1 –
27 CPA – –
+31.5 Control SREBP1 yes
+34.5 CPA – –
37 Control – –
43 Control PU.1 yes
42 CPA GR yes
7 Control – –
IL-8 6 Th2 LCR CPA Pol2, miRNA, NFkB, ZNF263, IRF4, BCL11A,
PU.1, EBF, BATF, PAX5, SP1, POU2F2, JunD, FOSL2, Rd21
yes
4 CPA NFkB, EBF, BATF, BCL11A, TCF12, Max, IRF4, BCL3,
PAX5, SP1
yes
216 Control BCL3, Pbx3 yes
223 CPA NfkB, BAF170 yes
237 CPA NFkB, CTCF, CEBPB, JunD, RAD21, STAT1 yes
In bold are regions that are illustrated in Figures 1, 2 and 3. doi:10.1371/journal.pone.0071691.t001
DNA
Methyla
tion
in
Cytokine
Genes
and
Aggressio
n
PLOS
ONE
|
www.ploson
e.org
6
August
2013
|
Volume
8
|
Issue
8
|
transcription factors PU.1 and NFkB. PU.1 is known to act as both a repressor and activator of several cytokine genes [73] and has been proposed to be involved IL-6 expression [74]. Moreover, this IL-6 upstream region has been previously reported to have basic transcriptional activity in gene reporter luciferase assays [75]. A second region less methylated in the T cells of CPA individuals compared to controls was located in the IL-1a locus (Figure 1B and Figure S1B), located 27 Kb upstream of IL-1a. The region is of interest because its methylation levels are significantly correlated with IL-1a levels (R = 0.52; FDR,0.14), and it contains many regulatory elements identified by ENCODE (Figure 1B bottom, highlighted in blue). These include a DNase hypersensitive site, H3K4Me1 and H3K27Ac enrichment peaks and several
tran-scription factor-binding sites, including those of both activators and repressors. Transcription factors BATF, NFkB and PU.1 have the strongest binding signal in this region.
In the locus of IL-4, we identified ten regions that were differentially methylated between CPA and controls, three of these regions were found in T cells. Two of these regions that are less methylated in the T cells of CPA individuals, contain several ENCODE regulatory elements (Figure 2A bottom, Figure S2A), including a DNase hypersensitive cluster, enrichment for histone marks H3K4Me3 and H3K27Ac, and several transcription factor binding sites (Figure 2A bottom, highlighted in blue). Theses regions are located in the Th2 cytokine Locus Control Region (LCR) known to regulate the expression of IL-4 locus.
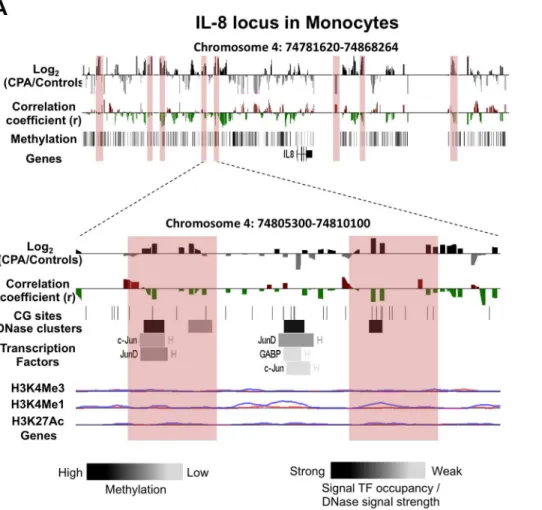
Figure 3. DNA methylation differences between CPA (n = 8) and control (n = 12) groups in pro-inflammatory chemokine IL-8 locus in monocytes.Expanded views from the UCSC genome browser of IL-8 (A) locus located on chromosomes 4 is depicted (top panel). In both panels,
the first track shows the average MeDIP probe log2-fold differences (scale top panel:20.4 to 0.4, botom panel:21.0 to 1.0) between chronic physical
aggressive (CPA) and control groups are shown for monocytes. In black are probes that are more methylated and in gray are those that are less methylated in the CPA group. Highlighted in red are regions significantly differentially methylated between the groups. The second track shows
Pearson’s correlation coefficient (scale top panel:20.4 to 0.4, botom panel:20.5 to 0.5) calculated between MeDIP microarray probe intensities (DNA
methylation levels) and the plasma IL-8 levels obtained from the same subject (n = 20). In red are probes whose methylation levels correlate positively with the cytokine levels in plasma and in green are those that correlated negatively. In the top panel, the last track shows the average methylation level for all the subjects in monocytes estimated from the microarray data. The bottom panel shows the closest region upstream of the TSS where the CPA group is found significantly less methylated than the control group in the IL-8 locus. In both regions, an overall negative correlation between methylation and cytokine level in plasma is observed but did not reach significance after correcting for multiple testing. The regulatory elements from ENCODE identified in these regions (see methods) are shown in the additional tracks. First, shown with black lines, is the location of individual CpG sites. Second, is the location of DNase hypersensitive clusters where black indicate strong signal and grey a weaker signal from ChIP-seq data in 24 cell lines. Third is the location of transcription factors (TF) identified from ChIP-seq data in 24 cell lines where black indicate a strong and grey weaker signal occupancy. The letter next to the TF boxes identified the cell line where it was found enriched (see Table S1 for the full legend). The last tracks, identified the level of enrichment of three histone marks determined from ChIP-seq assay, histone 3 lysine 4 tri- and mono-methylation as well as histone 3 lysine 27 acetylation in two cell lines, GM12878 (pink) and K562 [106].
doi:10.1371/journal.pone.0071691.g003
DNA Methylation in Cytokine Genes and Aggression
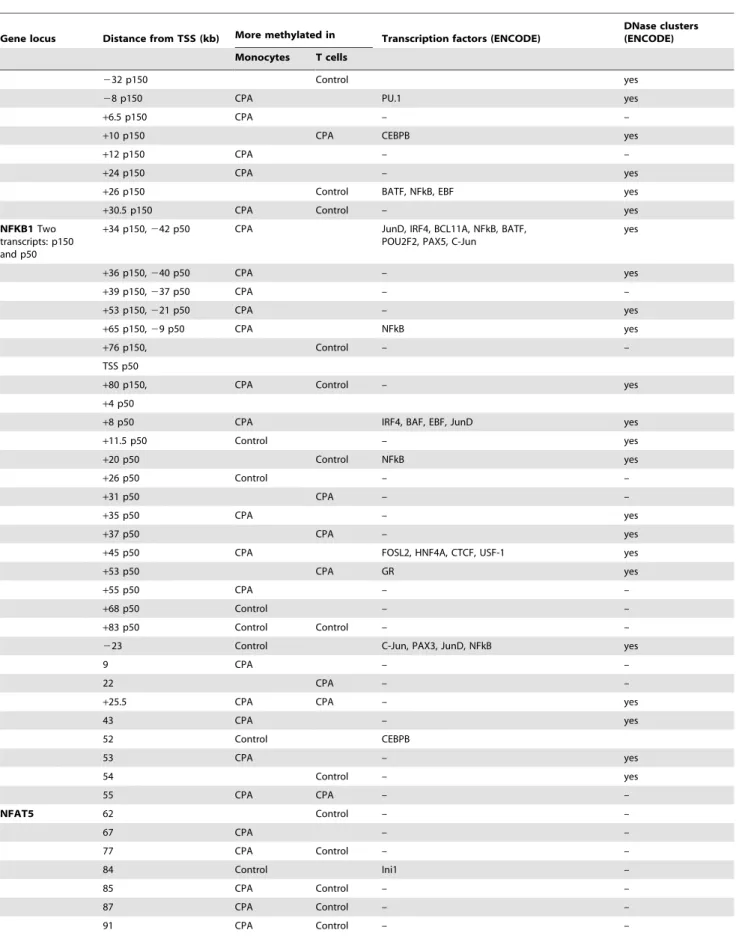
Table 2.Differentially methylated regions between CPA (n = 8) and control (n = 12) groups identified in the loci of three transcription factors known to regulate cytokines.
Gene locus Distance from TSS (kb) More methylated in Transcription factors (ENCODE)
DNase clusters (ENCODE)
Monocytes T cells
232 p150 Control yes
28 p150 CPA PU.1 yes
+6.5 p150 CPA – –
+10 p150 CPA CEBPB yes
+12 p150 CPA – –
+24 p150 CPA – yes
+26 p150 Control BATF, NFkB, EBF yes
+30.5 p150 CPA Control – yes
NFKB1Two
transcripts: p150 and p50
+34 p150,242 p50 CPA JunD, IRF4, BCL11A, NFkB, BATF, POU2F2, PAX5, C-Jun
yes
+36 p150,240 p50 CPA – yes
+39 p150,237 p50 CPA – –
+53 p150,221 p50 CPA – yes
+65 p150,29 p50 CPA NFkB yes
+76 p150, Control – –
TSS p50
+80 p150, CPA Control – yes
+4 p50
+8 p50 CPA IRF4, BAF, EBF, JunD yes
+11.5 p50 Control – yes
+20 p50 Control NFkB yes
+26 p50 Control – –
+31 p50 CPA – –
+35 p50 CPA – yes
+37 p50 CPA – yes
+45 p50 CPA FOSL2, HNF4A, CTCF, USF-1 yes
+53 p50 CPA GR yes
+55 p50 CPA – –
+68 p50 Control – –
+83 p50 Control Control – –
223 Control C-Jun, PAX3, JunD, NFkB yes
9 CPA – –
22 CPA – –
+25.5 CPA CPA – yes
43 CPA – yes
52 Control CEBPB
53 CPA – yes
54 Control – yes
55 CPA CPA – –
NFAT5 62 Control – –
67 CPA – –
77 CPA Control – –
84 Control Ini1 –
85 CPA Control – –
87 CPA Control – –
91 CPA Control – –
DNA Methylation in Cytokine Genes and Aggression
Three differentially methylated regions associated with aggres-sion lie within 10 Kb downstream of the IL-10 transcription start site. Two regions are differentially methylated in T cells the first (+6 Kb) is more methylated in CPA individuals whereas the second (+7 Kb) is less methylated. The third difference lies in the 39UTR of IL-10 and is more methylated in monocytes of CPA individuals (Figure 2B and Figure S2B). Only the first region (+6 Kb) contains several of the ENCODE regulatory elements (Figure 2B bottom, highlighted in blue), including a strong DNase hypersensitive cluster, enrichment for histone marks and several transcription factor binding sites. Interestingly, this region was previously found to have promoter/enhancer activity in Th2 cells and was proposed to function as a LCR for the IL-10 gene locus [76].
The IL-8 locus contains eight regions differentially methylated between CPA and controls in monocytes and three in T cells (Figure 3A and Figure S3). Since IL-8 is mainly expressed in monocytes, we focused on two regions more methylated in monocytes of CPA individuals that are 16 Kb and 19 Kb upstream of IL-8, respectively (Figure 3A bottom, highlighted in red). Both regions, though located far from the gene promoter, were found to include a strong DNase hypersensitive cluster, and the second region contained a small H3K4Me1 peak in the K652 cell lines. Interestingly, binding sites of transcriptional activators c-Jun and c-JunD were identified in the first region. C-c-Jun and c-JunD are both part of the AP-1 transcriptional complex, a well-known activator of many genes including cytokines [77].
Associations of DNA Methylation with Physical
Aggression in the Loci of Transcriptional Regulators of Differentially Expressed Cytokines
The microarray used in this study included the genomic loci of three transcription factors, NFkB1, NFAT5 and STAT6 that are
classical regulators of the cytokines analyzed above. Differentially methylated regions between the CPA and control groups were identified throughout the loci in both cell types analyzed (Table 2) with both increased and decreased methylation levels in CPA individuals compared to controls. Each locus had at least ten differentially methylated regions (,1000 bp, log2-fold.0.5, FDR
,0.2). Similarly to the cytokine loci, the locations of some differentially methylated regions associated with aggression coin-cided with the location of regulatory regions such as the promoters (as defined earlier22000 bp to 1000 bp of TSS) of both STAT6 isoforms as well as in the NFkB1 short transcript (p50) that were more methylated in the CPA group (Table 2). We found 37 differentially methylated regions associated with CPA within the NFkB locus, 21 of these regions were located within the gene body (Figure S4). In the NFAT5 locus, 19 differentially methylated regions between CPA and controls were identified and all of them except one were located within the body of the gene (Figure S5). A total of 10 regions were identified in STAT6 locus, two of the differentially methylated regions associated with CPA were found in T cells and all other differentially methylated regions associated with CPA in STAT6 were found in monocytes (Figure S6).
As we did for the cytokine genes, we examined whether the differentially methylated regions associated with aggression con-tained previously published transcription factor (TF) binding sites, DNase hypersensitive clusters and enrichment for histone modi-fications H3K4Me1, H3K4Me3 and H3K27Ac using the ENCODE database (http://genome.ucsc.edu/ENCODE/). We found that most of the differentially methylated regions associated with CPA identified in NFkB1 and STAT6 loci in both cell types were located within DNase hypersensitive clusters, transcription factors binding sites and H3K4Me1, H3K4Me3 and H3K27Ac peaks, supporting a regulatory role for these regions (Table 2 and Figures S4 and S6). In contrast, only a few differentially
Table 2.Cont.
Gene locus Distance from TSS (kb) More methylated in Transcription factors (ENCODE)
DNase clusters (ENCODE)
Monocytes T cells
112 CPA Control – –
128 CPA – –
136 CPA – –
+53 isoform 2 CPA NFkB yes
+25 isoform 2 CPA HEY1, Brg1, TAF1, C-Myc, NFkB, STAT2, Max, BAF155, Ini1, STAT1, Pu.1, BAF170
yes
+20 isoform 2 Control Ini1 yes
+6 exon 8 to 10 isoform 2 Control – yes
+3 exon 1 isoform 2 Control – yes
STAT6Two
transcripts: isoform 1 and isoform 2
TSS isoform 2,+18
isoform 1
CPA C-Myc, max, NFkB, brg1, BAF170, STAT1,
BAF155, TAF1, Ini1, P1, POUF2L2, BCL3, PU.1, IRF4, PAX5, HEY1, CEBPB, EBF, TCF12, NRSF
yes
21.5 isoform 1 CPA HNF4, CEBPB, FOSL2, RXRA, p300, BHLHE40,
JunD, ERRA, USF-1, NFkB
yes
210 isoform 1 Control HNF4, CEBPB, FOSL2, BAF155, p300, HEY1, RXRA, JunD
yes
214 isoform 1 Control – yes
223 isoform 1 Control – yes
In bold are regions that are illustrated in Figures 4. doi:10.1371/journal.pone.0071691.t002
DNA Methylation in Cytokine Genes and Aggression
methylated regions between CPA and controls in NFAT5 locus were located within regulatory elements. None of the regions were located within CpG islands.
The methylation profile of the STAT6 locus in T cells is illustrated in Figure 4. Two regions in this locus are more methylated in the T cells of CPA individuals compared to controls (Figure 4A and Figure S6, highlighted in blue). The first region is located at the transcription start site of the STAT6 isoform 2 gene (Figure 4 left bottom panel), and the second region is located 1 Kb upstream of STAT6 isoform 1 (Figure 4 right bottom panel). Both regions coincide with DNase hypersensitive clusters and many transcription factor binding sites such as IRF4, HEY1 and NFkB. Enrichment for H3K4Me3 and H3K27Ac marks were found in the first region (TSS isoform 1) in both cell lines whereas only a small peak of H3K4Me1 enrichment was found in the second region in the GM12878 cell line.
We have further confirmed the methylation differences between CPA and control groups and correlation with the cytokine levels in plasma in regions within the IL-6, IL-8 and STAT6 loci by pyrosequencing (Figure 5A, 5B and 5C; see Methods). Intrigu-ingly, we note that the pyrosequencing methylation levels in
STAT6gene are significantly associated with IL-4 levels in plasma.
Discussion
Several lines of evidence suggest that cytokines are associated with animal and human aggression [78–80] and IL-6 was causally linked to aggression in mice by gene knockout evidence [31]. Our analyses of males whose level of aggression were followed for a 22 year period revealed an association between cytokine levels in plasma and chronic physical aggression: young adult men with a history of chronic physical aggression during childhood have lower baseline concentrations of two pro (IL-1a, IL-6 and IL-8) and two
Figure 4. DNA methylation differences between CPA (n = 8) and control (n = 12) groups in cytokine’s transcription factor STAT6 in T cells.Expanded views from the UCSC genome browser of STAT6 (A) locus located on chromosomes 12 is depicted (top panel). In both panels, the
first track shows the average MeDIP probe log2-fold differences (scale top panel:20.4 to 0.4, botom panel:21.0 to 1.0) between chronic physical
aggressive (CPA) and control groups for T cells. In black are probes that are more methylated and in gray are those that are less methylated in the CPA group. Highlighted in blue are regions significantly differentially methylated between the groups. The second track shows Pearson’s correlation
coefficient (scale top panel:20.4 to 0.4, botom panel:20.6 to 0.6) calculated between MeDIP microarray probe intensities and the plasma IL-4 (first)
and IL-10 (second) levels obtained from the same subject. These correlations did not reach significance after correcting for multiple testing in T cells. In red are probes whose methylation levels correlate positively with the cytokine level in plasma and in green are those that correlated negatively. In the top panel, the last track shows the average methylation level for all the subjects in T cells estimated from the microarray data (n = 20). The bottom panel shows the two regions close to the TSS of each STAT6 isoform where the CPA group is found significantly more methylated than the control group. The regulatory elements from ENCODE identified in these regions (see methods) are shown in the additional tracks. First, shown with black lines, is the location of individual CpG sites. Second, is the location of DNase hypersensitive clusters where black indicate strong signal and grey a weaker signal from ChIP-seq data in 24 cell lines. Third is the location of transcription factors (TF) identified from ChIP-seq data in 24 cell lines where black indicate a strong presence and grey weaker signal occupancy. The letter next to the TF boxes identified the cell line where it was found enriched (see Table S1 for the full legend). The last tracks, identified the level of enrichment of three histone marks determined from ChIP-seq assay, histone 3 lysine 4 tri- and mono-methylation as well as histone 3 lysine 27 acetylation in two cell lines, GM12878 (pink) and K562 [106]. doi:10.1371/journal.pone.0071691.g004
DNA Methylation in Cytokine Genes and Aggression
anti (IL-4 and IL-10) -inflammatory cytokines than comparable young adult men without a history of chronic physical aggression during childhood [32]. Here we show data that is consistent with the hypothesis that DNA methylation could be part of the mechanisms responsible for differences in cytokine levels in the chronic aggression group. Indeed, we found differentially meth-ylated regions to associate with CPA in both the cytokine loci as well as in their transcription factors loci analyzed. Some of these differentially methylated regions found in IL-6, IL-4, IL-10, STAT6 and NFkB were located in known regulatory regions whereas others, to our knowledge, were previously unknown as regulatory areas. However, using the ENCODE database, we were able to identify key regulatory elements in many of these regions that indicate that they might be involved in the regulation
of cytokine expression. Further work will be needed to investigate the exact role of these new candidate regulatory regions in the regulation of transcription of these genes and particularly in the context of problems with regulation of physical aggression during childhood.
Interestingly, four of our differentially methylated regions associated with aggression were located within known cytokines regulatory regions. Particularly, three regions lie within Th2 cytokines LCRs, two in the IL-4 loci and one in the IL-10 loci. These LCRs have been shown to have enhancer/insulator activity in Th2 cell differentiation [44,76,81]. Changes in chromatin remodeling and DNA methylation in this region are involved in regulating expression of IL-4 and IL-13 during Th2 differentiation [44,81]. It was previously proposed that DNA demethylation is
Figure 5. Pyrosequencing analyses of differentially methylated sequences in T cells and monocytes between CPA (n = 8) and control (n = 12) groups.DNA methylation differences (%) between the aggressive groups in the IL-6 (A), IL-8 (B) and STAT6 (C) genes as determined by pyrosequencing. CpG sites near the significant probes were analyzed in triplicate. For each gene, the mean methylation per group per CpG with the standard error of the mean (SEM) are shown in the bar graph (top panel). The rightmost bar indicates the mean methylation levels of all CpG sites analyzed in the region. A map of the sites relative to the transcription start site is shown above the bar graph. Each line with a circle represents a CpG site. The location of probes which fold difference is significantly different between the groups is identified by a grey square where dark and light grey indicated more or less methylated in the CPA group respectively. Red arrows delimit the region analyzed by pyrosequencing. Correlations between mean methylation levels obtained by pyrosequencing for each gene and expression levels in plasma obtained by ELISA for each cytokine [32] is shown in the bottom panel. Correlation statistics were performed using Pearson correlation. All error bars represent standard
error of the mean (SEM). The symbol ‘#’ denotes a p-value#0.1 and the symbol ‘*’ denotes a p-value#0.05 as determined by a Studentt-test.
doi:10.1371/journal.pone.0071691.g005
DNA Methylation in Cytokine Genes and Aggression
required for the maintenance of IL-4 LCR enhancer activity in Th2 differentiated cells [81]. STAT6 transcription factor was also shown to be required for the remodeling of this LCR during Th2 cell differentiation [81]. We observed in the same region lower methylation in the CPA individuals in T cells and overall lower IL-4 plasma levels compared to controls (Figure 2A). Since we did not examine the methylation levels in specific T cells subpopulations, we don’t know what this demethylation in CPA individuals means in term of Th2 LCR activity. The fact that it occurs in this important regulatory region suggests however that the activity of the IL-4 locus might be altered in individuals with history of chronic physical aggression during childhood. On the other end, we found higher methylation in the promoter of STAT6 genes in the CPA individuals (Table 2). STAT6 is a well-known regulator of IL-4 in T cells, specifically in Th2 differentiating cells. As mentioned earlier, it can induce expression of IL-4 by interacting with the Th2 LCR [81] but also by activating the expression of the transcription factor GATA-3 that bind directly to the IL-4 promoter [82]. The methylation differences observed in the promoter of isoform 2 as well as in intron 1 of isoform 1 were validated by pyrosequencing. Intriguingly, we note that the pyrosequencing methylation levels inSTAT6gene are significantly associated with IL-4 levels in plasma, further supporting a regulatory role for these sites in regulation of IL-4 by STAT6. This is consistent with the hypothesis that increased methylation leads to a decrease in STAT6 expression and that could lead to reduced activation of IL-4 locus and lower levels in plasma.
DNA methylation analyses were not previously performed for the LCR in IL-10 locus but it stands to reason that as the LCR in IL-4 locus, DNA demethylation is needed for the maintenance of this LCR functionality. The LCR in IL-10 locus was found more methylated in the CPA individuals compared to controls. These results are consistent with the hypothesis that higher methylation in T cells in this region may account, in part, for the decreased in IL-10 expression observed in the plasma of the CPA group. Similarly, IL-8 results are consistent with the hypothesis that higher methylation in CPA individuals reduces IL-8 expression levels by inhibiting binding of transcriptional activators.
In, IL-1a, IL-6 and IL-4 LCRs our study delineated regions with lower methylation in T cells in CPA individuals who also show lower levels of these cytokines in plasma (Figure 1A, 1B and 2A bottom, highlighted in blue). These results might be consistent with the hypothesis that lower methylation in these regions permits more frequent binding of a putative repressor leading to the decreased IL-4, IL-6 and IL-1a expression. Indeed, there is evidence that increased DNA methylation of certain regions is associated with increased gene expression. For example, DNA methylation in a repressor-binding site of the multidrug-resistance gene (MDR-1) enhancer was shown to increase its expression [83]. Another example is the H19/IGF2R imprinted control regions (ICR). Methylation of the ICR on the paternal allele prevents H19 activity but allows IGF2 activity whereas hypomethylation on the maternal allele allows H19 activity but prevents IGF2 activity [84]. These hypotheses on the effect of DNA methylation on cytokine genes expression need to be testedin vitroas well asin vivoas the data presented here only reveal associations but do not provide causal relationships between the differentially methylated regions and expression.
Our results also point to the value of locus-wide analysis of DNA methylation. Most studies are limited to promoter regions. Had we used this approach here we would have missed most or all of the differentially methylated regions that we had identified in this study. Many of which contain high concentration of regulatory signals. This suggests that many of the published failures in
identification of differentially methylated regulatory regions might be a consequence of limiting the analyses to known promoter regions.
Taken together the fact that a high fraction of the differentially methylated regions between the CPA and control groups were localized in either known regulatory regions or regions that were independently shown to contain a high concentration of regulatory chromatin marks, DNase hypersensitivity and transcription factors, supports the hypothesis that they are involved in differential regulation of cytokine expression between CPA and control groups. Indeed, several methylated regions located within the cytokine loci were found to significantly correlate with cytokine levels in plasma.
Although our list of differentially methylated regions associated with CPA is comprehensive it is still possible that additional differentially methylated regulatory regions exist in these loci that were not discovered in our analysis. The small sample size could result in loss of power to detect additional significant correlations. In addition, the associations of differentially methylated regions and cytokine expression delineated here are probably an underestimation since we have used plasma cytokine levels rather than transcription rates as a measure of cytokine expression. There are many steps in between initiation of transcription at the promoter and cytokine levels in plasma. Unfortunately, the study design did not allow us to isolate high quality RNA because it was difficult to request that the subjects come to the lab for their blood perfusion, particularly with the chronic aggression group, resulting in a delay between cell harvest and RNA processing. In addition, DNA methylation and expression are fundamentally different measures of cell functional states. DNA methylation levels directly correspond to the number of cells with a methylated/unmethy-lated cytosine (as a state of methylation of an allele in a particular site is a binary count, in a given cell a site is either methylated or not) whereas protein and mRNA levels are analog measures that average the number of mRNA and protein molecules produced by the cell population. A low level of mRNA or protein measure could indicate either high level of expression in a few cells or low level of expression in many cells.
Several methodological considerations arise in our study. First, with blood available only in adulthood, we cannot establish when during development chronic physical aggression became associat-ed with these particular DNA methylation alterations and cytokine level reduction in plasma. Based on the longitudinal data obtained from this cohort, we can expect that DNA methylation changes appear early in life as chronic physical aggression trajectories usually start in infancy and are associated with numerous factors during the prenatal and early postnatal periods [5]. However, it stands to reason that there is a developmental trajectory of these DNA methylation changes and that changes seen in adults will not be identical to the early changes seen in aggressive children. The second issue relates to cause and effect. We have demonstrated here a highly significant association between DNA methylation alterations and CPA. These changes could be either a cause or an effect of CPA life style. The issue of causality is particularly difficult in human studies although a parallel longitudinal analysis of behavioral and DNA methylation changes could have established at least the temporal relationship between differential DNA methylation of cytokines and aggressive behavior. In addition, childhood abuse or neglect is also known to increase the risk of aggression in adolescents and adults [85] and was also found to associate with DNA methylation differences [59]. Therefore, it is possible that child abuse acts as a third factor in explaining the reported association between aggression and DNA methylation.
DNA Methylation in Cytokine Genes and Aggression
Neuroendocrine-immunological abnormalities that are estab-lished during a stressful childhood are thought to mediate the development of the pro-inflammatory phenotype in adulthood [33,34] including reduced cortisol awakening response [86]. This could result in altered expression of certain cytokine levels in plasma, since cortisol levels are known to regulate immune and inflammatory responses. For example, stress has been shown to promote the expression of certain cytokines [87], correlations were found between reduced cortisol and increased aggression in adolescents and young men [88–90], and maltreatment in childhood was shown to lead to low basal cortisol in association with conduct and aggressive disorders [91]. However, the associations between stress, cortisol, cytokines and aggression are complex since opposite results have also been reported. Indeed, glucocorticoids produced by the adrenal gland are strong immunosupressors known to directly repress the expression of many cytokines in leucocytes including the cytokines examined here. For example, a study of the males from the present study during adolescence, reported that high cortisol levels were associated with high levels of aggression [92]. Therefore, both hyper- and hypo-active stress responses have been shown to associate with aggression [93].
Unfortunately, although our cohort was longitudinal and behavioral data was longitudinally collected from childhood, DNA from blood cells were collected only once the participants in the study reached adulthood. Future longitudinal studies should address these questions. Second, the results are based on a small sample of chronic aggressive subjects. The two longitudinal studies we used to recruit our subjects from had followed more than 1 000 males from childhood to adolescence. Young adult Caucasian males with a history of chronic physical aggression during childhood are relatively rare [11] and even more difficult to recruit for biological sampling. Thus, the limited numbers are an inherent property of the trait that we are examining. However replications of the present study with other longitudinal samples are obviously needed and should address this issue in part although we don’t expect a large number of CPA subjects in these future studies as well. In any case, the subgroup that was available for the DNA methylation analysis did not differ in its basic behavioral and socioeconomic characteristics from the original group (Table 3). Third, although we ruled out several of the most common confounders, there are some confounders that are tightly correlated with aggression. Cytokine levels as well as DNA methylation were previously associated with psychiatric diseases such as major depression [94], nevertheless the CPA and control groups were not significantly different in levels of anxiety and presence of psychiatric diagnoses as well as age. However, the CPA and control groups were significantly different with respect to variables that are also known to be strongly associated with chronic physical aggression trajectories from childhood to adolescence: childhood hyperactivity and opposition and adult-hood criminal behavior [6,11]. Thus, it is impossible to determine whether the differential DNA methylated regions that we identified associate with aggressiveness or hyperactivity and criminal behavior. This however might be reflecting the simple fact that these behaviors are molecularly and functionally linked within the same biological pathways.
Conclusions
This study has several implications. Taken together the data is consistent with the hypothesis that cytokines are involved in chronic physical aggression, hence that a peripheral immune component may play a key role in regulating these behavioral states. The results suggest that in addition to differential
Table 3. Characteristics of the chronic physical aggression (CPA) group and control group in the original sample (1) and the selected sample (2) for the methyl ation analysis. Variables Control CPA Group effect Mean ± SD or % (n) Mean ± SD or % (n) Sample 1 Sample 2 Sample 1 Sample 2 Sample 1 Sample 2 Age at blood perfusion 25.64 6 2.08 (25) 25.4 6 2.71 (12) 25.28 6 2.75 (7) 25.8 6 2.87 (8) t (30) = 0.37, P= 0.71 t (18) = 2 0.26, P= 0.80 Familial adversity C E 0.34 6 0.30 (25) 0.34 6 0.29 (12) 0.44 6 0.42 (7) 0.51 6 0.41 (7) t (29) = 2 0.73, P= 0.47 t (17) = 2 1.06, P = 0.31 Psychiatric record (21 years) 33% (7/21) 60% (6/10) 43% (3/7) 43% (3/7) F exact, 2 tailled: 0.67 F exact, 2 tailled: 0 .64 Criminal record (21 years) 20% (5/25) 17% (2/12) 71% (5/7) 75% (6/8) F exact, 2 tailled: 0.02 F exact, 2 tailled: 0.019 Self reported violence (21 years) 10% (2/20) 10% (1/10) 57% (4/7) 57% (4/7) F exact, 2 tailled: 0.02 F exact, 2 tailled: 0 .10 Hyperactivity (6 to 15 years) 1.20 6 0.96 (25) 0.91 6 1.03 (12) 2.43 6 1.27 (7) 2.47 6 1.20 (8) t (30) = 2 2.79, P = 0.009 t(18) = 2 3.11, P = 0 .006 Oppositional d isorder (6 to 15 years) 2.16 6 1.86 (25) 2.19 6 1.92 (12) 8.43 6 7.00 (7) 8.14 6 6.71 (8) t (6.2) = 2 2.35, P= 0.06 t(18) = 2 2.93, P = 0 .009 Anxiety (6 to 15 years) 3.36 6 1.93 (25) 3.35 6 1.81 (12) 3.43 6 1.51 (7) 3.48 6 1.45 (8) t (30) = 2 0.09, P= 0.93 t (18) = 2 1.62, P = 0.87 Attention d eficit (6 to 15 years) 3.2 6 2.22 (25) 3.23 6 2.18 (12) 4.00 6 2.00 (7) 4.00 6 1.89 (8) t (30) = 2 0.86, P= 0.40 t (18) = 2 0.81, P = 0.43
C EInclude
mother and father occupational score, familial status (monoparental vs biparental), mother and father age at b irth of first child and the yea rs of schooling o f the mother and father. doi:10.1371/jo urnal.pone.0071691.t003
DNA Methylation in Cytokine Genes and Aggression
methylation of critical regions within the cytokine gene loci, differential DNA methylation states of transcription factors that regulate these cytokine genes could be one of the mechanism that explain the decrease in plasma cytokines expression observed in the CPA group.
Materials and Methods
Participants
The subjects for the plasma cytokine level analysis (sample 1) [32] were recruited from male participants in two longitudinal studies of child development [15,95] which identified four different trajectories of physical aggression from age 6 to 15 years: Males in the first trajectory showed very low or no physical aggression at any time-point (low-never); males in the second trajectory started with low-to-moderate rates of physical aggression but declined over time (moderate level desister); those in the third trajectory began with high rates of physical aggression but subsequently declined between ages 12 and 15 (high level desister); males on the fourth trajectory showed consistently high physical aggression from age 6 to 15 years (chronic physical aggression, CPA).
The two groups of Caucasian males we recruited from these longitudinal studies were all born in families with a low socioeconomic status and were living within 200 km from our laboratory at the time of recruitment. The first group was recruited from the chronic physical aggression trajectory (chronic physical aggression group, CPA, n = 8). The control group was recruited from the other three developmental trajectories (Control group, CG, n = 25). Quantification of 10 cytokine levels in plasma was done by ELISA for these subjects (sample 1) using the QuantibodyH Human Inflammation Array 1 from RayBiotech (Norcross, United States). The ELISA results showed that compared to the control group, the CPA group had significantly lower levels in plasma of five cytokines; lower pro-inflammatory interleukins IL-1a (T(28.7) = 3.48, P =0.002) and IL-6 (T(26.9) = 3.76, P =0.001), lower anti-inflammatory interleukin IL-4 (T(27.1) = 4.91, P =0.00004) and IL-10 (T(29.8) = 2.84,
P =0.008) and lower chemokine IL-8 (T(26) = 3.69, P =0.001) (see [32] for details). From these subjects (sample 1), the methylation analysis of these cytokine gene loci and their transcription factors was done on all the 8 subjects from the CPA group and a representative subgroup of 12 subjects was selected for the control group (sample 2).Note that one CPA subject was removed from the ELISA analysis due to cytokine concentrations outside of the expected range for the standard curve but was included in the methylation analysis.A schematic overview of the recruitment is illustrated in Figure S7. Characteristics of the original samples (n = 32 sample 1) and the selected subgroups (n = 20 sample 2) are presented in Table 3.
Ethics Statement
After complete description of the study to the subject, all participants provided written informed consent. The study was carried out in accordance with the Declaration of Helsinki, and was approved by the research ethics committee of the University of Montreal pediatric hospital (St-Justine Hospital).
Assessment of Subjects’ Familial Adversity, Behavior Problems, Psychiatric Diagnoses and Criminal Records
Familial adversity. The index of family adversity is a composite score of the degree of adversity in families ranging from 0 to 1, which has been used regularly with these cohorts. The index includes parent’s level of education, type of employment,
age at the birth of their first child and marital status when the subjects were age 6 [16,96].
Physical aggression and other behavior problems. In the course of the longitudinal studies, teachers annually rated the frequency of boys’ physical aggression, opposition, hyperactivity, inattention and anxiety from kindergarten to secondary school with the Social Behavior Questionnaire [96]. The physical aggression ratings were used to trace the developmental trajecto-ries and create the CPA group and the control group (see [6] and [11] for details of the trajectory analyses).
Self reported violence. During the data collection at 21 years, subjects were asked how often in the past year they had been implicated in physical fights and how often they had physically attacked someone.
Criminal record. Canadian youth between 13 and 17 years who commit delinquent acts are referred to the juvenile courts. Subjects who were found guilty by a juvenile court were identified from official records. Using official records we also identified subjects in each group who had been convicted of a criminal offence between 18 and 24 years.
Mental disorders. When the subjects were 15 years, structured psychiatric interviews using a French translation of the Diagnostic Interview Schedule for Children-2.25 (DISC-2.25) [97] were used with the mothers and the subjects to estimate the prevalence of DSM-III-R diagnoses such as: simple phobia, anxiety of separation, generalized anxiety, hyper anxiety, major depression, dysthymia, oppositional disorder and conduct disor-der, over the previous 6 months [87]. Subjects were also asked whether they had a psychiatric record during the interview at 21 years.
CD3+T cells and Monocytes DNA Preparation
For the study, 20 ml of blood were drawn in EDTA coated-tubes for each subjects. PBMC (whole mononuclear cells from peripheral blood) and T cell isolation procedures were adapted from Current Protocols in Immunology (1997, sections 7.1 and 7.5.1–7.5.11). Briefly, PBMC isolation was done by centrifugation with Ficoll-Paque (GE healthcare, Mississauga, Canada) and washed twice with HBSS (Hanks balanced salt solution, GIBCO, Burlington, Canada). T cells were isolated from the PBMCs by immunomagnetic isolation using CD3 dynabeads (Invitrogen (Dynal Biotech), Burlington, Canada). The beads were washed 3 times and incubated with the PBMCs for 45 min on a rotator at 4uC. Coated CD3+cells with the dynabeads were isolated using a strong magnet (Steam Cell Technology) and washed 5 times with PBS/FBS. CD3+cells coated with the dynabeads were then frozen at280uC until DNA extraction. To isolate monocyte cells, B cells were extracted away from the remaining PBMC with CD9 dynabeads (Invitrogen (Dynal Biotech), Burlington, Canada) following the same procedure as for T cells isolation and then frozen at280uC until DNA extraction. Monocytes and T cells DNA was extracted with WizardHGenomic DNA Purification kit (Promega, Madison, United States) following the manufacturer’s protocol.
Methylated DNA Immunoprecipitation (MeDIP), Amplification and Labeling
The MeDIP analysis was adapted from [98]. Briefly, 2mg of each of the T cells and monocytes DNA were sonicated and methylated DNA was immunoprecipitated with 10mg of anti-5methylCytosine (Calbiochem, Billerica, United States). Prior to sonication, two control plasmids were added to the DNA (6rg each), an unmethylated GFP plasmid and anin vitro methylated Luciferase plasmid. The DNA-antibody complex was immuno-DNA Methylation in Cytokine Genes and Aggression
precipitated with 5 mg protein A and the methylated DNA was eluted with 150ml of TE at 1.5% SDS. The input and bound fractions were then purified and validated by PCR analysis for two control genes, H19 (methylated control) and b-actin (unmethy-lated control) and the two added plasmid, GFP (unmethy(unmethy-lated control) and Luciferase (in vitro methylated control) using the
following primers: H19: forward (59
-TTGGTGGAA-CACGCTGTGATCA-39), reverse (59
-GAGCCGCAC-CAGGTCTTCAG-39); b-actin: forward (59
-AGCCA-TAAAAGGCAACTTTCG-39), reverse (59
-CCAACGCCAAAACTCTCCC-39); GFP: forward
(CCAACGC-CAAAACTCTCCC), reverse
(AGCCATAAAAGG-CAACTTTCG); Luciferase: forward (59
-AGAGA-TACGCCCTGGTTCC-39), reverse (59
-CCAACACCGGCATAAAGAA-39). The input and bound frac-tions were then amplified in triplicate using the Whole Genome Amplification kit (Sigma, Oakville, Canada). The amplified input and bound fractions were labeled for microarray hybridization with either Cy3-dUTP or Cy5-dUTP (Perkin Elmer, Montreal, Canada) respectively using the CGH labeling kit (Invitrogen, Burlington, Canada) following the manufacturer’s instructions.
Microarray Design, Hybridization, Scanning and Analysis
A detailed description of the methods and analyses concerning microarrays used in this study were previously described [60]. Briefly, custom 8644 K tilling arrays (Agilent technologies) containing probes selected to tile all the cytokines and TF loci (,100 Kb) were manufactured by Agilent (Mississauga, Canada).
Three replicate microarrays were hybridized and analyzed for each sample. Extracted probe intensities were analyzed using the R software environment for statistical computing [99]. Log-ratios of the bound (Cy5) and input (Cy3) microarray channel intensities were computed for each microarray and then microarrays were normalized to one another using quantile-normalization [100] under the assumption that all samples have identical overall methylation levels.
Differential methylation between groups of samples was determined at both the probe and region levels (1000 bp regions) to ensure both statistical significance and biological relevance as previously described [60]. At the probe level, a modified t-statistic was computed for each probe corresponding to probe log-ratio differences between CPA and control groups using the ‘limma’ package [101] of Bioconductor [102]. Then, region-level methyl-ation differences were calculated as enrichment of large positive or negative t-statistic values among the probes in each 1000 bp region partition of the loci tiled with probes using the Wilcoxon rank-sum test. A probe and the containing region were called
differentially methylated if the p-value of the probe t-statistic was at most 0.05 (uncorrected for multiple testing), log2-fold change between the groups was at least 0.25, and the false discovery rates (FDR) of the region-level statistic was at most 0.2. False positives due to multiple testing are than controlled using the FDR [103] using the method of Benjamini and Hochberg [104].
Figures 1, 2, 3, 4, S1, S2, S3, S4, S5 and S6 were obtained using the UCSC genome browser (http://genome.ucsc.edu/). They depict whole-chromosome views of tracks composed of average normalized probe intensity differences between groups and Pearson’s correlation coefficient (r) between cytokine levels in plasma and normalized MeDIP microarray probe intensities. Similarly to methylation differences, region-level statistical signif-icance was calculated as enrichment probe correlations close to 1 or21 among the probes in each 1000 bp region partition of the loci tiled with probes using the Wilcoxon rank-sum test. A probe and the containing region were calledcorrelatedwith cytokine levels
if the p-value of the correlation was at most 0.05 (uncorrected for multiple testing), the absolute value of the coefficient derived from the linear model used to calculate the p-value was at least 0.5 and the false discovery rates (FDR) of the region-level statistic was at most 0.2. Cytokine levels in plasma were obtained from previous work [32] for the same set of individuals from which DNA methylation profiles were derived.
The identification of regulatory elements contained in the cytokine and TF loci shown in the figures and tables were obtained using the Encyclopedia of DNA Elements (ENCODE) tracks from the UCSC genome browser (http://genome.ucsc.edu/ ENCODE/). The transcription factors binding sites and DNase hypersensitive sites (cluster) shown were obtained from ChIP-seq data done on 24 different cell lines. The histone marks shown were also obtained from ChIP-seq data done on 8 different cell lines but we selected only two cell lines relevant to the lymphocytes analyzed in our study, Gm12878 and K562.
The microarray data are available at http://www.ncbi.nlm.nih. gov/geo under the accession number GSE47193.
Microarray Validation
Bisulfite treatment and pyrosequencing. 1mg of EcoRI digested DNA was subjected to bisulfite treatment as previously described [105]. Loci were selected for further analysis from the locations of probes whose normalized intensities were significantly different between the groups (see Microarray Analysis). PCR amplifications were performed in two steps: 25 ng of bisulfite DNA were used for the outside PCR and 1ml of this DNA for the nested PCR. The outside and nested PCR were performed using HotStarTaq DNA polymerase (Qiagen, Germantown, United States). For pyrosequencing analysis, 25ml of the nested bisulfite-PCR products were processed according to the manufacturer’s standard protocol (Biotage, Charlotte, United States). Sequencing reactions were performed with a PyroMark Gold Q24 Reagent Kit (Qiagen (Biotage), Germantown, United States) according to the manufacturer’s instructions. The percentage methylation at each CpG site was calculated from the raw data by use of PyroMark Q24-CpG Software (Biotage, Charlotte, United States). The mean methylation of all CG sites analyzed in each region was than tested for correlation with the previously obtained cytokine levels in plasma using Pearson correlation.
Supporting Information
Figure S1 DNA methylation differences between CPA (n = 8) and control (n = 12) groups in pro-inflammatory cytokines IL-6 and IL-1aloci in T cells and monocytes.
Expanded views from the UCSC genome browser of IL-6(A)and IL-1a(B)loci located on chromosomes 7 and 2 are depicted. The first two tracks shows the average MeDIP probe fold differences (Log2) between chronic physical aggressive (CPA) and controls
groups and the average Pearson correlation coefficient values calculated between the methylation levels of each probe estimated from the microarray and the plasma IL-6(A)and IL-1a(B)levels obtained from the same subject (n = 20) in monocytes. The following tracks show the same set of results but those obtained from T cells. In black are probes that are more methylated and in gray are those that are less methylated in the CPA group. In red are probes whose methylation level correlate positively with the cytokine level in plasma and in green are those that correlated negatively. Highlighted in blue are regions significantly differen-tially methylated between the groups in T cells, in red in monocytes and in purple in both cell type. The next track (CpG island) shows the location of the CpG islands (CG frequency.0.6) DNA Methylation in Cytokine Genes and Aggression