ACPD
8, 521–548, 2008Weekly patterns of aerosol
D. M. Murphy et al.
Title Page
Abstract Introduction
Conclusions References
Tables Figures
◭ ◮
◭ ◮
Back Close
Full Screen / Esc
Printer-friendly Version
Interactive Discussion
EGU
Atmos. Chem. Phys. Discuss., 8, 521–548, 2008 www.atmos-chem-phys-discuss.net/8/521/2008/ © Author(s) 2008. This work is licensed
under a Creative Commons License.
Atmospheric Chemistry and Physics Discussions
Weekly patterns of aerosol in the United
States
D. M. Murphy1, S. L. Capps1,2,*, J. S. Daniel1, G. J. Frost1,3, and W. H. White4
1
Earth System Research Laboratory, National Oceanic and Atmospheric Administration, Boulder, CO 80305, USA
2
Vanderbilt University, Nashville, TN 37240, USA
3
Cooperative Institute for Research in Environmental Sciences, University of Colorado, Boulder, CO 80309, USA
4
Crocker Nuclear Laboratory, University of California, Davis, Davis, CA 95616, USA
*
now at: School of Chemical and Biomolecular Engineering, Georgia Institute of Technology, Atlanta, GA 30332, USA
Received: 4 December 2007 – Accepted: 4 December 2007 – Published: 10 January 2008
ACPD
8, 521–548, 2008Weekly patterns of aerosol
D. M. Murphy et al.
Title Page
Abstract Introduction
Conclusions References
Tables Figures
◭ ◮
◭ ◮
Back Close
Full Screen / Esc
Printer-friendly Version
Interactive Discussion
EGU
Abstract
Data from the Interagency Monitoring of Protected Visual Environments (IMPROVE) network of aerosol samplers and NOAA monitoring sites are examined for weekly cy-cles. Fine particle elemental carbon, crustal elements, and coarse particle mass had pronounced (up to 20%) weekly cycles with minima on Sunday or Monday. Fine particle
5
organic carbon and mass had smaller amplitude cycles, also with Sunday or Monday minima. There was no statistically significant weekly cycle in fine particle sulfate
de-spite a 10 to 15% weekly cycle in power plant SO2 emissions. Although results for
nitrate must be treated with caution, it showed a pronounced weekly cycle with an am-plitude similar to elemental carbon. The only species found with a weekend maximum
10
was Pb, probably from general aviation on weekends. Aerosol optical properties at NOAA monitoring sites were consistent with the IMPROVE chemical data, with signif-icant weekly cycles in aerosol light absorption but not light scattering. These results support a large role of diesel emissions in elemental carbon aerosol over the entire United States and suggest that a large fraction of the airborne soil dust is
anthro-15
pogenic. They also suggest that studies of weekly cycles in temperature, cloudiness, or precipitation should look for causes more in light-absorbing particles and dust rather than sulfate or total aerosol. There are also implications for personal exposure and
epidemiological studies of aerosol health effects.
1 Introduction
20
Observations of the weekly cycle are a powerful tool for distinguishing anthropogenic from natural causes. Only anthropogenic activities are likely to influence concentra-tions, temperatures, or other atmospheric variables on a seven-day cycle. Weekly trends have been found for diurnal temperature range over the United States (Forster and Solomon, 2003) and China (Gong et al., 2006) as well as cloudiness and
pre-25
ACPD
8, 521–548, 2008Weekly patterns of aerosol
D. M. Murphy et al.
Title Page
Abstract Introduction
Conclusions References
Tables Figures
◭ ◮
◭ ◮
Back Close
Full Screen / Esc
Printer-friendly Version
Interactive Discussion
EGU
transport of urban pollutants using weekly cycles. Blanchard and Tanenbaum (2003)
found significantly less NO2 on weekends in Southern California. Bierle et al. (2003)
found weekly cycles in column NO2measured from satellite, with different amplitudes
and phases on various continents that could be related to various societies. A number of studies have examined weekly cycles of ozone concentrations and photochemistry
5
(e.g. Elkus and Wilson, 1977; Marr and Harley, 2002).
Several studies have specifically studied weekly cycles of aerosol. Almeida et
al. (2006) found that chemical elements such as Ca, Si, and Fe associated with soil were significantly higher on weekdays at a site in a suburb of Lisbon. Motallebi et al. (2003) found weekly cycles at selected urban sites in California. Lough et al. (2006)
10
and Harley et al. (2005) found significant weekly trends in aerosol components in the Los Angeles area. In particular, both found much lower ratios of elemental carbon to organic carbon on weekends. Jin et al. (2005) used satellite data to discern a midweek maximum in aerosol optical thickness near New York City. Delene and Ogren (2002) found slightly higher single scattering albedos on Sundays and Mondays at Bondville,
15
Illinois and Southern Great Plains, Oklahoma than on other days of the week.
With the exception of Delene and Ogren (2002), studies on weekly aerosol properties have concentrated on urban sites. In this paper we use data from the IMPROVE net-work and NOAA aerosol monitoring sites to examine weekly cycles in aerosol across the United States. An important feature of the IMPROVE aerosol data set is the
chem-20
ical analysis, allowing much better weekly analysis than a simple mass measurement.
2 Data
2.1 IMPROVE network
IMPROVE data in this paper are from 1 September 2000 through 31 August 2006. This is an integral number of weeks and years, which helps keep annual cycles from
25
ACPD
8, 521–548, 2008Weekly patterns of aerosol
D. M. Murphy et al.
Title Page
Abstract Introduction
Conclusions References
Tables Figures
◭ ◮
◭ ◮
Back Close
Full Screen / Esc
Printer-friendly Version
Interactive Discussion
EGU
shifted then from a Wednesday-Saturday sampling schedule to a once every third day schedule that rotates through the days of the week, an important feature for this work. There were also few sites in the eastern United States before 2000. Except as noted
for coarse mass, all data in the paper are for fine mode aerosol smaller than 2.5µm.
The IMPROVE monitoring program is described by Malm et al. (2004). Routine
moni-5
toring began in 1988 with the objectives of establishing current background haze levels, identifying the chemical composition and emissions sources of regional aerosols, and documenting long-term trends in aerosol concentrations. Most of the samplers are in locations representative of the 156 National Parks and Wilderness Areas where the Clean Air Act provides special protections for visibility. The network now includes about
10
170 rural or remote sites in the United States.
Data, standard operating procedures and site descriptions are all available in detail athttp://vista.cira.colostate.edu/improve/. Every third day, a set of three PM2.5samples
and one PM10sample is collected by four independent filter sampling trains. The PM10
filter is analyzed only for mass. The PM2.5 modules sample behind AIHL cyclones
15
(John and Reischl, 1980) at nominal flow rates of 22.8 liter min−1. One module collects
PM2.5 on a 37 mm Nylon filter behind an annular denuder coated with Na2CO3 and
glycerol. This filter is analyzed by ion chromatography for the anions chloride, nitrate,
and sulfate. A second module collects undenuded PM2.5 on a 25 mm Teflon filter for
weighing and energy-dispersive x-ray fluorescence analysis (XRF). The third module
20
collects undenuded PM2.5 on a 25 mm quartz-fiber filter for thermal fractionation of
organic and elemental carbon with an optical correction for pyrolysis.
The methods used for elemental and carbon analysis have undergone some minor changes since August 2000. Before December 2001, the elements lighter than iron were determined by proton-induced x-ray emission, and since January 2005 the XRF
25
analysis for elements lighter than nickel has been done under vacuum. Carbon analy-ses since January 2005 have been conducted with new instrumentation according to a more precise protocol (Chow et al., 2007). These one-time method transitions should
ACPD
8, 521–548, 2008Weekly patterns of aerosol
D. M. Murphy et al.
Title Page
Abstract Introduction
Conclusions References
Tables Figures
◭ ◮
◭ ◮
Back Close
Full Screen / Esc
Printer-friendly Version
Interactive Discussion
EGU
There is a weekly pattern of sampler operations: the local operator checks the sys-tem’s operation each Tuesday, and replaces the cartridge of exposed filter cassettes in each module with one of unexposed filter cassettes. This schedule imposes extra handling for Tuesday samples, which are briefly interrupted while the operator trans-fers the active filter cassette from the old cartridge to the new one. It also imposes
5
sample-day-dependent delays between exposure and unloading, when losses might potentially occur within the sampler. (Any potential for contamination would presum-ably exist both before and after exposure, and so be independent of sample day.) Such
hypothetical effects have not been detected in previous testing. With the exception of
winter nitrate, they would not explain the calendar-week cycles presented here, whose
10
extremes usually occur away from the Tuesday sampler maintenance.
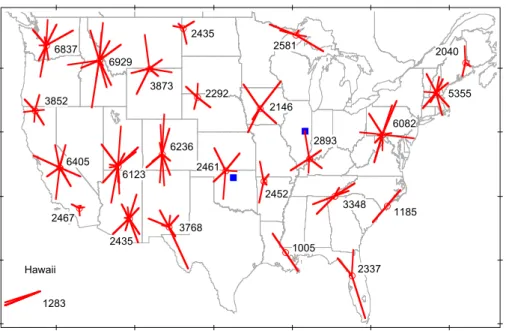
The sites in the IMPROVE database were combined into 25 groups using hierarchical cluster analysis (Fig. 1). Fifteen urban sites were eliminated (ATLA1, BALT1, CHIC1, DETR1, FRES1, HOUS1, NEYO1, OLTO1, OMAH1, PHOE1, PITT1, PUSO1, RUBI1, SAGU1, and WASH1), as were some sites that were closed before 2000. Then great
15
circle distances were calculated between all site pairs and the closest pair of sites or clusters combined with each other. The process was repeated until the closest clusters were more than 390 km apart. This threshold was chosen to keep separate clusters in California. Single sites that had not ended up in a cluster were paired together (in Louisiana and the Carolinas) or combined with the nearest cluster (Everglades and Big
20
Bend). Of sites outside of the continental United States, only Hawaii was kept because there were fewer samples in Alaska or the Virgin Islands.
Use of clusters is essential to this work. Weekly cycles at single sites are often not statistically significant when samples are taken every third day. Several sampling sites must be averaged to distinguish weekly cycles from random variability. Yet one cannot
25
ACPD
8, 521–548, 2008Weekly patterns of aerosol
D. M. Murphy et al.
Title Page
Abstract Introduction
Conclusions References
Tables Figures
◭ ◮
◭ ◮
Back Close
Full Screen / Esc
Printer-friendly Version
Interactive Discussion
EGU
To start with a consistent set of data, all samples were required to have valid values for mass, elemental carbon, and sulfate. About 0.1% of the data were eliminated as high outliers. These are probably valid data influenced by local events such as fires or nearby dust generation. For example, fine mode mass was required to be less than
50µg m−3. The results are not sensitive to these cutoffs but they do help keep a single
5
sample from skewing one day of the week for an entire cluster. This left 92 744 samples in the IMPROVE data during the time period after eliminating the urban sites. The actual number of samples for a given species may be slightly smaller, since not all analyses were performed on every sample. Data below detection limit were retained as zeros but species with many values below detection limit are not discussed in the
10
paper. Notably, our mineral dust analysis does not consider aluminum because of a poor detection limit compared to silicon and iron.
Most of the subsequent results are presented in terms of the average weekly cycle in a cluster. For each day of the week, this is calculated as the average of all observations on that day of the week during the September 2000 to August 2006 period, at all sites
15
in the cluster. For visual presentation, and for network averages, each cluster’s cycle is normalized to that cluster’s overall September 2000 to August 2006 mean.
Judging the statistical significance of the weekly cycles is difficult. The most
im-portant problem is the number of independent measurements. The standard errors in subsequent figures are calculated as usual by dividing the standard deviation of
individ-20
ual measurements by the square root of the number of measurements. The samples are not completely independent of each other, however, as this calculation implicitly as-sumes. Concentration variations are driven largely by meteorological variables, which are correlated in both time and space. The IMPROVE protocol of samples every third day should reduce but not completely eliminate the autocorrelation between
succes-25
sive samples (Anderson et al., 2003). Similarly, multiple sites within a cluster will often lie in the same synoptic airmass.
ACPD
8, 521–548, 2008Weekly patterns of aerosol
D. M. Murphy et al.
Title Page
Abstract Introduction
Conclusions References
Tables Figures
◭ ◮
◭ ◮
Back Close
Full Screen / Esc
Printer-friendly Version
Interactive Discussion
EGU
would show the same weekly cycles, but the site further downwind would have lower
absolute values. If the sites with different absolute concentrations are averaged
to-gether, the standard deviations for each day would be large even though the sites were sampling the same source.
To assess the statistical significance, we compared the amplitude of the observed
5
weekly cycle with the amplitude of the weekly cycle for synthetic time series generated from randomized versions of the same data. To preserve short-term correlations, data within each month were kept as a block and each month was shifted by a random number of days of the week. The resulting statistics for 500 randomized samples of the data are shown in Table 1. The weekly cycle inferred from random data varies by
10
species because of different variance and skew in the concentrations of each species.
Since we are considering the absolute value of the weekly cycle in the random-ized data, the distributions are not centered on zero. This is why the 90th and 99th percentiles may appear closer than expected. Also, these percentiles of the absolute values of weekly cycles represent the amplitude required for confidence that a cycle
15
of any phase is real. They are not the same as the 90 percent confidence limits on the amplitude of the derived cycles (these are not computed here). The reason the
two quantities are different is that random noise will always generate a positive weekly
cycle of some phase whereas it can generate either a positive or negative error in a cycle whose phase is already determined.
20
We also checked for cycles of 5, 8, and 10 d using the same software as the 7-day cycle (6 and 9 d cycles do not work well with samples taken every third d). For the species with cycles that are statistically significant compared to the randomized data, the 7-day cycle was much larger than the other periods. For example, by one mea-sure (maximum two consecutive days minus minimum two consecutive d) the weekly
25
ACPD
8, 521–548, 2008Weekly patterns of aerosol
D. M. Murphy et al.
Title Page
Abstract Introduction
Conclusions References
Tables Figures
◭ ◮
◭ ◮
Back Close
Full Screen / Esc
Printer-friendly Version
Interactive Discussion
EGU
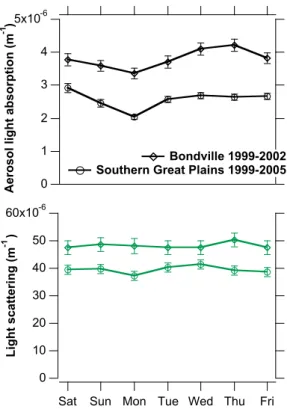
2.2 NOAA aerosol optical properties
The National Oceanic and Atmospheric Administration (NOAA) continuously measures aerosol optical properties at a number of baseline and regional monitoring stations (Delene and Ogren, 2002). Bondville, Illinois, and Southern Great Plains, Oklahoma, are relevant to this work. Their locations are shown on Fig. 1. Daily averaged data
5
were used to construct the weekly cycles.
Aerosol light absorption was measured at 565 nm using Particle Soot/Absorption Photometers (PSAP, Radiance Research). The data were corrected for scattering us-ing Bond et al. (1999). Aerosol light scatterus-ing was measured usus-ing TSI 3563 neph-elometers. Only the 550 nm data are shown here. The sample stream was heated,
10
if necessary, to maintain the relative humidity at about 50%. Further descriptions are
available athttp://www.esrl.noaa.gov/gmd/aero/instrumentation/instrum.html.
The PSAP filters were changed less frequently on weekends at the Southern Great Plains sit and therefore had lower average total filter transmission on Sundays and Mondays (J. Ogren, personal communication, 2007). The Bondville site was less
af-15
fected. More recent work on PSAP corrections by Virkkula et al. (2005) suggests that the Bond et al. (1999) corrections have an accurate dependence on filter transmission except for highly absorbing aerosols (albedo less than about 0.7) that are not likely to be important for these sites.
2.3 Emissions inventories
20
Weekly cycles in SO2 and NOxemissions from power plants were computed for
com-parison with observed weekly cycles in aerosols. U.S. power plant emission data were obtained from the Environmental Protection Agency’s Clean Air Markets Division,
http://camddataandmaps.epa.gov/gdm/index.cfm?fuseaction=emissions.wizard. 1999
and 2005 hourly emissions recorded by continuous emission monitors at each power
25
ACPD
8, 521–548, 2008Weekly patterns of aerosol
D. M. Murphy et al.
Title Page
Abstract Introduction
Conclusions References
Tables Figures
◭ ◮
◭ ◮
Back Close
Full Screen / Esc
Printer-friendly Version
Interactive Discussion
EGU
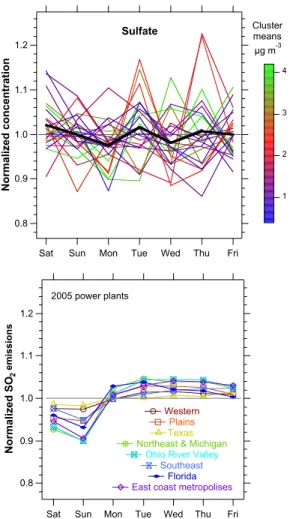
over the entire year, and the day-of-week averages were normalized using the average emissions in each region. Weekly cycles in 1999 were very similar to the 2005 data shown in the figure.
3 Results
3.1 Crustal elements
5
The largest percentage weekly cycles in aerosol concentrations were observed for the crustal elements Si, Ca, Ti, and Fe (Fig. 2). All had weekly cycles with 20% or greater range. Minima were on Sunday for most locations and maxima were usually on Thurs-day. Aluminum also had similar patterns but more values below the detection limit. The weekly cycles were consistent throughout the country except for a few locations where
10
the absolute values were small. One of the largest weekly cycles was observed for the cluster in Arizona that had the largest annual averages for these elements of any clus-ter in the continental United States. That clusclus-ter had low values on both Saturday and Sunday, perhaps because the soil particles were generated locally so the atmospheric concentrations could respond more quickly to low emissions on the weekend. A
cu-15
rious feature for many locations is that the weekly maximum was on Thursday rather than Friday, as might be expected if weekday emissions built up in the atmosphere throughout the week. It is not clear to what extent this is a statistical fluctuation or a reflection of four-day work weeks.
On Fig. 2 and subsequent figures, the average for the continental United States was
20
generated from the normalized averages of the clusters. This means that individual sites in areas with a dense network of sites contribute less to the average than sites where the network is sparse. Averaging the normalized weekly cycles means that regions with low absolute concentrations contribute as much to the continental average as regions with high concentrations. As a guide to the eye, normalized weekly cycles
25
ACPD
8, 521–548, 2008Weekly patterns of aerosol
D. M. Murphy et al.
Title Page
Abstract Introduction
Conclusions References
Tables Figures
◭ ◮
◭ ◮
Back Close
Full Screen / Esc
Printer-friendly Version
Interactive Discussion
EGU
days is less or more than four standard errors from the minimum of two consecutive days.
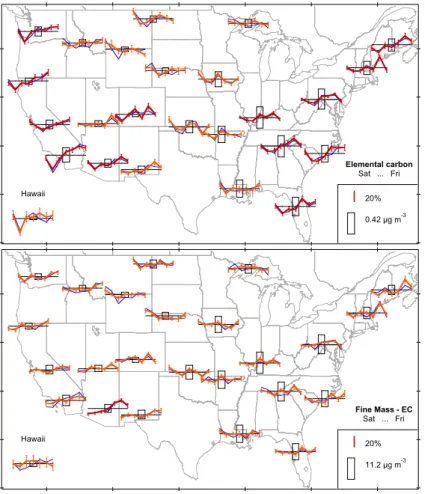
3.2 Elemental carbon, organic carbon, and aerosol mass
Weekly cycles for elemental carbon, organic carbon, and several measures of aerosol mass are shown in Figs. 3 and 4. Elemental carbon is subtracted from fine mode mass
5
because for climate forcing calculations it is sensible to separate absorbing and non-absorbing aerosols. This also facilitates comparison with the optical measurements discussed later. The weekly cycles for fine mass are not statistically significant for individual clusters. Although Fig. 3 shows one highly significant cluster, testing with the randomized series shows that by chance one out of 25 clusters can exceed the
10
four standard error threshold for the color code on Fig. 3. However, the continental US average weekly cycle for fine mass is statistically significant (Table 1) at about the 95% level.
Elemental carbon has a much larger weekly cycle than organic carbon or the fine mode mass. Figure 4d compares some of the weekly cycles. In view of the large
15
weekly cycle for crustal elements, a curve is shown for fine mass after removing the contribution from soil calculated using a slightly modified version of the IMPROVE soil equation:
Soil=(2.42+1.5)∗Fe+1.63∗Ca+2.2∗Al+2.49∗Si+1.94∗Ti (1)
The factors account for oxides, and in the case of Fe, crustal elements such as K that
20
cannot easily be separated from other sources. The additional factor of 1.5*Fe is a very rough estimate of a contribution from total carbon in the soil estimated from examining some strong dust events. We infer from this curve that the weekly cycle for fine mass is only partially due to the strong cycle in soil dust. It is also due to organic carbon and nitrate.
25
ACPD
8, 521–548, 2008Weekly patterns of aerosol
D. M. Murphy et al.
Title Page
Abstract Introduction
Conclusions References
Tables Figures
◭ ◮
◭ ◮
Back Close
Full Screen / Esc
Printer-friendly Version
Interactive Discussion
EGU
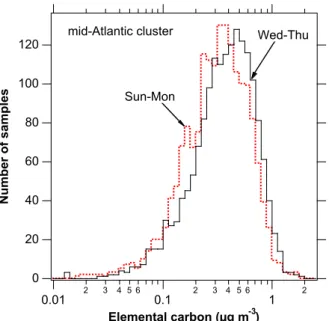
rather than changes in a few extreme values. This is the case for other clusters as well. The histograms also show the form of the distributions: on a log scale such as Fig. 5 the distributions are skewed left. On a linear scale they are skewed to the right, so the distributions are between log-normal and normal.
The IMPROVE network uses a thermo-optical method to separate organic and
ele-5
mental carbon. For all thermo-optical methods, there are questions about the absolute accuracy of how organic carbon that chars during heating is separated from elemental carbon. Despite these questions, weekly cycles depend more on consistency of the carbon analysis than the absolute cut point between elemental and organic carbon. In
addition, the different weekly cycles for elemental and organic carbon show that the
10
operational definition of elemental and organic carbon in the IMPROVE protocol does
represent a useful separation for species with differing sources and behavior in the
atmosphere.
3.3 Sulfate and nitrate
Sulfate has a very different pattern than elemental carbon. There is no statistically
15
significant weekly cycle in sulfate, despite a weekly cycle in SO2 emissions (Fig. 6).
This is probably caused both by the emissions and the chemistry of SO2. Emissions
of SO2 from power plants decline by 5 to 15% on weekends compared to weekdays,
a much smaller change than the reduction in diesel emissions on weekends.
Elec-tric power generation accounted for about 70% of US SO2 emissions during the
pe-20
riod 2000–2006 (National Emissions Inventory (NEI) Air Pollutant Emissions Trends
Data, http://www.epa.gov/ttn/chief/trends/index.html). Unlike crustal material or
ele-mental carbon, the SO2emissions must be chemically transformed to produce sulfate.
This will delay and spread out any weekly pattern. Also, oxidation of SO2 to sulfate
takes place by both gas phase reactions and liquid phase chemistry in clouds. These
25
pathways proceed at different rates, further spreading out any weekly pattern. The
ACPD
8, 521–548, 2008Weekly patterns of aerosol
D. M. Murphy et al.
Title Page
Abstract Introduction
Conclusions References
Tables Figures
◭ ◮
◭ ◮
Back Close
Full Screen / Esc
Printer-friendly Version
Interactive Discussion
EGU
We compared the weekly cycles for winter and summer sulfate concentrations. Sul-fate concentrations are generally higher in summer than in winter, when photochem-istry is slower and liquid phase clouds are less common in the northern United States. Distinguishing seasons did not reveal any statistically significant cycles.
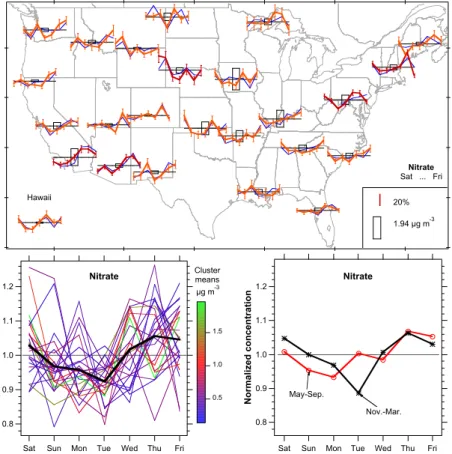
There are two main types of aerosol nitrate: ammonium nitrate and nitrate
chemi-5
cally bound to crustal cations such as calcium (Murphy et al., 2006). With few excep-tions, ammonium nitrate is only stable when the sulfate has been completely neutral-ized. Otherwise it dissociates to gas phase ammonia and nitric acid. Because of the
widespread oxidation of SO2 to sulfuric acid, ammonium nitrate is more often limited
by ammonium than the availability of gas phase nitric acid. The absolute amounts
10
of nitrate vary greatly, with much larger concentrations in southern California and the Midwest than the mountain west. California and the Midwest are locations with
sub-stantial sources of ammonia and, especially for California, small emissions of SO2. The
reaction of nitric acid with calcium in mineral dust is much less sensitive to sulfate. In contrast to sulfate, nitrate shows a weekly cycle (Fig. 7). Some of the cycle in
15
nitrate is driven by the strong weekly cycle in crustal elements, but examination of the absolute values shows that calcium nitrate and similar species cannot account for all of the observed cycle in nitrate. The weekly nitrate minimum is Sunday through Tuesday, later than other species. The presence of a weekly cycle in nitrate is a little surprising because of the possible limitations by ammonia. For example, emissions
20
of ammonia from farm animals should be fairly constant. NOx emissions from power
plants have a similar cycle to that shown for sulfate in Fig. 6. NOx emissions from
vehicles will have a much stronger weekly cycle, similar to that for elemental carbon.
The fraction of US NOx emitted by electric power generation decreased from 24%
in 2000 to 20% in 2006. During the same period, on-road mobile sources produced
25
about 37% while the contribution of off-highway vehicles has increased from 18% to
22% (National Emissions Inventory (NEI) Air Pollutant Emissions Trends Data, http:
ACPD
8, 521–548, 2008Weekly patterns of aerosol
D. M. Murphy et al.
Title Page
Abstract Introduction
Conclusions References
Tables Figures
◭ ◮
◭ ◮
Back Close
Full Screen / Esc
Printer-friendly Version
Interactive Discussion
EGU
Although the data are noisy when separated by season, there does appear to be a shift in the timing from a Sunday minimum in summer to a Tuesday minimum in winter
(Fig. 7). There are two possible explanations for this shift. First, conversion of NOx to
HNO3, followed by rapid equilibration with aerosol nitrate, will be much slower in winter
than in summer. That could shift the phase of the weekly cycle. Second, there could be
5
an unrecognized artifact associated with the extra handling Tuesday samples receive from the site operator. Low temperatures and low sulfate concentrations favor the stability of ammonium nitrate particles, so nitrate concentrations in most of the country peak during the winter. The Nylon filters used for IMPROVE’s nitrate measurement retain any nitric acid gas released after collection by thermal dissociation of ammonium
10
nitrate. Warming of winter-Tuesday samples during the brief handling period, when any volatilized nitric acid would not be drawn back into the filter, must for the moment be considered as a possible explanation for the nitrate minimum on winter Tuesdays.
3.4 Lead and other metals
Lead is the only species studied with a weekend maximum (Fig. 8). The largest single
15
source of airborne Pb, accounting for about 25% of US emissions, is leaded gasoline in small piston aircraft (Murphy et al., 2007). Many of these small planes are recreational and emissions probably peak on weekends. The next largest sources of airborne Pb are coal-fired power plants and heavy steel industry. Those emissions probably go
down slightly on weekends as shown earlier for SO2.
20
Zinc and Pb are highly correlated in atmospheric samples, probably because of simi-lar electric utility and industrial sources and simisimi-lar condensation in combustion exhaust (Murphy et al., 2007). Their ratio is less variable than their absolute concentrations with a very consistent Sunday maximum (Fig. 8). Most locations in the United States have
Pb/(Pb+Zn) in a narrow range between 0.3 and 0.33. The ratio Pb/(Pb+Zn) is
com-25
ACPD
8, 521–548, 2008Weekly patterns of aerosol
D. M. Murphy et al.
Title Page
Abstract Introduction
Conclusions References
Tables Figures
◭ ◮
◭ ◮
Back Close
Full Screen / Esc
Printer-friendly Version
Interactive Discussion
EGU
3.5 Optical properties of aerosols
Changes in the optical properties of aerosols at two sites in the central United States are consistent with the weekly cycles from the IMPROVE network. These NOAA sites
use completely different instrumentation than the IMPROVE sites and operate
contin-uously rather than sampling for 24 h every third day. At both NOAA sites, there was a
5
weekly minimum in aerosol light absorption on Monday (Fig. 9). Although the national minimum for IMPROVE elemental carbon was on Sunday, the clusters of sites close to Bondville and Southern Great Plains had minima on Monday (Fig. 3). With samples every third day, there were not enough data to do the direct comparison of just the Bondville IMPROVE site with the NOAA Bondville data. There were no statistically
sig-10
nificant weekly cycles in light scattering at either NOAA site. This is consistent with the lack of a statistically significant weekly cycle in sulfate and the small cycle in organic carbon.
4 Implications
The weekly cycles shown here are unlikely to be from local sources at the sampling
15
sites for two reasons. First, the data show regional rather than local patterns. Second, many of the IMPROVE sites are at national parks and monuments. One would expect
weekend maxima rather than minima if local traffic were generating the weekly cycles.
Large-scale weekly cycles in aerosol have implications for emissions, health effects,
and climate studies. The weekly cycles in emissions must be much stronger than the
20
up to 20% cycles observed in aerosol species. At any site and time, some sources will be very close, some one day upwind, and others further upwind. Multiple sources and variations in winds will both tend to smear out the weekly cycle in emissions.
Weekly cycles of traffic emissions have been studied in California. There, passenger
vehicle travel is similar on weekdays and weekends but heavy truck emissions
de-25
ACPD
8, 521–548, 2008Weekly patterns of aerosol
D. M. Murphy et al.
Title Page
Abstract Introduction
Conclusions References
Tables Figures
◭ ◮
◭ ◮
Back Close
Full Screen / Esc
Printer-friendly Version
Interactive Discussion
EGU
al., 2005). For passenger vehicles, there are diurnal differences between weekday and
weekend. The peak emissions are at rush hours during the week but around midday
on weekends. The dominant effect for elemental carbon emissions is the decrease of
diesel emissions on weekends. Elemental carbon concentrations on all days should decrease as new controls on heavy truck emissions penetrate the fleet.
5
The weekly cycle in crustal elements implies a large anthropogenic source in the United States besides wind-blown dust. The crustal elements have an even larger
weekly cycle than elemental carbon, which is affected by the 70% decrease in heavy
truck emissions on weekends. That means that the anthropogenic source for crustal elements must be both large and decrease very significantly on weekends. Light
ve-10
hicle traffic on dirt or dusty roads probably does not have a sufficiently large weekly
cycle. We do not know what fractions of plowing and other agricultural operations are conducted on weekends, and these may vary with region and season. Construction
and heavy truck traffic on dirt roads are possible sources of dust with large weekly
cycles. For Pb, the IMPROVE data support a significant source from leaded aviation
15
fuel.
Weekly cycles may have implications for epidemiological studies of the health effects
of aerosols. First, personal exposure to certain species will be affected if people spend
more time outdoors on Sundays when mineral dust and elemental carbon
concentra-tions are lower. Second, there might be some effects on the statistics in time series
20
studies. Such studies often include day-of-week in the statistical analysis (Pope and
Dockery, 2006). This should take out the biggest effects but it is hard to exclude subtle
interactions in the time series. On the other hand, the consistency of weekly cycles
throughout the United States means that studies comparing different cities over the
same time period should compensate very well for any weekly cycles. Third, health
25
care can be better on weekdays than weekends, resulting in different mortality rates
for the same conditions (Bell and Redelmeier, 2001). This could conceivably cause
aerosol-health correlations to be underestimated if aerosol health effects maximize on
cy-ACPD
8, 521–548, 2008Weekly patterns of aerosol
D. M. Murphy et al.
Title Page
Abstract Introduction
Conclusions References
Tables Figures
◭ ◮
◭ ◮
Back Close
Full Screen / Esc
Printer-friendly Version
Interactive Discussion
EGU
cles of elemental carbon and sulfate could be used in a statistical sense to examine
the difficult question of what aerosol components are most responsible for the health
effects.
These results are important for studies of weekly and other short-term climate
ef-fects of aerosols. The direct climate effects of elemental carbon and non-absorbing
5
fine particle mass have opposite signs. It will not be possible to relate weekly cycles in temperature or precipitation to aerosols without considering elemental carbon
sepa-rately from other species. The differing weekly cycles of various aerosol species could
provide a powerful check on aerosol transport models. Finally, mineral dust particles
can be potent ice nuclei so the strong weekly cycle in crustal elements could affect ice
10
clouds and precipitation.
Acknowledgements. S. L. Capps was supported by the National Oceanic and Atmospheric Administration’s Ernest F. Hollings Undergraduate Scholarship Program administered by the Oak Ridge Institute for Science and Education.
References
15
Almeida, S. M., Pio, C. A., Freitas, M. C., Reis, M. A., and Trancoso, M. A.: Source apportion-ment of atmospheric urban aerosol based on weekdays/weekends variability: evaluation of road re-suspended dust contribution, Atmos. Environ., 40, 2058–2067, 2006.
Anderson, T. L., Charlson, R. J., Winker, D. M., Ogren, J. A., and Holm ´en, K.: Mesoscale variations of tropospheric aerosols, J. Atmos. Sci., 60, 119–136, 2003.
20
B ¨aumer, D. and Vogel, B.: An unexpected pattern of distinct weekly periodicities in climatolog-ical variables in Germany, Geophys. Res. Lett., 34, L03819, doi:10.1029?2006GL028559, 2007.
Beirle, S., Platt, U., Wenig, M., and Wagner, T.: Weekly cycle of NO2by GOME measurements: a signature of anthropogenic sources, Atmos. Chem. Phys., 3, 2225–2232, 2003,
25
http://www.atmos-chem-phys.net/3/2225/2003/.
ACPD
8, 521–548, 2008Weekly patterns of aerosol
D. M. Murphy et al.
Title Page
Abstract Introduction
Conclusions References
Tables Figures
◭ ◮
◭ ◮
Back Close
Full Screen / Esc
Printer-friendly Version
Interactive Discussion
EGU
Blanchard, C. L. and Tanenbaum, S. J.: Differences between weekday and weekend air pollu-tant levels in Southern California, J. Air Waste Manage., 53, 816–828, 2003.
Bond, T. C., Anderson, T. L., and Campbell, D.: Calibration and intercomparison of filter-based measurements of visible light absorption by aerosols, Aerosp. Sci. Technol., 30, 582–600, 1999.
5
Chow, J. C., Watson, J. G., Chen, L.-W. A., Chang, M. C. O., Robinson, N. F., Trimble, D., and Kohl, S.: The IMPROVE A temperature protocol for thermal/optical carbon analysis: maintaining consistency with a long-term database, J. Air Waste Manage., 57, 1014–1023, 2007.
Delene, D. J. and Ogren, J. A.: Variability of aerosol optical properties at four North American
10
surface monitoring sites, J. Atmos. Sci., 59, 1135–1150, 2002.
Elkus, B. and Wilson, K. R.: Photochemical air pollution: Weekend-weekday differences, At-mos. Environ., 11, 509–515, 1977.
Forster, P. M. de F. and Solomon, S.: Observations of a “weekend effect” in diurnal temperature range, P. Natl. Acad. Sci. USA, 100, 11 225–11 230, 2003.
15
Gong, D.-Y., Guo, D., and Ho, C.-H.: Weekend effect in diurnal temperature range in China: Opposite sign between winter and summer, J. Geophys. Res., 111, D18113, doi:10.1029/2006JD007068, 2006.
Harley, R. A., Marr, L. C., Lehner, J. K., and Giddings, S. N.: Changes in motor vehicle emis-sions on diurnal to decadal time scales and effects on atmospheric composition, Environ.
20
Sci. Technol., 39, 5356–5362, 2005.
Jin, M., Shepherd, J. M., and King, M. D.: Urban aerosols and their variations with clouds and rainfall: A case study for New York and Houston, J. Geophys. Res., 110, D10S20, doi:10.1029/2004JD005081, 2005.
Lough, G. C., Schauer, J. J., and Lawson, D. R.: Day-of-week trends in carbonaceous aerosol
25
composition in the urban atmosphere, Atmos. Environ., 40, 4137–4149, 2006.
Malm, W. C., Schichtel, B. A., Pitchford, M. L., Ashbaugh, L. L., and Eldred, R. A.: Spatial and monthly trends in speciated fine particle concentration in the United States, J. Geophys. Res., 109, D03306, doi:10.1029/2003JD003739, 2004.
Marr, L. C. and Harley, R. A.: Modeling the effect of weekday-weekend differences on motor
30
vehicle emissions on photochemical air pollution in central California, Environ. Sci. Technol., 36, 4099–4106, 2002.
ACPD
8, 521–548, 2008Weekly patterns of aerosol
D. M. Murphy et al.
Title Page
Abstract Introduction
Conclusions References
Tables Figures
◭ ◮
◭ ◮
Back Close
Full Screen / Esc
Printer-friendly Version
Interactive Discussion
EGU
California 1. Development of a revised motor vehicle emission inventory, J. Geophys. Res., 107(D6), 4047, doi:10.1029?2001JD000689, 2002.
Millstein, D. E., Harley, R. A., and Hering, S. V.: Weekly cycles in fine particulate nitrate, Atmos. Environ., in press, 2007.
Motallebi, N., Tran, H., Croes, B. E., and Larsen, L. C.: Day-of-week patterns of particulate
5
matter and its chemical components at selected sites in California, J. Air Waste Manage., 53, 876–888, 2003.
Murphy, D. M., Cziczo, D. J., Froyd, K. D., Hudson, P. K., Matthew, B. M., Middlebrook, A. M., Peltier, R. E., Sullivan, A., Thomson, D. S., and Weber, R. J.: Single-particle mass spectrometry of tropospheric aerosol particles, J. Geophys. Res., 111, D23S32,
10
10.1029/2006JD007340, 2006.
Murphy, D. M., Hudson, P. K., Cziczo, D. J., Gallavardin, S., Froyd, K. D., Johnston, M. V., Middlebrook, A. M., Reinard, M. S., Thomson, D. S., Thornberry, T., and Wexler, A. S.: Distribution of lead in single atmospheric particles, Atmos. Chem. Phys., 7, 3195–3210, 2007,
15
http://www.atmos-chem-phys.net/7/3195/2007/.
Pope, C. A. III and Dockery, D. W.: Health effects of fine particulate air pollution: lines that connect, J. Air Waste Manage., 56, 709–724, 2006.
Venkatachari, P., Zhou, L. M., Hopke, P. K., Felton, D., Rattigan, O. V., Schwab, J. J., and De-merjian, K. L.: Spatial and temporal variability of black carbon in New York City, J. Geophys.
20
Res., 111, D10S05, 10.1029/2005JD006314, 2006.
Virkkula, A., Ahlquist, N. C., Covert, D. S., Arnott, W. P., Sheridan, P. J., Quinn, P. K., and Coffman, D. J.: Modification, calibration and a field test of an instrument for measuring light absorption by particles, Aerosol Sci. Tech., 39, 68–83, 2005.
White, W. H., Macias, E. S., Miller, D. F., Schorran, D. E., Hoffer, T. E., and Rogers, D. P.:
25
Regional transport of the urban workweek: Methylchloroform cycles in the Nevada-Arizona desert, Geophys. Res. Lett., 17, 1081–1084, 1990.
White, W. H., Macias, E. S., Miller, D. F., Schorran, D. E., Hoffer, T. E., and Rogers, D. P.: Observations of Los Angeles smog in southern Nevada, in Tropospheric Ozone and the Environment, edited by Berglund, R. L., Air Waste Management Association, Pittsburgh,
30
ACPD
8, 521–548, 2008Weekly patterns of aerosol
D. M. Murphy et al.
Title Page
Abstract Introduction
Conclusions References
Tables Figures
◭ ◮
◭ ◮
Back Close
Full Screen / Esc
Printer-friendly Version
Interactive Discussion
EGU Table 1. Statistics of weekly cycles for selected species averaged over the continental United
States.
Species Weekly range Weekly two-day range* Randomized data
(%) (%) Weekly two-day range (%)
90th percentile 99th percentile
Silicon 22.4 15.3 9.1 11.4
Iron 26.5 18.1 10.2 14.2
Calcium 24.3 17.4 9.6 12.8
Coarse mass 23.1 18.4 9.8 12.8
Elemental carbon 14.2 11.4 6.3 8.1
Organic carbon 7.9 5.6 4.9 6.2
Fine mass – EC 7.9 6.2 5.1 6.4
Fine mass – (EC+soil) 5.5 4.8 5.4 7.2
Sulfate 4.5 2.3 5.4 7.2
Nitrate 13.4 11.0 8.0 9.7
Pb 9.1 6.7 5.0 6.6
Pb/(Pb+Zn) 8.4 7.0 3.6 5.2
Zn 8.3 6.6 4.3 5.3
V 4.5 3.2 6.6 8.0
Se 3.3 1.8 4.4 5.9
* maximum two consecutive days – minimum two consecutive days
ACPD
8, 521–548, 2008Weekly patterns of aerosol
D. M. Murphy et al.
Title Page
Abstract Introduction
Conclusions References
Tables Figures
◭ ◮
◭ ◮
Back Close
Full Screen / Esc
Printer-friendly Version
Interactive Discussion
EGU
Hawaii
1005
1283
2893
2040
5355
1185 2467
2337 6082
3348 6929
2435
2435 3852
2452 2146
2581
3768 6837
6236 2292
2461 3873
6405
6123
ACPD
8, 521–548, 2008Weekly patterns of aerosol
D. M. Murphy et al.
Title Page
Abstract Introduction
Conclusions References
Tables Figures
◭ ◮
◭ ◮
Back Close
Full Screen / Esc
Printer-friendly Version
Interactive Discussion
EGU 20%
0.33 !g m-3 Hawaii
Silicon Sat ... Fri
1.10
1.05
1.00
0.95
0.90
Normalized concentration
Sat Sun Mon Tue Wed Thu Fri Si
Ca Ti Fe Coarse mass 1.2
1.1
1.0
0.9
0.8
Normalized concentration
Sat Sun Mon Tue Wed Thu Fri Cluster means !g m-3
0.30
0.25
0.20
0.15
0.10
Si
Fig. 2. Weekly cycles of crustal elements in the fine mode (below 2.5µm). The top panel
ACPD
8, 521–548, 2008Weekly patterns of aerosol
D. M. Murphy et al.
Title Page
Abstract Introduction
Conclusions References
Tables Figures
◭ ◮
◭ ◮
Back Close
Full Screen / Esc
Printer-friendly Version
Interactive Discussion
EGU
20%
11.2 !g m-3 Hawaii
Fine Mass - EC Sat ... Fri
20%
0.42 !g m-3 Hawaii
Elemental carbon Sat ... Fri
ACPD
8, 521–548, 2008Weekly patterns of aerosol
D. M. Murphy et al.
Title Page Abstract Introduction Conclusions References Tables Figures ◭ ◮ ◭ ◮ Back Close
Full Screen / Esc
Printer-friendly Version Interactive Discussion EGU 1.2 1.1 1.0 0.9 0.8 Normalized concentration
Sat Sun Mon Tue Wed Thu Fri Cluster means
!g m-3
0.40 0.35 0.30 0.25 0.20 0.15 0.10 Elemental carbon 1.2 1.1 1.0 0.9 0.8 Normalized concentration
Sat Sun Mon Tue Wed Thu Fri Cluster means
!g m-3
10
8
6
4 Fine mass - EC
1.2 1.1 1.0 0.9 0.8 Normalized concentration
Sat Sun Mon Tue Wed Thu Fri Cluster means
!g m-3 1.8 1.6 1.4 1.2 1.0 0.8
Organic carbon 1.10
1.05
1.00
0.95
0.90
Normalized concentration
Sat Sun Mon Tue Wed Thu Fri Elemental carbon
Organic carbon Fine mass - EC Fine mass - (EC+soil) Coarse mass
(a) (b)
(c) (d)
ACPD
8, 521–548, 2008Weekly patterns of aerosol
D. M. Murphy et al.
Title Page
Abstract Introduction
Conclusions References
Tables Figures
◭ ◮
◭ ◮
Back Close
Full Screen / Esc
Printer-friendly Version
Interactive Discussion
EGU
120
100
80
60
40
20
0
Number of samples
0.01
2 3 4 5 6 0.1
2 3 4 5 6 1
2
Elemental carbon (!g m-3)
mid-Atlantic cluster Wed-Thu
Sun-Mon
ACPD
8, 521–548, 2008Weekly patterns of aerosol
D. M. Murphy et al.
Title Page
Abstract Introduction
Conclusions References
Tables Figures
◭ ◮
◭ ◮
Back Close
Full Screen / Esc
Printer-friendly Version
Interactive Discussion
EGU
1.2
1.1
1.0
0.9
0.8
Normalized SO
2
emissions
Sat Sun Mon Tue Wed Thu Fri Western
Plains Texas
Northeast & Michigan
Ohio River Valley
Southeast Florida
East coast metropolises
2005 power plants 1.2
1.1
1.0
0.9
0.8
Normalized concentration
Sat Sun Mon Tue Wed Thu Fri Cluster means
!g m-3
4
3
2
1 Sulfate
ACPD
8, 521–548, 2008Weekly patterns of aerosol
D. M. Murphy et al.
Title Page
Abstract Introduction
Conclusions References
Tables Figures
◭ ◮
◭ ◮
Back Close
Full Screen / Esc
Printer-friendly Version
Interactive Discussion
EGU
20%
1.94 !g m-3 Hawaii
Nitrate Sat ... Fri
1.2
1.1
1.0
0.9
0.8
Normalized concentration
Sat Sun Mon Tue Wed Thu Fri
Cluster means
!g m-3
1.5
1.0
0.5
Nitrate
1.2
1.1
1.0
0.9
0.8
Normalized concentration
Sat Sun Mon Tue Wed Thu Fri
Nitrate
Nov.-Mar. May-Sep.
ACPD
8, 521–548, 2008Weekly patterns of aerosol
D. M. Murphy et al.
Title Page
Abstract Introduction
Conclusions References
Tables Figures
◭ ◮
◭ ◮
Back Close
Full Screen / Esc
Printer-friendly Version
Interactive Discussion
EGU
20%
27 ng m-3 Hawaii
Lead
Sat ... Fri
1.2
1.1
1.0
0.9
0.8
Normalized concentration
Sat Sun Mon Tue Wed Thu Fri Cluster means
0.32
0.30
0.28
0.26
0.24
0.22
Pb / (Pb + Zn) 1.2
1.1
1.0
0.9
0.8
Normalized concentration
Sat Sun Mon Tue Wed Thu Fri Cluster means
!g m-3
2.5
2.0
1.5
1.0
0.5
x10
-3
Pb
ACPD
8, 521–548, 2008Weekly patterns of aerosol
D. M. Murphy et al.
Title Page
Abstract Introduction
Conclusions References
Tables Figures
◭ ◮
◭ ◮
Back Close
Full Screen / Esc
Printer-friendly Version
Interactive Discussion
EGU
5x10⁻⁶
4
3
2
1
0
Aerosol light absorption (m
-1 )
Sat Sun Mon Tue Wed Thu Fri
60x10-6
50
40
30
20
10
0
Light scattering (m
-1 )
Bondville 1999-2002 Southern Great Plains 1999-2005