N
2
O, NO, N
2
and CO
2
emissions from tropical savanna and
grassland of northern Australia: an incubation experiment with
intact soil cores
C. Werner1,2, K. Reiser2, M. Dannenmann2, L. B. Hutley3, J. Jacobeit4, and K. Butterbach-Bahl2 1Biodiversity and Climate Research Centre (BiK-F), Senckenberg Gesellschaft für Naturforschung,
Senckenberganlage 25, 60325 Frankfurt, Germany
2Institute for Meteorology and Climate Research, Institute for Atmospheric Environmental Research (IMK-IFU),
Karlruhe Institute of Technology, Kreuzeckbahnstrasse 19, 82467 Garmisch-Partenkirchen, Germany
3School of Environmental and Life Sciences, School of Environmental Research, Charles Darwin University,
NT 0909, Australia
4Chair of Physical Geography and Quantitative Methods, University of Augsburg,
Universitätsstraße 10, 86135 Augsburg, Germany
Correspondence to:C. Werner (christian.werner@senckenberg.de)
Received: 15 April 2014 – Published in Biogeosciences Discuss.: 5 June 2014
Revised: 24 October 2014 – Accepted: 27 October 2014 – Published: 7 November 2014
Abstract. Strong seasonal variability of hygric and ther-mal soil conditions are a defining environmental feature in northern Australia. However, how such changes affect the soil–atmosphere exchange of nitrous oxide (N2O), nitric
ox-ide (NO) and dinitrogen (N2) is still not well explored. By
incubating intact soil cores from four sites (three savanna, one pasture) under controlled soil temperatures (ST) and soil moisture (SM) we investigated the release of the trace gas fluxes of N2O, NO and carbon dioxide (CO2).
Fur-thermore, the release of N2due to denitrification was
mea-sured using the helium gas flow soil core technique. Under dry pre-incubation conditions NO and N2O emissions were
very low (<7.0±5.0 µg NO-N m−2h−1;<0.0±1.4 µg N2
O-N m−2h−1) or in the case of N2O, even a net soil uptake
was observed. Substantial NO (max: 306.5 µg N m−2h−1) and relatively small N2O pulse emissions (max: 5.8±
5.0 µg N m−2h−1) were recorded following soil wetting, but these pulses were short lived, lasting only up to 3 days. The total atmospheric loss of nitrogen was generally dominated by N2emissions (82.4–99.3 % of total N lost), although NO
emissions contributed almost 43.2 % to the total atmospheric nitrogen loss at 50 % SM and 30◦C ST incubation settings (the contribution of N2 at these soil conditions was only
53.2 %). N2O emissions were systematically higher for 3 of
12 sample locations, which indicates substantial spatial
vari-ability at site level, but on average soils acted as weak N2O
sources or even sinks. By using a conservative upscale ap-proach we estimate total annual emissions from savanna soils to average 0.12 kg N ha−1yr−1 (N
2O), 0.68 kg N ha−1yr−1
(NO) and 6.65 kg N ha−1yr−1 (N
2). The analysis of
long-term SM and ST records makes it clear that extreme soil saturation that can lead to high N2O and N2emissions only
occurs a few days per year and thus has little impact on the annual total. The potential contribution of nitrogen released due to pulse events compared to the total annual emissions was found to be of importance for NO emissions (contribu-tion to total: 5–22 %), but not for N2O emissions. Our results
1 Introduction
Tropical savanna ecosystems are one of the most impor-tant biomes of the earth and cover approximately 27.6 mil-lion km2 (Hutley and Setterfield, 2008) or 11.5 % of the global surface (Scholes and Hall, 1996). However, it is of-ten difficult to find concise and clear criteria to define the spatial extent of this biome, and thus scientists often use a wide range of areal estimates leading to substantial uncer-tainties in calculating the total contribution of this biome to the global soil–atmosphere exchange of nitrogen (David-son and Kingerlee, 1997). On a continental scale these areas can be constrained much better. Northern Australian tropi-cal savannas cover about 2 million km2(approximately 12 % of the global extent of the biome) and are located north of 20◦S in Western Australia, the northern part of the North-ern Territory and northNorth-ern Queensland (e.g., Lehmann et al., 2009; Williams et al., 2005). In addition to these natural and semi-natural landscapes, farmers have introduced im-proved pastures in northern Australia since the 1880s to increase productivity and their area expanded by approxi-mately 2500 km−2yr−1during the 1980s (Lonsdale, 1994).
Savanna systems experience pronounced intra-annual variability of rainfall (dry season conditions from 2 to 9 months) in addition to substantial inter-annual climatic fluc-tuations (Frost et al., 1986). In the tropical savanna zone of Australia the wet season is controlled by the Asian mon-soon and occurs from October to March. Precipitation ranges from over 2000 mm yr−1at coastal areas to<400 mm yr−1 inland (e.g., Russell-Smith and Yates, 2007) and declines by approximately 1 mm yr−1 per kilometer inland (Cook and Heerdegen, 2001). In addition to strong hygric variability savannas are also shaped by high fire frequencies (∼20 % burned annually, Dwyer et al., 2000). Tropical savanna of the coastal belt of northern Australia was found to burn even more frequently than the global average (up to 35 %, Russell-Smith et al., 2007).
Climatic conditions as well as fire activity control soil con-ditions and nutrient turnover in tropical savanna ecosystems as they affect soil temperature, soil moisture levels and thus oxygen availability in the soil matrix and availability as well as structure of organic matter other than inorganic nutrients. Biogenic N trace gases are produced in soils through the mi-crobial processes of nitrification and denitrification (Conrad, 1996), two key processes of N cycling in terrestrial ecosys-tems. The mineralization of organic material leads to the for-mation of ammonium (NH+4), which serves as a substrate for autotrophic and/or heterotrophic nitrification. Under aer-obic conditions, autotrophic and/or heterotrophic nitrifying organisms oxidize NH+4 via hydroxylamine (NH2OH) and
nitrite (NO2) to nitrate (NO−3). Anaerobic conditions in the
soil or in micro-sites promote the denitrification process, us-ing NO−3/NO2as alternative electron acceptors. Depending
on environmental conditions, NO−3 is reduced stepwise via
NO2, nitric oxide (NO) and N2O to inert nitrogen (N2). N2O
as well as NO emissions from soils depend on the rates of nitrification and denitrification and underlying environmen-tal conditions. Both processes can occur simultaneously in the soil due to the heterogeneity of soils with regard to gas diffusion and metabolic activity, which can create anaero-bic micro-sites even in well aerated soil. The primary con-trols of N2O as well as NO production and emission are
the availability of NH+4 and NO−3, the content of decompos-able organic substrate and the soil aeration status, whereas soil temperature and pH are secondary controls (see Baggs 2008 and Butterbach et al., 2013 for a summary of these pro-cesses and their functions). The significant variability of en-vironmental factors (soil, vegetation and hydrological prop-erties) across space and time (e.g., Davidson, 1991; Papen and Butterbach-Bahl, 1999) has often been demonstrated to control the magnitude and variability of N2O and NO
emis-sions from soils. Soil water status mainly regulating soil aer-ation conditions was found to act as the main driver for N2O
emissions in most tropical soils (e.g., Butterbach-Bahl et al., 2004b; Davidson, 1991; Grover et al., 2012; Linn and Do-ran, 1984; Werner et al., 2007b), although, due to the com-plexity of interacting environmental controls, it is difficult to obtain relationships of predictive value (Andersson et al., 2003). As savanna regions are characterized by climates with distinct wet and dry seasons (see above), the biogeochemi-cal processes and associated trace gas exchange can be ex-pected to also exhibit strong seasonal patterns following the hygric regime (e.g., Andersson et al., 2003; Eamus and Prior, 2001) – a feature also reported for other tropical ecosys-tems (seasonal tropical rainforest ecosysecosys-tems: Breuer et al., 2000; Butterbach-Bahl et al., 2004b; Werner et al., 2007b, 2006). Most data sets of N trace gas emissions from savanna soils show a substantial variation of N2O and NO emissions
on a seasonal-scale following the hygric conditions (e.g., Castaldi et al., 2004, 2006; Pinto et al., 2002), whereas on a site-scale emissions are mostly controlled by the variabil-ity of soil properties (Castaldi et al., 2004, 2006). As fire is a characteristic forcing in all savanna ecosystems (Bond and Keeley, 2005), it also affects the nitrogen cycle in a direct (pyrodenitrification loss of nitrogen) and indirect (conversion of part of the organic N to mineral N, which is added to the soil surface) way.
While literature can be found investigating the soil–atmosphere exchange of NO, N2O and CO2,
reli-able information about the release of N2 via microbial
denitrification is unavailable for savanna systems and still scarce for other terrestrial ecosystems (Butterbach-Bahl et al., 2013; Dannenmann et al., 2011; Groffman et al., 2006). This is, in part, due to the reluctantly accepted, but currently well-proven fact, that the previously widely used acetylene-inhibition technique fails to accurately quantify N2loss from soil (e.g., Felber et al., 2012).
The major problem in recording the loss of N2, the
0 10 20 30
0 20 40 60 35.6
14.9
J A S O N D J F M A M J
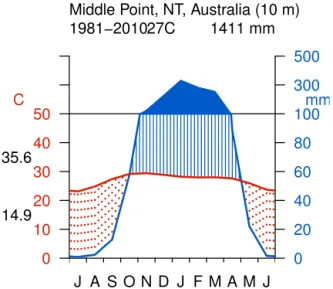
Figure 1. Climatic conditions at sampling sites (data: Bureau of Meteorology, Australia, http://www.bom.gov.au, years 1981–2010).
denitrification, is its abundance in the atmosphere and thus, precise measurements of N2 production of soil have to be
carried out with great sophistication. High-quality measure-ments are commonly only available from laboratory mea-surements under a controlled atmosphere using the gas-flow helium incubation method (Butterbach-Bahl et al., 2002) or by tracking the fate of15N-labelled substrate (e.g., Rolston et al., 1978). However, both methods are costly and time-consuming, and thus severely limiting the feasibility of large-scale replication experiments. As a consequence measure-ments of N2emissions from soils of terrestrial ecosystems
main scarce (Butterbach-Bahl et al., 2013). Nevertheless, re-liable N2measurements are a valuable tool in understanding
the nitrogen mass balances and biochemistry (Butterbach-Bahl et al., 2013).
In order to investigate gaseous emissions of C (CO2) and N
(N2O, NO, N2) compounds from tropical savanna and
grass-land systems in northern Australia, we extracted intact soil cores from various field sites and performed a range of incu-bation experiments under controlled thermal and hygric con-ditions.
For our study we hypothesize that NO and N2O gas fluxes
from the investigated savanna systems are generally low (be-low 0.1 kg N ha−1yr−1), and that re-wetting events have a
significant importance not only for NO but also for N2O
fluxes at annual scale. Moreover, we hypothesized that N2
fluxes should only occur at soil moisture levels greater 60 % water-filled pore space (WFPS).
The scope of the study was thus (a) to assess the mag-nitude of trace gas release under a range of environmental conditions typical for tropical savanna systems of northern Australia, (b) to deduce environmental regulators leading to the observed emissions and (c) to contrast the findings from natural savanna soil cores to samples derived from an
im-In this study we investigated two field sites approximately 30 km east of Darwin, Northern Territory, Australia, and tracted intact soil cores for our laboratory incubation ex-periments. The first site is located at 12◦30′S, 131◦05′E at 18–22 m a.s.l., Girraween. Vegetation was Eucalyptus tetrodontaandEucalyptus miniatadominated open-forest sa-vanna with a grass layer composed ofShorgumspp. and Het-eropogon contortus. The second site was established on man-aged grassland at Beatrice Hill Farm, Middle Point, located at 12◦36.5′S, 131◦18′E, approximately 25 km south-east of the savanna site. The farm estate is a long-term state-owned research station, operated by the Department of Primary In-dustry and Fisheries, Northern Territory.
This part of the Australian north is characterized by a strong seasonality of precipitation, with a pronounced dry season ranging from May to September. The dry season is followed by a period of intense convective thunderstorms (buildup), which marks the start of the wet season (Cook and Heerdegen, 2001). The long-term annual mean of precipita-tion for the closest climate staprecipita-tion (Middle Point) is 1411 mm (data: http://www.bom.gov.au, years 1981–2010; see Fig. 1 for a Walter and Lieth climatic diagram of this station). The dominant amount of annual precipitation (91 %) is received in the wet season, often as heavy afternoon thunderstorms. Due to the strong rainfall intensities, a substantial amount of this water does not penetrate the soil and is transported away via overland flow.
The intensity of the wet season, as well as the total amount of rainfall, varies substantially from year to year. The annual average temperature is 27◦C and the seasonal temperature variability is less pronounced with a mean daily temperature of 23.1◦C during the dry season and up to 29.4◦C (monthly means) during the buildup. The daily temperature amplitude varies much stronger with a maximum daily amplitude in July–August and a minimum in February.
The individual sampling positions are referenced as T1P1, T1P3 and T1P5 in the manuscript.
Site T1 is representative of many savanna sites found in the region under comparable hygric conditions (see e.g., Grover et al., 2013; Liveseley et al., 2011) and the typical natural fire regime is a fire for 2 out of 3 years (Hutley et al., 2011). The site was located in a peri-urban environment where fire management in recent years reduced fire frequency (a gen-eral phenomena observed for settlements in this region; El-liott et al., 2009) and woody cover was∼10 to 20 % higher at this site than the extensive surrounding savanna that is burned more frequently. Managed fires are usually lit fre-quently (fire return interval approximately 2–3 years) as low-intensity fires early in the dry season reducing the risk of higher intensity late dry season fires (P3, P5). The site P1 was privately owned and was not burned for more than 6 years (D. Georges, personal communication, 2010). Tree cover was highest at P1, while the landscape was more open towards the center of the transect. Tree cover increased again at P5 due to higher water availability at the bottom of the slope (cover approx. 40–50 %).
The improved pasture at the second site was established in the 1960s by clearing savanna vegetation and ploughing and seeding of pangola grass (Digitaria eriantha). The area was fertilized annually or every second year with approxi-mately 50 kg phosphorus, 100 kg superphosphate and 100 kg urea in single fertilization events. Buffalo (Bubalus bubalis) graze the improved pasture during the wet season and for 3–4 weeks during the dry season (grazing intensity: 1 beast ha−1 or 0.7 livestockunits ha−1), and a herd grazed the site un-til the soil cores were extracted. The site is referenced as T3P1 throughout the manuscript. This site is representative of floodplain-based grasslands of the Northern Territory, but soil textural composition differs slightly from site T1 (the difference is within site variance encountered in the area and thus deemed acceptable). Furthermore, in contrast to other sites in the area, land use history is well documented.
At each position 12 soil cores were extracted for the in-cubation experiments under dry season conditions in 2010 and air dried immediately. For this, plastic cylinders (height: 20 cm, diameter: 14 cm) were driven into the soil and the surrounding soil removed. The cores were then carefully lifted from the ground and the bottom of the cylinder sealed with appropriate pipe caps, packed and sent to the laboratory at IMK-IFU, Karlsruhe Institute of Technology (Garmisch-Partenkirchen, Germany) for analysis. The extracted soil cores were divided into three groups of four cores for each sample position. The three groups were used for independent analysis with different moisture levels (WFPS: 25 %, 50 %, 75 %; see section incubation setup for details) and each anal-ysis was replicated with three cores. One soil core was kept as a spare for each position.
2.2 Soil analysis
Soil organic carbon, total nitrogen, soil texture and soil pH were analyzed by a commercial laboratory for all sampling positions (Dr. Janssen, Gillersheim, Germany). Microbial C and N were measured using the chloroform fumigation-extraction technique (Brookes et al., 1985). We sampled and sieved soil from cores of each field position. Three sub-samples were immediately extracted with 60 mL 0.5 M K2SO4, while another three samples were fumigated with
chloroform vapor for 24 h and extracted similarly. Total or-ganic carbon (TOC) and total chemically bound nitrogen (TNb) were measured using a TOC analyzer (DIMATOC 2000, Dimatec Analysentechnik GmbH, Essen, Germany) and a coupled chemoluminescence detector, respectively. See Dannenmann et al. (2006) for more details.
2.3 Incubation setup and detection of N2O, NO, N2and CO2
In order to investigate the C and N trace gas exchange of the soil samples under a variety of environmental controls, we designed an incubation experiment. Soil water content of the stored cores was determined prior to the experiment gravi-metrically by drying samples derived from the spare repli-cate core. The samples were dried at 105◦C for 24 h. Bulk density of the samples was also measured (approximately at 10 cm depth,n=3) and used to calculate the pore volume and consequently the amount of water required to reach 25, 50 and 75 % WFPS.
WFPS[%] = Wvol 1−2BD
.65
Wvol volumetric water content,
BD bulk density [g cm−3], 2.65 particle density [g cm−3].
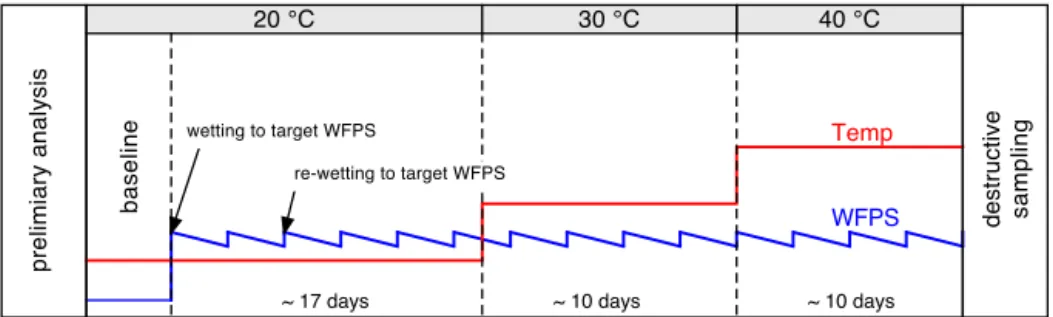
Figure 2.Schematic of the incubation setup. The soil moisture level of the cores was kept constant be readding water every second day, the temperature was raised stepwise from 20◦C, to 30◦C, and finally 40◦C. The incubation outlined in this figure was performed three times for separate soil cores (once for each of the three soil moisture levels, WFPS: water-filled pore space).
thermostat cabinets (Lovibond ET 651-8, Tintometer GmbH, Dortmund, Germany) at the prescribed incubation tempera-ture. The cabinets were ventilated with low-flow pumps to prevent CO2enrichment or temperature gradients.
The air-dried soil cores were measured for up to 10 days prior to the initial wetting at each incubation run to record the baseline emission and to test the detection setup. N2O,
NO and CO2 emissions were measured approximately
ev-ery second to third day. After the initial wetting, soil cores were incubated and measured until the initial pulse event lev-eled off and flux rates approached a relatively stable emission level. Afterwards, the temperature was raised to 30◦C and measurements continued. After approximately 10 days of in-cubation at 30◦C, the temperature was increased again by 10◦C to 40◦C. A schematic of the incubation and measure-ment schedule is given in Fig. 2 (note that due to laboratory access limitations we did not measure the 40◦C incubation step in the M25 run).
The static chamber technique (e.g., Smith et al., 1995) was used to measure N2O and CO2 fluxes. The soil cores
were closed with gas-tight lids equipped with a port and sep-tum for gas sampling. The headspace of each of the 12 soil cores (T1P1, T1P3, T1P5 and T3P1;n=3) was determined individually (average headspace volume 1.54 L). Four gas samples of 5 mL chamber air were drawn from the port at 0, 20, 40 and 60 min after closure using 20 mL plastic sy-ringes fitted with three-way stop-cocks and injected into vac-uumed sampling veils. The sample veils and a set of veils with standard gas mixture for calibration (0.4 ppmv N2O,
400 ppmv CO2; Air Liquide, Düsseldorf, Germany) were
placed into two auto-sampler systems (HT280T, HTA s.r.l., Brescia, Italy) attached to gas chromatograph (SRI 8610C, SRI Instruments, Torrance, CA, USA) systems equipped with a63Ni electron detector (ECD) for N2O analysis and an
flame ionization detector and methanizer for CO2 analysis.
We used high-purity N2as carrier gas and installed Ascarite®
filter to exclude any interference of CO2on N2O detection.
Flux rates of N2O and CO2 were calculated from the
ob-served linear increases of sampled chamber air using linear regression (e.g., Papen and Butterbach-Bahl, 1999).
Nitric oxide emissions were measured immediately after sampling for N2O/CO2 analysis using a dynamic chamber
technique (e.g., Yamulki et al., 1997) and chemolumines-cence detector (CLD 770 AL ppt, Ecophysics AG, Durnten, Switzerland). A sealing lid with inlet and outlet fittings was attached to the soil core, and synthetic air (79 % N2, 21 % O2)
was pumped through the headspace. The NO flux was calcu-lated from the inlet/outlet NO concentrations in a dynamic equilibrium with constant gas flow rate. Steady-state condi-tions were reached approximately after 20–25 min, and the average detected flow rate over 5 min after this grace period was used to determine the flux. The detector was periodically calibrated in the laboratory with standard gas and a calibra-tion unit (for details see, Butterbach-Bahl et al., 1997).
Following N2O, CO2and NO flux measurements of an
in-cubation run (M25, M50 and M75 inin-cubation runs, respec-tively), soils from the experiments were finally used to mea-sure N2fluxes by the helium gas flow technique
(Butterbach-Bahl et al., 2002). For this any three replicated soil cores of one sample site were destructively subsampled (2–3 samples per individual core) and stored in the compartments of one helium soil core incubation vessel. The gas flux measure-ments were conducted after, once again, wetting the soil ma-terial to the required moisture level. The closed vessels were then exposed to a series of temperature settings (20◦C, 30◦C and 40◦C).
The custom-build system developed for soil core incuba-tion is described in detail in Dannenmann et al. (2011). The system consists of two vessels for N2 and N2O emissions
measurements, and each vessel holds seven soil cores of 4 cm height and 100 cm3 volume each, which are incubated to-gether in order to account for soil spatial heterogeneity. Prior to flux measurements, the soil and headspace atmosphere in the vessels are replaced by an artificial gas mixture (20 ppm N2, 400 ppb N2O and 20 % O2in helium) by 2 days of gas
flushing from bottom to top through the soil cores. The re-quired extreme gas tightness of the vessels against intrusion of atmospheric N2is ensured by double sealings purged with
the soil and headspace flushing period, N2and N2O
concen-trations are measured hourly in the headspace over a period of 8 h in order to allow for calculation of N2and N2O gas
fluxes (Butterbach-Bahl et al., 2002). Similar to previous use of the system (Dannenmann et al., 2011), regular measure-ments with empty vessels showed no increase of N2 in the
system over the measurement period.
2.4 Data analysis and presentation
All analysis and plotting was carried out using R 2.15 (R Development Core Team, 2011). Differences between mea-sured gas fluxes at the various incubation settings and tests for comparable air-dried soil conditions were investigated us-ing a multiple comparison of means procedure (Herberich et al., 2010), as group sizes and distributions varied substan-tially in the comparison. Relative importance of environmen-tal factors controlling trace gas emissions was assessed using multiple linear regression analysis and a tool for variance de-composition (proportional marginal variance dede-composition, R package relaimpo; see Grömping, 2007). Statistical signif-icance is given at the 95 % difference level (p≤0.05), and error bars denote standard deviation if not specified other-wise. N2O uptake rates are presented as negative emissions.
3 Results
3.1 Soil analysis
Physicochemical properties of the sampled soil cores are given in Table 1. All cores had a very sandy texture com-position (T1>80 %, lower for cores sampled at T3 = 68 %), but the pasture site T3 had a higher fraction of clay (15 %). Note that this discrepancy is within the landscape variability encountered in this area. Bulk density was highest at posi-tion T1P5 (1.7 g cm−3) and in a range of 1.4 to 1.5 g cm−3 for the other soil cores. Soil pH was ranging from 4.4 to 5.1. At 0.8 and 0.7 %, total organic carbon was very low for sites T1P3 and T1P5, respectively, higher at the grass-land site T3P1 (1.5 %) and highest for site T1P1 (2.8 %). Total nitrogen concentrations were also low and ranged be-tween 0.04 % and 0.1 %. The C/N ratios were also widest for site T1P1 (24.1) and most narrow for site T1P5 (15.5). With 222.1 µg C g−1soil dry weight (sdw) microbial carbon and 35.7 µg N g−1sdw microbial nitrogen, the samples from the
improved pasture site were approximately 2.3–3.6 times (car-bon) and 4.7–7.8 times (nitrogen) richer, respectively, in mi-crobial nitrogen than the samples from natural savanna (T1). Ammonium concentrations were low for the soil samples from the savanna transect positions ranging from 2.4 to 3.9 µg N g−1 sdw, but almost a magnitude higher for the sam-pled grassland site (23.6 µg N g−1 sdw). Nitrate concentra-tions did not vary significantly between the two sampled sites (T1: 5.5–12.1 µg N,g−1sdw, T3: 9.7 µg N,g−1sdw).
3.2 Gas fluxes
3.2.1 CO2emissions
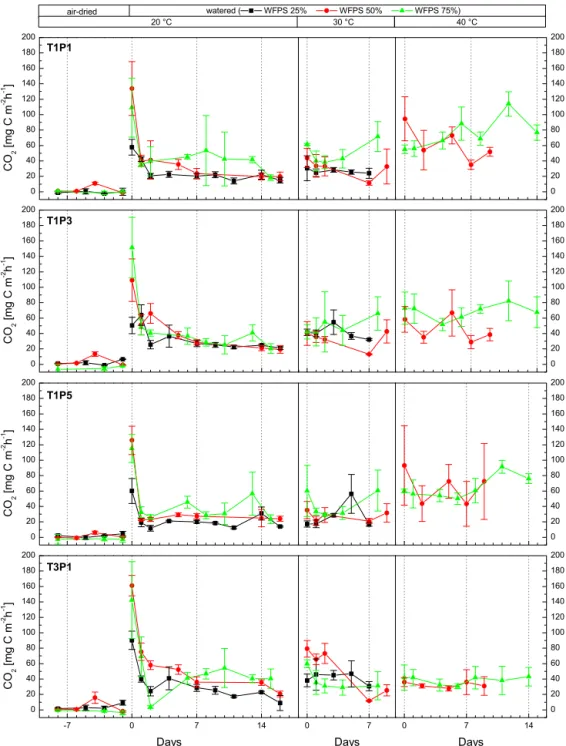
The CO2 baseline emissions during pre-incubation
(unwa-tered, 20◦C) were 0.1±2.7 mg C m−2h−1 (T1) and 1.0± 3.8 mg C m−2h−1 (T3) and not significantly different be-tween transect positions or transects. Immediately after wa-tering the soil cores, CO2 emissions rose for all three
wa-tering levels (M25, M50 and M75) and all replicates (see Fig. 3). Peak emissions generally occurred immediately af-ter waaf-tering (day 0 of incubation section: D0), and emis-sions at the following day (D+1) dropped to 70 % (M25), 38 % (M50) and 37 % (M75) of the initial pulse emission response recorded at D0. After 2 days (D+2), CO2
emis-sions declined further to levels of 26–34 % before stabi-lizing at those levels and eventually increasing again (see Fig. 3). During the pulse emission event (D0−D+2), the average CO2emission was 62.8±43.7 mg C m−2h−1(min:
7.7 mg C m−2h−1, max: 195.1 mg C m−2h−1). Pulse inten-sity was found to differ significantly between natural savanna soil cores of transect T1 (55.5±39.8 mg C m−2h−1) and improved pasture at transect T3 (75.1±46.4 mg C m−2h−1), but not between individual transect positions. After the ini-tial pulse event, CO2 emissions remained relatively
sta-ble for all three moisture levels at 20◦C soil tempera-ture (Fig. 3). The immediate emission after initial water-ing indicates that the release is predominately a physi-cal displacement rather than microbially driven. Average CO2 emissions at 20◦C (after the pulse event) were 19.2±
6.4 mg C m−2h−1 (M25), 23.1±6.9 mg C m−2h−1 (M50)
and 36.2±18.5 mg C m−2h−1 (M75), indicating a direct
link between soil moisture and CO2 emission strength.
Fluxes recorded at M75 were significantly higher than those obtained at M25 and M50 (p <0.001). In contrast to the pulse emission, CO2 emissions from T3 (30.5±
16.2 mg C m−2h−1) were not significantly higher than those from T1 (25.2±13.9 mg C m−2h−1). No significant differ-ence between individual transect positions was detected. It is noteworthy that CO2emissions for some individual cores
(T1P1R1, T1P3R1; R1 being the replicate number to iden-tify a individual core) were substantially higher for M75 conditions than those from the other two replicates, result-ing in high standard deviations. At 30◦C soil temperature, average CO2emissions were again not found to differ
sig-nificantly between T1 (36.0±17.2 mg C m−2h−1) and T3
(43.3±20.8 mg C m−2h−1,n=45), but moisture levels were
again significantly correlated with higher emissions (M25: 34.1±14.5 mg C m−2h−1, M50: 35.6±20.4 mg C m−2h−1, M75: 44.0±18.6 mg C m−2h−1). No significant differences were recorded for CO2 fluxes from cores originating from
different transect positions, indicating that physicochemical soil properties did not have a major influence on CO2
Figure 3.Average CO2emission per site (savanna: T1P1, T1P3, T1P5; grassland: T3P1) for three soil moisture (black: 25 % water-filled pore space (WFPS), red: 50 % WFPS, green 75 % WFPS) and three temperature levels (xaxis days since incubation change/negative values indicate pre-incubation period; error bars: standard deviation;n=3).
for transect positions or transects, as the higher moisture lev-els (M50 and M75 only) lead to biased mean fluxes due to the strong response of CO2fluxes to moisture levels. See the
discussion section for an in-depth analysis of temperature ef-fects on emissions.
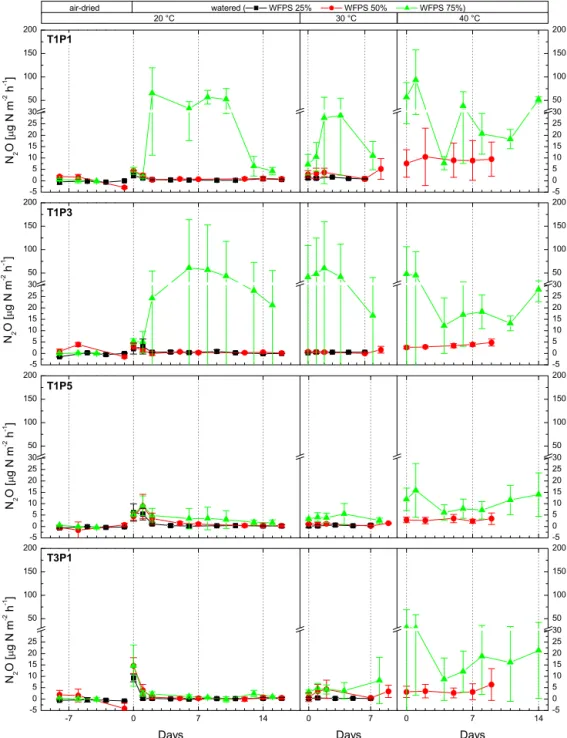
3.2.2 N2O emissions
Nitrous oxide emissions under pre-incubation conditions were low and did not differ significantly between tran-sect positions or trantran-sects (T1: 0.0±1.4 µg N m−2h−1, T3: −0.2±1.9 µg N m−2h−1). We measured low N2O uptake or
zero N2O flux for 8 out of 12 cores at pre-incubation
Table 1. Physicochemical properties of the sampled soil and mean microbial biomass (sampling depth 0–20 cm; ∗ µg C/N g[dry weight]soil−1; BD: bulk density).
Land use Pos. Soil texture (%) BD Org. C Total N pH Microbial biomass (∗) NH+4 NO−3
Sand Silt Clay (g cm−3) (%) (%) C N (∗) (∗)
Natural T1 P1 81 12 7 1.4 2.8 0.1 5 97.5 18.4 3.1 12.1 savanna T1 P3 87 8 5 1.5 0.8 0.04 4.4 81.8 21.0 3.9 7.2
T1 P5 87 10 3 1.7 0.7 0.05 5.1 61.0 14.5 2.4 5.5 Pasture T3 P1 68 17 15 1.5 1.5 0.1 4.6 222.1 23.3 23.6 9.7
0.3 to 3.6 µg N m−2h−1. Increased N2O emissions were
de-tected immediately after watering the cores (D0), but aver-age emissions during the defined peak event (D0 – D+2) were relatively modest for 33 out of 36 cores sampled at T1 (avg.: 3.2±3.1 µg N m−2h−1, max: 13.7 µg N m−2h−1) and T3 (avg.: 4.9±6.2 µg N m−2h−1, max: 24.2 µg N m−2h−1), but the results for T1 and T3 were not significantly different. Very strong N2O emissions were recorded for
three individual cores at M75 (T1P1R1: 85.8 µg N m−2h−1, T1P1R2: 106.2 µg N m−2h−1, T1P3R1: 180.2 µg N m−2h−1) after a delay of 2 or 6 days and remained systematically higher throughout the incubation experiment (see Fig. 4). Due to their distinctly different emission patterns, those three cores are excluded from further analysis here and dis-cussed in detail at the end of this section. Intensity of pulse emissions correlated positively with saturation levels (M25: 2.7±3.2 µg N m−2h−1, M50: 3.2±4.1 µg N m−2h−1, M75: 5.8±5.0 µg N m−2h−1). After the initial pulse, N2O
emis-sions at 20◦C were 1.2±3.8 µg N m−2h−1 (T1) and 0.6± 1.0 µg N m−2h−1 (T3), and no significant differences were detected for transect positions or transects. At 30◦C, N2O
emissions increased slightly to 1.4±1.8 µg N m−2h−1(T1) and 2.6±5.1 µg N m−2h−1 (T3). At 40◦C, N2O emission
substantially increased over the results obtained at 30◦C, but due to missing results for the M25 incubation run, we do not report site averages here.
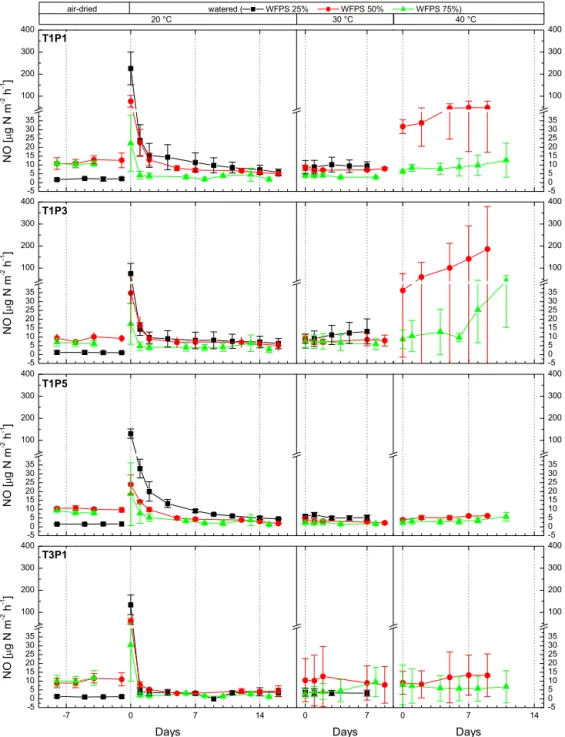
3.2.3 NO emissions
Pre-incubation emissions were 6.7±4.3 µg N m−2h−1(T1) and 7.0±5.0 µg N m−2h−1 (T3), and no significant differ-ences were detected between the transect positions or tran-sects. Large NO emission pulses of 27.7–306.5 µg N m−2h−1
were recorded after the addition of water at D0 (see Fig. 5). Furthermore, NO emission strength was neg-atively correlated with water saturation (M25: 141.2± 70.9 µg N m−2h−1, M50: 48.4±26.6 µg N m−2h−1, M75: 22.1±15.2 µg N m−2h−1), and pulse strength did not signifi-cantly differ between transects. NO emissions on the follow-ing day (D+1) dropped sharply to 16 % (M25), 40 % (M50) and 28 % (M75) of the initial pulse emission response at D0. After 2 days (D+2), NO emissions further decreased to 10–26 % of the emission of D0. After the initial pulse,
aver-age NO emissions at 20◦C were below pre-incubation lev-els and ranged from 3.2±1.8 to 5.8±2.9 µg N m−2h−1for the four transect positions being 4.9±2.7 µg N m−2h−1at T1 and 3.2±1.8 µg N m−2h−1at T3 (differences not significant). NO emissions increased at 30◦C incubation temperature to 6.7±4.3 µg N m−2h−1(T1) and 6.5±6.9 µg N m−2h−1(T3). At 40◦C, a marked increase of NO emission was observed for the majority of soil cores watered to 50 % WFPS (for 5 of the 12 cores increase from 30 to 40 ◦C >200 %, for 11 of 12 cores>60 %) while NO emissions at 75 % WFPS only increased slightly or remained constant (see Fig. 5). Again, as no M25 measurements are available, we do not give site averages for 40◦C, but the significant increase of NO emissions can be highlighted when M50 and M75 NO emissions obtained at 40◦C are compared to the fluxes measured under 30◦C. NO emissions under medium mois-ture levels (M50) increased from 6.7±5.1 µg N m−2h−1at 30◦C to 52±87.5 µg N m−2h−1, while high moisture lev-els (M75) only led to an increase of 5.0±4.9 µg N m−2h−1 to 11.5±13.7 µg N m−2h−1. A negative correlation between moisture levels and NO emission strength was observed for all episodes of the incubation experiment. We did not detect significant differences between both land use types for tem-peratures up to 30◦C, but at 40◦C, NO emission was signif-icantly higher at the savanna transect than at the improved pasture.
3.2.4 N2emissions
An incubation setup with the same number of replications as performed for N2O, NO and CO2measurements was not
feasible due to the time required to perform a single N2
mea-surement (see Sect. 2.3). We thus report results as transect averages (T1,n=3) and single measurement incubation re-sults (T3). However, in each measurement cycle, soil from all replicate cores was pooled in the sampling cuvette and thus, the results are based on multi-core soil conditions (in case of T3 without true measurement replication). Dinitro-gen emissions varied between 16.7 and 2350.4 µg N m−2h−1. As shown in Table 2, N2emissions were strongly influenced
by water saturation. Average N2 emissions increased from
Figure 4.Average N2O emission per site (savanna: T1P1, T1P3, T1P5, grassland: T3P1) for three soil moisture (black: 25 % water-filled pore space (WFPS), red: 50 % WFPS, green 75 % WFPS) and three temperature levels (xaxis days since incubation change/negative values indicate pre-incubation period, error bars: standard deviation,n=3).
M50. Although no true replication is available for T3 results, a similar pattern can be observed, but we do not contrast results from the two transects due to differences in sample numbers.
In general, N2 emissions dominate the gaseous nitrogen
losses at T1 (see Table 3). While N2O emissions only account
for 0.3–3.6 % of gaseous N losses, N2emissions represent up
to 99.3 %. Note that inclusion of N2O outlier emissions
re-duced the share of N2losses only by one percent (Table 3).
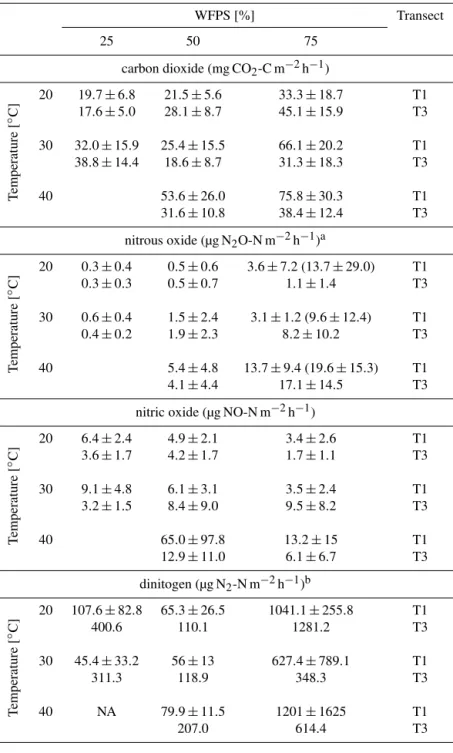
Table 2.Average CO2, N2O, NO and N2emission at different moisture and temperature incubation settings (fluxes reported post-pulse;a value excluding outliers/brackets including outliers;bN2: T1n=3, T3: no replicates; NA: not available).
WFPS [%] Transect
25 50 75
carbon dioxide (mg CO2-C m−2h−1)
T
emperature
[
◦C]
20 19.7±6.8 21.5±5.6 33.3±18.7 T1 17.6±5.0 28.1±8.7 45.1±15.9 T3
30 32.0±15.9 25.4±15.5 66.1±20.2 T1 38.8±14.4 18.6±8.7 31.3±18.3 T3
40 53.6±26.0 75.8±30.3 T1 31.6±10.8 38.4±12.4 T3
nitrous oxide (µg N2O-N m−2h−1)a
T
emperature
[
◦C]
20 0.3±0.4 0.5±0.6 3.6±7.2 (13.7±29.0) T1 0.3±0.3 0.5±0.7 1.1±1.4 T3
30 0.6±0.4 1.5±2.4 3.1±1.2 (9.6±12.4) T1 0.4±0.2 1.9±2.3 8.2±10.2 T3
40 5.4±4.8 13.7±9.4 (19.6±15.3) T1 4.1±4.4 17.1±14.5 T3
nitric oxide (µg NO-N m−2h−1)
T
emperature
[
◦C]
20 6.4±2.4 4.9±2.1 3.4±2.6 T1 3.6±1.7 4.2±1.7 1.7±1.1 T3
30 9.1±4.8 6.1±3.1 3.5±2.4 T1 3.2±1.5 8.4±9.0 9.5±8.2 T3
40 65.0±97.8 13.2±15 T1 12.9±11.0 6.1±6.7 T3
dinitogen (µg N2-N m−2h−1)b
T
emperature
[
◦C]
20 107.6±82.8 65.3±26.5 1041.1±255.8 T1
400.6 110.1 1281.2 T3
30 45.4±33.2 56±13 627.4±789.1 T1
311.3 118.9 348.3 T3
40 NA 79.9±11.5 1201±1625 T1
207.0 614.4 T3
4 Discussion
4.1 CO2emissions
Decomposition of organic matter and root respiration leads to the emission of CO2from the soil, but since the soil cores
were removed from the field and any existing fine roots were cut, the observed fluxes represent only soil respiration CO2
efflux. Even though our major focus was on the emission of nitrogen gases, CO2emissions can also be useful as a proxy
to identify the relative availability/production of substrate for the microbial processes responsible for N2O, NO and N2
losses.
Carbon dioxide emissions increased with rising tempera-ture and high moistempera-ture levels (Table 2), and soil temperatempera-ture was identified to have the highest relative importance, fol-lowed by soil moisture variations, in explaining the observed CO2emissions (Fig. 6). The strong temperature dependency
of decomposition and associated CO2emissions, given a
T
emp.
40 NA 3.6 : 43.2 : 53.2 1.1 : 1.1 : 97.8 (1.7 : 1.1 : 97.3)
reported for many ecosystems (Raich and Schlesinger, 1992). In general, CO2 emissions from tropical savanna in
north-ern Australia were found to increase through the seasons (dry, wet–dry transition, wet), but due to relatively minor seasonal variations in temperature, changes in soil moisture are considered to be the dominant control in these ecosys-tems (Grover et al., 2012). This was also reported for African savannas (Brümmer et al., 2009a) and the wet–dry trop-ics of the Amazon Basin (Davidson et al., 2000). Strong break-of-season (pulse) emissions ranging between 100 and 250 mg C m−2h−1 were previously reported for natural sa-vanna in Africa (Brümmer et al., 2009a) and are in-line with our observations. We found no significant differences in av-erage CO2emissions between pasture cores and cores from
the natural savanna site.
4.2 N2O emissions
Measurements of gaseous nitrogen losses from tropical savanna are still scarce in the literature (e.g., Castaldi et al., 2006; Dalal and Allen, 2008; Stehfest and Bouw-man, 2006; Steinkamp and Lawrence, 2011) and to our knowledge no previous study investigated the emission of N2O, NO and N2 simultaneously. Annual N2O
emis-sions from tropical savanna systems were reported to range from 0.06 to 1.46 kg N yr−1(mean: 0.6 kg N yr−1) and to be lower for Australian savannas (0.06–1.08 kg N yr−1, median: 0.19 kg N yr−1) due to drier conditions and smaller amounts of N deposited from the atmosphere (Dalal and Allen, 2008). From previous in situ measurements at an area close to tran-sect T1, it was calculated that soils only acted as minor sinks or sources for N2O annually (−0.015 kg N ha−1yr−1;
Lives-ley et al., 2011), a result also found to be true for savanna soils of the Daly River south of our site, which receives substantially less annual precipitation (0.02 kg N ha−1yr−1,
Grover et al., 2012).
For total site exchange, it has to be noted that termite mounds have been identified as hotspots of N2O emissions
in savannas (e.g., Brümmer et al., 2009b) and are abundant in savannas of tropical Australia (Dawes-Gromadzki, 2008), but the total contribution to the soil–atmosphere exchange is highly variable in space. It was also reported that
below-ground termite activity can (often only temporarily) add to on-site variability of measured in situ fluxes (Livesley et al., 2011). Very low N2O emission or even soil N2O uptake was
also previously reported for tropical savanna soils under dry season conditions (Andersson et al., 2003; Castaldi et al., 2006; Donoso et al., 1993; Livesley et al., 2011; Sanhueza et al., 1990), and low mineral N content was considered to be a major controlling factor (Rosenkranz et al., 2006), although many other controls and processes are discussed (Chapuis-Lardy et al., 2007).
We also observed very low N2O emissions and occasional
N2O uptake by the soil cores with a maximum soil
up-take rate of−6.2 µg N m−2h−1during pre-incubation
mea-surements of our air-dried soil samples at 20◦C. At low (M25) and medium (M50) moisture conditions, average N2O
emissions ranged from 0.3 to 5.4 µg N m−2h−1and were in-line with the low N2O emissions previously observed from
nearby sites (Grover et al., 2012; Livesley et al., 2011). The observed N2O uptake rates are also in-line with the
re-ported range of−1.0 to−10 µg N m−2h−1 for upland soils (Schlesinger, 2013).
The N2O emissions, observed for the improved pasture
site under dry to medium moisture levels, were also low and did not differ significantly to the natural savanna site, which was to be expected as the analysis of physicochemi-cal properties did not reveal significant differences between the two plots either (Table 1). This similarity is somewhat remarkable as the improved pasture site did receive substan-tial amounts of P and N over 40 years. Similar results were reported for young and old pastures under dry season con-ditions in the Daly region, Northern Territory, Australia, but emissions from old pasture under wet conditions were higher (>25 µg N m−2h−1). A direct comparison is difficult, how-ever, as the soil water content reported (dry:∼5 % WFPS, medium:∼37 % WFPS, wet:∼53 % WFPS) does not align with our incubation setup. However, the general range of re-ported in situ flux measurements from savanna and pasture shows good agreement with our laboratory results (Grover et al., 2012).
Figure 5.Average NO emission per site (savanna: T1P1, T1P3, T1P5; grassland: T3P1) for three soil moisture (black: 25 % water-filled pore space (WFPS), red: 50 % WFPS, green 75 % WFPS) and three temperature levels (xaxis days since incubation change/negative values indicate pre-incubation period; error bars: standard deviation; n=3).
exhibiteddifferent emission patterns. In contrast to the other cores, N2O emission increases of those cores
were delayed by 2–3 days, and strong N2O
emis-sions (T1P1R1: 33.7±29.8 µg N m−2h−1, T1P1R2: 26.3± 17.8 µg N m−2h−1, T1P3R1: 52.3±37.0 µg N m−2h−1,n= 8) were measured throughout the incubation run. If those out-lier results are included (see Table 2), average N2O emissions
are 1.4–3.8 times higher and thus substantially higher than those reported for savanna soil and on par with reported
N2 R2
(non−adj.):41.4% CO2 R2
(non−adj.):51%
0
0 25 50 75 100
Clay Corg Ntot pH Sand Temp Wfps Clay Corg Ntot pH Sand Temp Wfps
Relativ
e impor
tance [%]
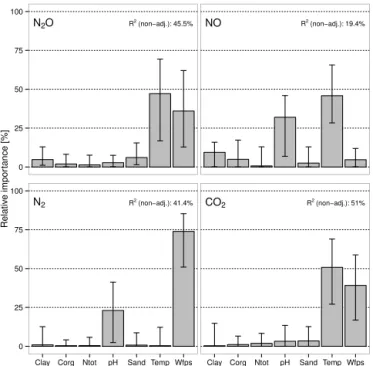
Figure 6. Relative importance of environmental factors clay, or-ganic carbon (Corg), total nitrogen (Ntot), sand, temperature and water-filled pore space (WFPS) on N2O, NO, N2and CO2 emis-sions (based on proportional marginal variance decomposition,R2 values give total predictability of each model).
site-scale soil–atmosphere fluxes. However, the nature of in-cubation experiments (i.e., the need for timely replicate sam-pling, laboratory constrains and climate controlled storage) severely limits the number of samples, though the gas pool-ing technique may offer ways to overcome spatial hetero-geneity (Arias-Navarro et al., 2013; Morris et al., 2013).
Nitrous oxide emissions were positively correlated with temperature and soil moisture (see Table 2), and their vari-ations were found to explain 58.6 and 41.3 %, respectively, of the variance of N2O emissions if a simple linear
two-parameter regression model was used (proportional marginal variance decomposition (PMVD) method, total variance: 46.0 %). Inclusion of soil properties did not further improve the linear model (see decomposition plot, Fig. 6). Previous results also show a positive correlation between soil temper-ature and N2O emissions (Castaldi et al., 2010), but other
authors found no clear linear correlation (Brümmer et al., 2008; Scholes et al., 1997), although observing clear diurnal patterns (Brümmer et al., 2008). Previous studies from trop-ical savanna and seasonally dry troptrop-ical forest sites identi-fied changes in WFPS to dominate the N2O emission patterns
(Brümmer et al., 2008; Castaldi et al., 2010; Davidson et al., 1993; Grover et al., 2012; Rees et al., 2006), but in general, N2O emissions from undisturbed savanna soil ranked lowest
for seasonally dry ecosystems due to low nutrient availabil-ity and soil textures favoring quick drainage (Castaldi et al., 2006). In accordance, significant positive correlations were
forests (e.g., Butterbach-Bahl et al., 2004b; Gharahi Ghehi et al., 2012; Kiese et al., 2003; Werner et al., 2007b), the annual N2O emissions from savanna soils seem to be
sub-stantially lower, which is hypothesized to originate from N depletion via pyrodenitrificatory losses (bush fires), shorter wet periods with prevailing denitrificatory conditions in com-bination with well-drained soils and lower amounts of to-tal nitrogen cycling within the system (Casto-taldi et al., 2006; Davidson et al., 2001). Other studies have not found signifi-cant effects of soil moisture on N2O emissions under in situ
conditions (Livesley et al., 2011), and is assumed that a lack of seasonality and low nitrogen levels provide the rationale for this observation.
4.3 NO emissions
that a strong linear increase of NO emissions occurs with increasing temperatures starting at 25 to 30◦C (Aranibar et al., 2004). It was also reported that NO emission decreases again at a soil temperature exceeding 40◦C (Passianoto et al., 2004), but such extreme soil temperatures were not included in our experimental setup. In accordance with this, the analy-sis of site T1 cores (savanna) showed strongest emissions for pulsing after the initial rewetting and the following incuba-tion steps for the lowest soil moisture treatment (M25). It is noteworthy that pulse emissions again were slightly stronger at M25 conditions for pasture cores; the following measure-ments revealed no difference in emission strength between the three moisture levels at the first temperature interval. At 30◦C soil temperature, emissions for the driest cores re-mained low but M50 cores exhibited higher NO emissions (see Fig. 5).
Unfortunately, no measurements were conducted for low moisture conditions (M25) and high soil temperatures (40◦C) during the first incubation sequence of our work; thus, we can only speculate that NO emissions at low mois-ture levels (M25) would have even exceeded our maximum NO emissions recorded due to nitrification activity peaking at moisture levels below 50 % WFPS (see literature citations above).
4.4 N2emissions and total gaseous nitrogen losses
Dinitrogen emissions varied greatly between the different incubation setups (17–2350 µg N m−2h−1), and this range is comparable to results reported for temperate forests (Butterbach-Bahl et al., 2013; Dannenmann et al., 2008). The N2emission rates were clearly dominated by soil saturation
(see Table 2 and Fig. 6). Average N2emissions for savanna
soil below 50 % WFPS and under any implemented tempera-ture setting were ranging from 45 to 108 µg N m−2h−1, while average N2 emissions with highest water saturation (M75)
were ranging from 627 to 1201 µg N m−2h−1. It is thus not surprising that the analysis of relative importance revealed that approximately 75 % of the variance of N2emissions was
explained by changes in WFPS. Variations in pH accounted for another 23 % of variance (Fig. 6), while the other fac-tors contributed considerably less to explain the observed N2
emissions. The dominance of WFPS is in line with common knowledge about the functioning of denitification, given that N2 production is catalyzed by the enzyme N2O–reductase,
which in turn is up-regulated by low oxygen concentrations (Spiro, 2012). From calculating fractions it is clear that N2is
the dominant compound of gaseous losses, often exceeding N2O and NO emissions by several magnitudes (Table 3). N2
accounted for 82–99 % of all gaseous N losses from savanna soils for the investigated incubation intervals, except for the 50 % WFPS/40◦C setup, where strong NO emissions were accounting for 43 % of all N emissions.
The N2-dominated N gas product ratios across all soil
moisture levels might appear surprising at first, since strong
N2soil emission has been associated with strictly anaerobic
soil conditions and the investigated sandy soil textures may facilitate good aeration and thus impair formation of anaer-obic microsites. It is, however, increasingly recognized that our previous knowledge on rather low N2loss from
ecosys-tems is falsified by systematic but irreproducible underesti-mation of N2 emission estimates due to the failure of the
widely applied acetylene inhibition technique to indirectly estimate N2loss (Butterbach-Bahl et al., 2013). In contrast,
the few available reliable direct measurements of N2
emis-sion from upland soil obtained with state-of-the-art methods, such as the helium soil core incubation technique, generally revealed large ecosystem N2losses (Butterbach-Bahl et al.,
2013). This is in line with recent evidence about unexpect-edly large abundance and diversity of the N2O reducing
mi-crobial community in soil, not restricted to denitrifiers (Jones et al., 2013; Sanford et al., 2012). The latter findings could provide a microbiological explanation for high importance of N2loss in upland soil in general and probably also for the
savanna soils investigated in this study.
4.5 Pulse emissions
Significant N2O pulse emissions following the first rains
af-ter a dry season, often with a small temporal delay, have been reported for different seasonally dry (sub-)tropical ecosys-tems (Brümmer et al., 2008; Davidson et al., 1993; Scholes et al., 1997; Werner et al., 2007a) and are often preceded by significant CO2 emissions immediately after the soil is
re-moistured. We also measured significant CO2pulse
emis-sions for all three watering levels immediately after water addition, but emissions dropped significantly in the follow-ing days. It has been stated that this pattern is caused by water-induced activation of soil microbes after pronounced dry season periods leading to immediate mineralization of accumulated organic material and subsequent consumption of freshly produced NH+4 / NH−3 trough nitrification (David-son et al., 1993).
The initial watering led to N2O pulse emissions with peak
emissions immediately after water addition, but they were, with 3 days duration, only short lived (a pattern that was pre-viously reported for African savanna soil; Brümmer et al., 2008; Scholes et al., 1997). The occurrence of N2O pulsing
emissions was previously reported by Grover et al. (2012) for in situ measurements at a nearby savanna site, but emissions were, in accordance with our laboratory results, several mag-nitudes below reported break-of-seasons pulse emissions re-ported for tropical rainforests (Butterbach-Bahl et al., 2004b; Werner et al., 2007b). We did observe a positively correlated increase of N2O pulse emissions with watering intensity, but
part in models simulating global NO emissions (Steinkamp and Lawrence, 2011; Yan et al., 2005; Yienger and Levy, 1995). The immediate emission of NO after watering was also observed by Pinto et al. (2002), who measured up to 100-fold increased NO emissions above pre-watering levels to 105 µg N m−2h−1, but noted that results varied substantially between collars. These results are in-line with our observed peak pulse emissions, which also varied between 27.7 and 306.5 µg N m−2h−1. In contrast to N
2O peak emission, the
response was negatively correlated with moisture saturation. For soils of seasonally dry tropical rainforests in Mexico and Australia, high rates of NO emissions and quick temporal re-sponses to the first rainfall events were observed (Butterbach-Bahl et al., 2004b; Davidson et al., 1993, 1991). The authors also state that rainfall events during the wet season triggered only minor emission events, providing pointers that the dura-tion and severity of antecedent dry periods ultimately deter-mine the magnitude of response of NO emissions to wetting events (Butterbach-Bahl et al., 2004a; Davidson et al., 1993). Thus, these pronounced pulse emissions events are thought to contribute substantially to the annual total of NO emissions (Butterbach-Bahl et al., 2004b; Ludwig et al., 2001).
Due to incubation design and the required destructive sam-pling of soil cores for N2 analysis, pulsing effects on N2
emission were not investigated (N2 analysis for the various
incubation conditions was carried out after the N2O, NO and
CO2incubation runs were completed). 4.6 Estimate of annual emission potentials
In order to estimate the potential annual soil–atmosphere ex-change of N2O, NO, N2and CO2from savanna soil, we used
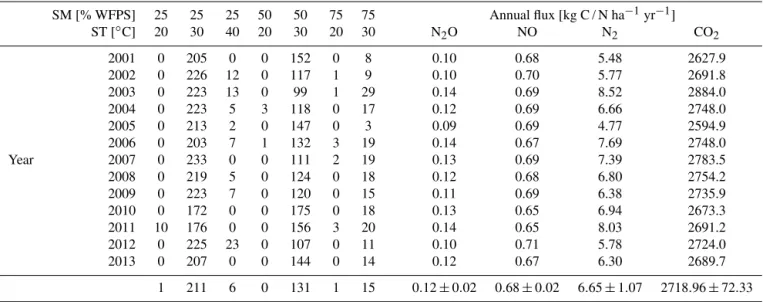
daily soil moisture and soil temperature records from a long-term eddy flux tower site (Howard Springs) located within 6 km from site T1 to extrapolate our results. The soil proper-ties of the flux tower site are comparable to site T1 and sen-sors were placed at 10 cm depth (data provided by L. Hutley for years 2001–2013).
The site data was discretized into classes of soil mois-ture (SM) and soil temperamois-ture (ST) to link with the incuba-tion setup classificaincuba-tion. Annual fluxes are the sum of daily emission for the existing SM/ST condition at this day. Fi-nally, the annual estimates were averaged to acknowledge the inter-annual variability of hygric conditions of this region. On average, 58 % of a year was assigned to class M25T30 (ST: 25◦C, SM: 37.5 % WFPS), followed by 36 % of class M50T30 (ST: 25–35◦C, SM: 37.5–62.5 % WFPS). For only
climate data for the 13 year period, the average of an-nual emissions (excluding pulse emissions) is estimated to amount to 0.12±0.02 kg N ha−1yr−1 (N2O), 0.68±
0.02 kg N ha−1yr−1 (NO), 6.65±1.07 kg N ha−1yr−1 (N2)
and 2718.96±72.33 kg C ha−1yr−1(CO2). Thus, N2
emis-sion dominates the total annual gaseous nitrogen loss (89 %), and N2O and NO only contribute 1.6 % and 9.3 %,
re-spectively. In addition to these base emission levels we can estimate additional losses per pulse emission event. Given our data, we estimate an additional release of 1.2 g N ha−1yr−1event−1 (N2O), 37.9 g N ha−1yr−1event−1
(NO) and 22.2 kg C ha−1yr−1event−1 (CO2). Since the
ac-tual number of pulse events is not known, we use a range of 1–5 three-day pulse events. This leads to the conclusion that pulse emission may only contribute 0.8–3.9 and 1.0–4.8 % to annual CO2and N2O emissions, respectively. The strong
pulse emissions observed for NO are reflected in the potential contribution to annual NO emissions. For 1–5 pulse emission events they could contribute between 5.3 and 21.8 % to the annual release of NO from soil. Due to experimental restric-tions we cannot report N2pulse emissions.
The numbers indicate that on average savanna soils release approximately 7.5 kg N ha−1yr−1to the atmosphere. In
con-trast, it is estimated that approximately 2 kg N ha−1yr−1are
deposited in remote rural areas of Australia (Meyer et al., 2001), but biological nitrogen fixation rates and nitrogen leaching are currently unknown and thus a qualified state-ment can not be made if the nitrogen cycle at this site is in equilibrium.
5 Conclusion
We reported the N2O, NO, N2 and CO2 emission response
of intact soil cores from tropical savanna and pasture to a range of climatic conditions. The laboratory analysis of in-tact soil cores allows for an analysis under controlled soil moisture and temperature conditions while largely preserv-ing the structural components of the soil column, although influence of flora and macro-fauna is lost compared to in situ measurements.
Key findings of our analysis are
1. Soil–atmosphere exchange of NO and CO2under late
dry season conditions was very low and for N2O often
Table 4.Annual emission of N2O, NO, N2and CO2from savanna soil (excluding contribution from pulse emission events). The number of days per year with a given soil temperature (ST) and soil moisture (SM) are presented in addition to the resulting annual emission.
SM [% WFPS] 25 25 25 50 50 75 75 Annual flux [kg C / N ha−1yr−1] ST [◦C] 20 30 40 20 30 20 30 N2O NO N2 CO2
2001 0 205 0 0 152 0 8 0.10 0.68 5.48 2627.9 2002 0 226 12 0 117 1 9 0.10 0.70 5.77 2691.8 2003 0 223 13 0 99 1 29 0.14 0.69 8.52 2884.0 2004 0 223 5 3 118 0 17 0.12 0.69 6.66 2748.0 2005 0 213 2 0 147 0 3 0.09 0.69 4.77 2594.9 2006 0 203 7 1 132 3 19 0.14 0.67 7.69 2748.0 Year 2007 0 233 0 0 111 2 19 0.13 0.69 7.39 2783.5 2008 0 219 5 0 124 0 18 0.12 0.68 6.80 2754.2 2009 0 223 7 0 120 0 15 0.11 0.69 6.38 2735.9 2010 0 172 0 0 175 0 18 0.13 0.65 6.94 2673.3 2011 10 176 0 0 156 3 20 0.14 0.65 8.03 2691.2 2012 0 225 23 0 107 0 11 0.10 0.71 5.78 2724.0 2013 0 207 0 0 144 0 14 0.12 0.67 6.30 2689.7
1 211 6 0 131 1 15 0.12±0.02 0.68±0.02 6.65±1.07 2718.96±72.33
2. Total atmospheric loss of nitrogen was dominated by N2emissions under all but one tested soil climatic
con-dition (82.4–99.3 % of total gaseous N loss), but NO emissions contributed almost 43.2 % to the total gaseous loss at 50 % WFPS and 30◦C soil temperature.
3. N2O emissions were substantially higher for 3 out of
12 soil cores investigated and indicate substantial spa-tial variability at site level (maximum N2O emission
rate: 180 µg N m−2h−1). This has implications for site-scale estimates and extrapolation of soil–atmosphere exchange rates.
4. Pulse emissions were observed for N2O, NO and CO2
immediately after water addition, but they were only short lived (24–72 h). The magnitude of pulse emissions was positively correlated with soil moisture addition for CO2and N2O, but negatively correlated for NO. Three
of the cores displayed a different N2O emission pattern
with no initial pulse response, but prolonged elevated N2O after the first days. However, pulse emissions may
only contribute significant amounts to the annual emis-sion budget of NO (5.3–21.8 %).
5. Upscaling to annual total suggests that savanna soil from this ecosystem only emits 0.12 kg N2O−
N ha−1yr−1. The estimated total annual emission of NO and N2 was 0.68 kg N ha−1yr−1 and 6.65
kg N ha−1yr−1, respectively (data excluded contribution
from pulse emissions).
6. We did not detect significant differences in emission magnitudes and patterns for our soil samples derived from savanna and pasture despite differing textural com-position, higher carbon content in microbial biomass,
higher NH+4 concentrations and the on-going fertiliza-tion of the pasture (note that only one pasture site was investigated versus three savanna sites).
7. Major controls on emission levels were soil moisture and temperature for N2O and CO2emissions, soil
tem-perature and pH for NO (soil moisture effect was not detected due to nonlinear response in the analysis) and soil moisture and pH for N2.
The results indicate that the gaseous loss of nitrogen in sa-vannas from northern Australia is largely controlled by NO emissions at high soil temperatures and low moisture condi-tions and N2 losses, whereas the soil–atmosphere exchange
of N2O is generally low or even negative after pronounced
dry periods. We did encounter strong N2O emissions for
a few individual cores, but no explanation for this emis-sion pattern could be detected from the soil physicochemical properties of these cores. This indicates that a higher replica-tion or larger sample areas are required to determine the N2O
exchange of these systems more reliably.
Acknowledgements. The authors are grateful for the generous
support of the staff of Charles Darwin University, Darwin, Australia during the field campaign. This research was funded as part of project WE 4519/1-1 “N trace gas emissions from tropical ecosys-tems and responses to global changes” by the German Science Foundation (DFG) with additional support from a FSY 2009 grant of Karlsruhe Institute of Technology (KIT). We acknowledge support by Deutsche Forschungsgemeinschaft and Open Access Publishing Fund of Karlsruhe Institute of Technology.
2004.
Arias-Navarro, C., Díaz-Pinés, E., Kiese, R., Rosenstock, T. S., Rufino, M. C., Stern, D., Neufeldt, H., Verchot, L. V., and Butterbach-Bahl, K.: Gas pooling: a sampling technique to over-come spatial heterogeneity of soil carbon dioxide and nitrous ox-ide fluxes, Soil Biol. Biochem., 67, 20–23, 2013.
Baggs, E. M.:A review of stable isotope techniques for N2O source partitioning in soils: recent progress, remaining chal-lenges and future considerations, Rapid Commun. Mass. Sp., 22, 1664–1672, 2008.
Bond, W. J. and Keeley, J. E.: Fire as a global “herbivore”: the ecol-ogy and evolution of flammable ecosystems, Trends Ecol. Evol., 20, 387–394, 2005.
Breuer, L., Papen, H., and Butterbach-Bahl, K.: N2O emission from tropical forest soils of Australia, J. Geophys. Res.-Atmos., 105, 26353–26367, 2000.
Brookes, P. C., Landman, A., Pruden, G., and Jenkinson, D. S.: Chloroform fumigation and the release of soil nitrogen: a rapid direct extraction method to measure microbial biomass nitrogen in soil, Soil Biol. Biochem., 17, 837–842, 1985.
Brümmer, C., Brüggemann, N., Butterbach-Bahl, K., Falk, U., Szarzynski, J., Vielhauer, K., Wassmann, R., and Papen, H.: Soil–atmosphere exchange of N2O and NO in near-natural sa-vanna and agricultural land in Burkina Faso (W. Africa), Ecosys-tems, 11, 582–600, 2008.
Brümmer, C., Papen, H., Wassmann, R., and Brueggemann, N.: Fluxes of CH4and CO2from soil and termite mounds in south Sudanian savanna of Burkina Faso (West Africa), Global Bio-geochem. Cy., 23, GB1001, doi:10.1029/2008GB003237, 2009a. Brümmer, C., Papen, H., Wassmann, R., and Brüggemann, N.: Ter-mite mounds as hot spots of nitrous oxide emissions in South-Sudanian savanna of Burkina Faso (West Africa), Geophys. Res. Lett., 36, L09814, doi:10.1029/2009GL037351, 2009b. Butterbach-Bahl, K., Gasche, R., Breuer, L., and Papen, H.: Fluxes
of NO and N2O from temperate forest soils: impact of forest type, N deposition and of liming on the NO and N2O emissions, Nutr. Cycl. Agroecosys., 48, 79–90, 1997.
Butterbach-Bahl, K., Willibald, G., and Papen, H.: Soil core method for direct simultaneous determination of N2and N2O emissions from forest soils, Plant Soil, 240, 105–116, 2002.
Butterbach-Bahl, K., Kesik, M., Miehle, P., Papen, H., and Li, C.: Quantifying the regional source strength of N-trace gases across agricultural and forest ecosystems with process based models, Plant Soil, 260, 311–329, 2004a.
Butterbach-Bahl, K., Kock, M., Willibald, G., Hewett, B., Buha-giar, S., Papen, H., and Kiese, R.: Temporal variations of fluxes of NO, NO2, N2O, CO2, and CH4 in a tropical rain forest ecosystem, Global Biogeochem. Cy., 18, GB3012, doi:10.1029/2004GB002243, 2004b.
Butterbach-Bahl, K., Baggs, E. M., Dannenmann, M., Kiese, R., and Zechmeister-Boltenstern, S.: Nitrous oxide emissions
geogr., 33, 401–415, 2006.
Castaldi, S., de Grandcourt, A., Rasile, A., Skiba, U., and Valen-tini, R.: CO2, CH4 and N2O fluxes from soil of a burned grassland in Central Africa, Biogeosciences, 7, 3459–3471, doi:10.5194/bg-7-3459-2010, 2010.
Cárdenas, L., Rondón, A., Johansson, C., and Sanhueza, E.: Effects of soil moisture, temperature, and inorganic nitrogen on nitric oxide emissions from acidic tropical savanna soils, J. Geophys. Res., 98, 14783–14790, 1993.
Chapuis-Lardy, L., Wrage, N., Metay, A., Chotte, J.-L., and Bernoux, M.: Soils, a sink for N2O? A review, Glob. Change Biol., 13, 1–17, 2007.
Conrad, R.: Soil microorganisms as controllers of atmospheric trace Gases (H2, CO, CH4, OCS, N2O, and NO), Microbiol. Rev., 60, 609–640, 1996.
Cook, G. D. and Heerdegen, R. G.: Spatial variation in the duration of the rainy season in monsoonal Australia, Int. J. Climatol., 21, 1723–1732, 2001.
Dalal, R. C. and Allen, D. E.: Turner review no. 18, greenhouse gas fluxes from natural ecosystems, Aust. J. Bot., 56, 369–407, 2008. Dannenmann, M., Gasche, R., Ledebuhr, A., and Papen, H.: Effects of forest management on soil N cycling in beech forests stocking on calcareous soils, Plant Soil, 287, 279–300, 2006.
Dannenmann, M., Butterbach-Bahl, K., Gasche, R., Willibald, G., and Papen, H.: Dinitrogen emissions and the N2: N2O emission ratio of a Rendzic Leptosol as influenced by pH and forest thin-ning, Soil Biol. Biochem., 40, 2317–2323, 2008.
Dannenmann, M., Willibald, G., Sippel, S., and Butterbach-Bahl, K.: Nitrogen dynamics at undisturbed and burned Mediter-ranean shrublands of Salento Peninsula, Southern Italy, Plant Soil, 343, 5–15, 2011.
Davidson, E. A.: Fluxes of nitrous oxide and nitric oxide from terrestrial ecosystems, in: Microbial Production and Consump-tion of Greenhouse Gases: Methane, Nitrogen Oxides and Halomethanes, American Society for Microbiology, Washington, 219–235, 1991.
Davidson, E. A. and Kingerlee, W.: A global inventory of nitric ox-ide emissions from soils, Nutr. Cycl. Agroecosys., 48, 37–50, 1997.
Davidson, E. A., Vitousek, P. M., Matson, P. A., Riley, R. H., García-Méndez, G., and Maass, J. M.: Soil emissions of nitric oxide in a seasonally dry tropical forest of México, J. Geophys. Res., 96, 15439–15445, 1991.
Davidson, E. A., Matson, P. A., Vitousek, P. M., Riley, R. H., Dunkin, K., García-Méndez, G., and Maass, J. M.: Processes reg-ulating soil emissions of NO and N2O in a seasonally dry tropical forest, Ecology, 74, 130–139, 1993.
of native and exotic ecosystems of the Amazon and cerrado re-gions of Brazil, The Scientific World, 1, 312–319, 2001. Davidson, E. A., Verchot, L. V., Cattânio, J. H., Ackerman, I. L.,
and Carvalho, J. E. M.: Effects of soil water content on soil res-piration in forests and cattle pastures of eastern Amazonia, Bio-geochemistry, 48, 53–69, 2000.
Dawes-Gromadzki, T. Z.: Abundance and diversity of termites in a savanna woodland reserve in tropical Australia, Aust. J. Ento-mol., 47, 307–314, 2008.
Donoso, L., Santana, R., and Sanhueza, E.: Seasonal-variation of N2O fluxes at a tropical savanna site – soil consumption of N2O during the dry season, Geophys. Res. Lett., 20, 1379–1382, 1993. Dwyer, E., Pinnock, S., Gregoire, J., and Pereira, J. M. C.: Global spatial and temporal distribution of vegetation fire as determined from satellite observations, Int. J. Remote Sens., 21, 1289–1302, 2000.
Eamus, D. and Prior, L. D.: Ecophysiology of trees of seasonally dry tropics: comparisons among phenologies, Adv. Ecol. Res., 32, 113–197, 2001.
Elliott, L. P., Franklin, D. C., and Bowman, D. M. J. S.: Frequency and season of fires varies with distance from settlement and grass composition inEucalyptus miniatasavannas of the Darwin re-gion of northern Australia, Int. J. Wildland Fire, 18, 61–70, 2009. Feig, G. T., Mamtimin, B., and Meixner, F. X.: Soil biogenic emissions of nitric oxide from a semi-arid savanna in South Africa, Biogeosciences, 5, 1723–1738, doi:10.5194/bg-5-1723-2008, 2008.
Felber, R., Conen, F., Flechard, C. R., and Neftel, A.: Theoret-ical and practTheoret-ical limitations of the acetylene inhibition tech-nique to determine total denitrification losses, Biogeosciences, 9, 4125–4138, doi:10.5194/bg-9-4125-2012, 2012.
Frost, P., Medina, E., Menaut, J.-C., Solbrig, O. T., Swift, M., and Walker, B.: Responses of savannas to stress and disturbance: a proposal for a collaborative programme of research, IUBS, Paris, 1986.
Gharahi Ghehi, N., Werner, C., Cizungu Ntaboba, L., Mboni-gaba Muhinda, J. J., Van Ranst, E., Butterbach-Bahl, K., Kiese, R., and Boeckx, P.: Spatial variations of nitrogen trace gas emissions from tropical mountain forests in Nyungwe, Rwanda, Biogeosciences, 9, 1451–1463, doi:10.5194/bg-9-1451-2012, 2012.
Groffman, P. M., Altabet, M. A., Böhlke, J. K., Butterbach-Bahl, K., David, M. B., Firestone, M. K., Giblin, A. E., Kana, T. M., Nielsen, L. P., and Voytek, M. A.: Methods for measuring deni-trification: diverse approaches to a difficult problem, Ecol. Appl., 16, 2091–2122, 2006.
Grover, S. P. P., Livesley, S. J., Hutley, L. B., Jamali, H., Fest, B., Beringer, J., Butterbach-Bahl, K., and Arndt, S. K.: Land use change and the impact on greenhouse gas exchange in north Australian savanna soils, Biogeosciences, 9, 423–437, doi:10.5194/bg-9-423-2012, 2012.
Grömping, U.: Estimators of relative importance in linear regression based on variance decomposition, Am. Stat., 61, 139–147, 2007. Herberich, E., Sikorski, J., and Hothorn, T.: A robust pro-cedure for comparing multiple means under heteroscedas-ticity in unbalanced designs, PLOS ONE, 5, e9788, doi:10.1371/journal.pone.0009788, 2010.
Hutley, L. B. and Setterfield, S. A.: Savannas, in: Encyclopedia of Ecology, vol. 4, Elsevier, Oxford, 3143–3154, 2008.
Hutley, L. B., Beringer, J., Isaac, P. R., Hacker, J. M., and Cer-nusak, L. A.: A sub-continental scale living laboratory: spatial patterns of savanna vegetation over a rainfall gradient in north-ern Australia, Agr. Forest Meteorol., 151, 1417–1428, 2011. Jones, C. M., Graf, D. R., Bru, D., Philippot, L., and Hallin, S.:
The unaccounted yet abundant nitrous oxide-reducing microbial community: a potential nitrous oxide sink, ISME J., 7, 417–426, 2013.
Kiese, R., Hewett, B., Graham, A., and Butterbach-Bahl, K.: Sea-sonal variability of N2O emissions and CH4uptake by tropical rainforest soils of Queensland, Australia, Global Biogeochem. Cy., 17, 1043, doi:10.1029/2002GB002014, 2003.
Lehmann, C. E. R., Prior, L. D., and Bowman, D. M. J. S.: Decadal dynamics of tree cover in an Australian tropical savanna, Austral. Ecol., 34, 601–612, 2009.
Levine, J. S., Winstead, E. L., Parsons, D. A. B., Scholes, M. C., Scholes, R. J., Cofer III, W. R., Cahoon, D. R., and Sebacher, D.: Biogenic soil emissions of nitric oxide (NO) and nitrous oxide (N2O) from savannas in South Africa: the impact of wetting and burning, J. Geophys. Res.-Atmos., 101, 23689–23697, 1996. Linn, D. N. and Doran, J. W.: Effect of water-filled pore space on
carbon dioxide and nitrous oxide production in tilled and non-tilled soils, Soil Sci. Soc. Am. J., 48, 1267–1272, 1984. Livesley, S. J., Grover, S. P. P., Hutley, L. B., Jamali, H.,
Butterbach-Bahl, K., Fest, B., Beringer, J., and Arndt, S. K.: Seasonal vari-ation and fire effects on CH4, N2O and CO2 exchange in sa-vanna soils of northern Australia, Agr. Forest Meteorol., 151, 1440–1452, 2011.
Lonsdale, W. M.: Inviting trouble: introduced pasture species in northern Australia, Aust. J. Ecol., 19, 345–354, 1994.
Ludwig, J., Meixner, F. X., Vogel, B., and Forstner, J.: Soil–air ex-change of nitric oxide: an overview of processes, environmen-tal factors, and modeling studies, Biogeochemistry, 52, 225–257, 2001.
Meixner, F. X., Fickinger, T., Marufu, L., Serça, D., Nathaus, F. J., Makina, E., Mukurumbira, L., and Andreae, M. O.: Preliminary results on nitric oxide emission from a southern African savanna ecosystem, Nutr. Cycl. Agroecosys., 48, 123–138, 1997. Meyer, C. P., Gillet, R. W., and Galbally, I. E.: The atmospheric
nitrogen cycle over Australia, in: Nitrogen Workshop 2000 -Sources, transformations, effects and management of nitrogen in freshwater ecosystems, Land & Water Australia, Occasional pa-per 1000, Canberra, 65–73, 2001.
Morris, S. G., Kimber, S. W. L., Grace, P., and Van Zwieten, L.: Improving the statistical preparation for measuring soil N2O flux by closed chamber, Sci. Total Environ., 465, 166–172, 2013. Otter, L. B., Yang, W. X., Scholes, M. C., and Meixner, F. X.: Nitric
oxide emissions from a southern African savanna, J. Geophys. Res., 104, 18471–18485, 1999.
Papen, H. and Butterbach-Bahl, K.: A 3-year continuous record of nitrogen trace gas fluxes from untreated and limed soil of a N-saturated spruce and beech forest ecosystem in Germany – 1. N2O emissions, J. Geophys. Res.-Atmos., 104, 18487–18503, 1999.
![Table 1. Physicochemical properties of the sampled soil and mean microbial biomass (sampling depth 0–20 cm; ∗ µg C/N g [dry weight] soil −1 ; BD: bulk density).](https://thumb-eu.123doks.com/thumbv2/123dok_br/17224445.244131/8.918.102.815.152.280/table-physicochemical-properties-sampled-microbial-biomass-sampling-density.webp)