Associations with
Mycobacterium avium
Subspecies
Infection
Colleen A. Fisher1, Eric K. Bhattarai1, Jason B. Osterstock2, Scot E. Dowd3, Paul M. Seabury4, Meenu Vikram1, Robert H. Whitlock5, Ynte H. Schukken6, Robert D. Schnabel7, Jeremy F. Taylor7, James E. Womack1, Christopher M. Seabury1*
1Department of Veterinary Pathobiology, College of Veterinary Medicine, Texas A&M University, College Station, Texas, United States of America,2Pfizer Animal Genetics, Kalamazoo, Michigan, United States of America,3Research and Testing Laboratory, SpiroStat Technologies, Medical Biofilm Research Institute, Lubbock, Texas, United States of America,4ElanTech, Inc., Greenbelt, Maryland, United States of America,5Department of Clinical Studies, School of Veterinary Medicine, University of Pennsylvania, Kennett Square, Pennsylvania, United States of America,6Department of Population Medicine and Diagnostic Sciences, College of Veterinary Medicine, Cornell University, Ithaca, New York, United States of America,7Division of Animal Sciences, University of Missouri, Columbia, Missouri, United States of America
Abstract
Members of the Toll-like receptor (TLR) gene family occupy key roles in the mammalian innate immune system by functioning as sentries for the detection of invading pathogens, thereafter provoking host innate immune responses. We utilized a custom next-generation sequencing approach and allele-specific genotyping assays to detect and validate 280 biallelic variants across all 10 bovineTLRgenes, including 71 nonsynonymous single nucleotide polymorphisms (SNPs) and one putative nonsense SNP. Bayesian haplotype reconstructions and median joining networks revealed haplotype sharing betweenBos taurus taurus andBos taurus indicusbreeds at every locus, and specialized beef and dairy breeds could not be differentiated despite an average polymorphism density of 1 marker/158 bp. Collectively, 160 tagSNPs and two tag insertion-deletion mutations (indels) were sufficient to predict 100% of the variation at 280 variable sites for bothBossubspecies and their hybrids, whereas 118 tagSNPs and 1 tagIndel predictively captured 100% of the variation at 235 variable sites forB. t. taurus. Polyphen and SIFT analyses of amino acid (AA) replacements encoded by bovineTLRSNPs indicated that up to 32% of the AA substitutions were expected to impact protein function. Classical and newly developed tests of diversity provide strong support for balancing selection operating on TLR3and TLR8, and purifying selection acting on TLR10. An investigation of the persistence and continuity of linkage disequilibrium (r2$0.50) between adjacent variable sites also supported the presence of selection acting onTLR3andTLR8. A case-control study employing validated variants from bovineTLRgenes recognizing bacterial ligands revealed six SNPs potentially eliciting small effects on susceptibility toMycobacterium aviumsppparatuberculosisinfection in dairy cattle. The results of this study will broadly impact domestic cattle research by providing the necessary foundation to explore several avenues of bovine translational genomics, and the potential for marker-assisted vaccination.
Citation:Fisher CA, Bhattarai EK, Osterstock JB, Dowd SE, Seabury PM, et al. (2011) Evolution of the BovineTLRGene Family and Member Associations with
Mycobacterium aviumSubspecies aratuberculosisInfection. PLoS ONE 6(11): e27744. doi:10.1371/journal.pone.0027744 Editor:Dipshikha Chakravortty, Indian Institute of Science, India
ReceivedSeptember 14, 2011;AcceptedOctober 24, 2011;PublishedNovember 30, 2011
Copyright:ß2011 Fisher et al. This is an open-access article distributed under the terms of the Creative Commons Attribution License, which permits unrestricted use, distribution, and reproduction in any medium, provided the original author and source are credited.
Funding:This project was supported by National Research Initiative Competitive Grant no. 2009-35205-05058 from the United States Department of Agriculture National Institute of Food and Agriculture to CMS. Likewise, research activities described herein were also supported by a National Institute of Food and Agriculture Johne’s Disease Integrated Program Grant 3951-TAMU-USDA-8710 to JBO, CMS, and YHS, as well as a National Institute of Food and Agriculture Formula Animal Health Grant 2010-590119 to CMS and JBO. The authors also acknowledge support from Texas AgriLife Research and the College of Veterinary Medicine, Texas A&M University. The funders had no role in study design, data collection and analysis, decision to publish, or preparation of the manuscript.
Competing Interests:The authors have declared that no competing interests exist. JBO is an unpaid collaborator and former employee of Texas A&M University, with this study conceptualized, funded, and initiated prior to his departure. PMS is an unpaid collaborator. ElanTech Inc allows PMS to engage in unpaid external scientific collaborations. SED is the Director of Research and Testing Laboratory. SED is a collaborator who provided sequencing library quantitation and pyrosequencing services. This does not alter the authors’ adherence to all the PLoS ONE policies on sharing data and materials.
* E-mail: cseabury@cvm.tamu.edu
Introduction
The ultimate goal of bovine genomics is the identification of genetic variation that modulates corresponding variation in economically important production traits, differential susceptibility to disease, and favorable host response to vaccines, which is expected to enable the improvement of these phenotypes via informed genomic selection (for review see [1]). The bovine genome sequence and first-generation HapMap projects [2,3] have directly enabled genome-assisted selective breeding [1], nascent investigations of non-traditional traits such as
marker-assisted vaccination (as diagnostics for enhanced vaccine design or animal response), the development of a new class of anti-infectives known as innate immunologicals [4], and the elucidation of loci that have evolved under strong selection, thus providing important computational evidence for genomic regions which may underlie economically important traits.
Relevant to the suppression of infectious diseases, the mamma-lian innate immune system provides host defense against a variety of pathogens without requiring prior exposure [5,6]. Consequent-ly, genes that modulate innate immunity have often been considered as candidate loci for improving host resistance to
paratuberculosis
disease in agricultural species [7-10]. Among mammals, the Toll-like receptor genes (TLRs) facilitate host recognition of pathogen-associated molecular patterns (PAMPs), thereafter eliciting host innate immune responses [5,6] aimed at suppressing invading bacteria, viruses, protozoa, and fungi. Essential to their role in host
defense, the mammalian TLRs encode type I transmembrane
proteins of the Interleukin-1 receptor (IL-1R) family with N-terminal leucine-rich repeats (LRR) involved in ligand recognition, a transmembrane domain, and a C-terminal intracellular Toll/IL-1 receptor homologous (TIR/IL-Toll/IL-1R) domain for signal transduc-tion [5,6,11]. The mammalianTLRgenes are primarily expressed by antigen-presenting cells (i.e., macrophages or dendritic cells), and most of theTLRligand specificities have been experimentally elucidated, with six gene family members (TLR1, TLR2, TLR4,
TLR5, TLR6, TLR9) known to recognize microbial (bacteria, fungi, protozoa) and/or synthetic ligands, and five (TLR3,TLR4,
TLR7-TLR9) known to recognize viral components [11,12].
Presently, TLR10remains the only functional human TLRgene
family member for which natural and/or synthetic ligands have not been fully elucidated [13]. However, given evidence for functional mammalian TLR protein heterodimers (TLR10/ TLR1; TLR2/TLR10) [13], the host protein encoded by
TLR10may collaboratively enable recognition of a diverse array of microbial PAMPs, including those recognized by TLR2 [13-16].
Several studies have demonstrated that some naturally occur-ringTLRvariants enhance the risk of severe infections in humans, mice, and domestic cattle, including the potential for increased susceptibility to Johne’s disease, a debilitating and economically important disease of ruminants caused by infection with
Mycobacterium aviumspp paratuberculosis(MAP) (for review see [17-22]). Furthermore, several important bovine health-related QTL have also been localized to genomic regions either proximal to or directly overlapping one or moreTLRloci (for review see [8,23-27]). Therefore, we utilized massively parallel pyrosequencing of a pooled TLR amplicon library (TLRs 1-10) to comprehensively evaluate nucleotide variation and haplotype structure for 31 cattle breeds representing Bos taurus taurus, Bos taurus indicus,and their subspecific hybrids (composites). Overall, 276 single nucleotide polymorphisms (SNPs) and 4 insertion-deletion (indel) mutations
were detected and validated. Bovine TLR SNPs and indels
leveraged from the pyrosequencing study were used in a case-control analysis to identify risk factors underlying differential susceptibility to MAP in U.S. dairy cattle. In addition, we also comprehensively report on bovineTLRhaplotype structure, the extent of haplotype sharing among specialized breeds and subspecific lineages, and provide median joining networks as putative representations of bovineTLRhaplotype evolution [28]. Finally, we provide computational evidence for several bovine
TLR genes evolving under disparate modes of non-neutral
evolution, thereby underscoring their potential importance to bovine innate immunity and health-related traits. The results of this study will enable bovine translational genomics, QTL refinement, and ultimately, genome-assisted methods for animal selection to develop cattle populations with enhanced disease resistance and favorable vaccine response.
Results
BovineTLRpyrosequencing, SNP detection, variant validation, and haplotype inference
For 96 elite bovine sires representing 31 domestic cattle breeds (B. t. taurus;B. t. indicus; and composites), we generated and purified 81 amplicons targeting all 10 bovine TLRgenes (n = 7,776 total
amplicon targets; see methods). The majority of the amplicons were pooled (n = 6,816) to form a normalized fragment library (Table S1) which was subjected to a workflow involving Roche 454 Titanium pyrosequencing with downstream variant detection using the Neighborhood Quality Standard algorithm as recently described [29], and the remaining purified amplicons (n = 960) were analyzed by standard dye-terminator cycle sequencing (Sanger) with alignment-based variant detection [23-25]. Sanger sequencing was necessary for amplicons that were intolerant to the addition of 59oligonucleotide barcodes for PCR amplification. In total, 474 variable sites were predicted from intragenic analyses of all sequence data, which included 212 previously validated SNPs [30], 4 known insertion-deletion mutations (indels) [30], and 258 new putative SNPs. Evaluation of the genic distributions of all newly predicted TLR variable sites detected within the pyrose-quencing data revealed that$62% of the 258 new putative SNPs were located either within or immediately flanking homopolymer repeats. Nevertheless, to allow for inclusion of all possible SNPs in downstream analyses, we investigated all 474 variable sites via fluorescent allele-specific genotyping assays [30]. Collectively, we validated 280 biallelicTLRvariants (276 SNPs+4 indels; Table S2) using custom genotyping assays applied to the sequencing discovery panel (n = 96 elite sires; 31 breeds), a panel of Holstein dairy cattle (n = 405; 3 herds), and a panel of purebred Angus beef cattle from a single herd (n = 48).
Of the 276 validated SNPs, 71 were predicted to encode nonsynonymous substitutions (nsSNPs), and one was predicted to
encode a nonsense mutation in bovine TLR5 (AA substitution
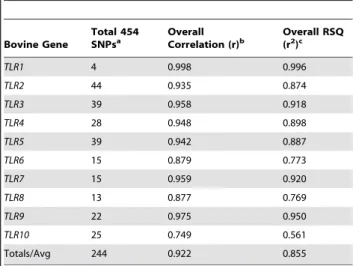
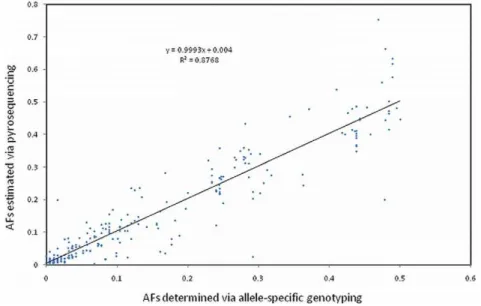
R125*; SNP C2332T). For the validated SNPs detected via pyrosequencing (n = 244), we investigated the relationship between minor allele frequencies (MAFs) estimated from the analysis of pyrosequencing data, as compared to corresponding allele frequencies derived from individual fluorescent allele-specific genotyping assays, and found significant correlations across all 10TLRgenes (discovery panel; Table 1). Moreover, an analysis performed across all genes (n = 244 SNPs) revealed that there was little or no bias in the estimates of allele frequencies produced via targeted pyrosequencing (P= 0.999846; Ho: slope = 1; Figure 1).
Table 1.Relationship between minor allele frequencies estimated from pyrosequencing and allele-specific genotyping of 96 individuals from 31 breeds.
Bovine Gene
Total 454 SNPsa
Overall Correlation (r)b
Overall RSQ (r2)c
TLR1 4 0.998 0.996
TLR2 44 0.935 0.874
TLR3 39 0.958 0.918
TLR4 28 0.948 0.898
TLR5 39 0.942 0.887
TLR6 15 0.879 0.773
TLR7 15 0.959 0.920
TLR8 13 0.877 0.769
TLR9 22 0.975 0.950
TLR10 25 0.749 0.561
Totals/Avg 244 0.922 0.855
aTotal SNPs detected via pyrosequencing. bP,0.05 for allTLRgenes.
Collectively, 266 SNPs and 4 indels were successfully incorpo-rated into 243 unique haplotypes via Bayesian reconstructions [30,31] (Table 2), which included one discrete haplotype carrying the putativeTLR5nonsense SNP. Ten SNPs (TLR2: 9431, 10047, 12121;TLR3: 3624, 3804, 5201, 6382;TLR4: 8166;TLR5: 1562, 1685; see Table S2) could not be incorporated into discrete haplotypes with best-pair phase probabilities$0.90. Summary data representing the total number of predicted haplotypes, number of cattle with phase probabilities$0.90, total number of variable sites with MAF#0.10, genic distributions of validated variable sites, size of the investigated regions, and average estimates of linkage disequilibrium (LD; r2) between adjacent variable sites are depicted in Table 2. Across all investigated loci (n = 549 cattle; 31 breeds), the MAF spectrum derived from allele-specific genotyping assays ranged from 0.001 to 0.498, with 64% of the validated SNPs possessing MAFs#0.10 (Table 2).
Characterization of LD architecture, recombination, and intragenic tagSNPs/Indels
Evaluation of the intragenic patterns of LD across all 31 breeds of cattle via 95% confidence intervals constructed for D’ [32,33], application of the four gamete rule [32], and estimates of recombination between adjacent variable sites [34,35] revealed one or more blocks of strong LD within each of the 10 bovineTLR
genes. Statistical evidence for historical recombination was detected within TLR2, TLR3, and TLR6, resulting in at least two detectable LD blocks within each gene. All other genes exhibited a single block of strong LD spanning either all, or the majority of all validated intragenic SNPs and indels, as supported by the majority rule of all three analyses [32-35]. A comparison of average intragenic r2values calculated between adjacent variable sites across all 10 genes revealed a dynamic range of LD (0.09-0.70; all cattle, 31 breeds; Table 2). Discrete regions of high and low LD, the latter due to historical recombination, were also detected using the general model for varying recombination rate [31,34,35]. Cumulatively, four adjacent SNP sites [TLR2 (1),
TLR3 (2), and TLR6 (1)] produced estimates of median
recombination rates that exceeded the background rate () [31,34,35] by a factor of at least 2.5. The highest median estimate
of recombination rate was observed in TLR3 (between SNP
positions rs42851925, rs55617222; rs55617241, rs55617451, Table S2), and exceeded the background rate by a factor of at least 5.2. Analyses to identify tagSNPs/Indels which predictively captured 100% of the variation at 280 validated variable sites within all 10 genes for all cattle yielded 160 tagSNPs and 2 tagIndels (Table S3). Similar analyses restricted to theB. t. taurus
breeds demonstrated that only 118 tagSNPs and 1 tagIndel were predicted to capture 100% of the variation at 235 variable sites (Table S3). Interestingly, the cumulative tagging efficiency (total tags predicted/total number of validated variable sites) was similar for both analyses (all cattle vsB. t. taurus), with this result largely due to the preponderance of taurine cattle in the total sample (94.4%), and the significant sharing of SNPs, indels, and haplotypes among the subspecific lineages.
High resolution bovineTLRhaplotype networks and breed distributions
Median joining haplotype networks (Figures 2,3,4, Figure S1; Table S4) constructed for all 10 genes revealed that: 1) The specializedB. t. taurusbeef and dairy breeds cannot be genetically discriminated despite an average polymorphism density (266 SNPs + 4 indels; see Table 2) of one variable marker per 158 bp; 2) Haplotype sharing occurs amongB. t. taurusandB. t. indicusbreeds at all 10 loci; 3) Shared haplotypes were often the highest frequency haplotype(s) within a network; 4) Despite haplotype sharing between the subspecific lineages, the 250 Kyr divergence [36] betweenB. t. taurusandB. t. indicuswas evident in most, but not all, haplotype networks (i.e.,TLR1-7, TLR10). With very few
exceptions (i.e., TLR3 Network 1, TLR4, TLR10), the high
frequency network nodes demonstrating subspecific haplotype sharing often included at least two indicine sires. Using summary data derived from the median joining networks (Table S4), we
Figure 1. For validated bovine TLR SNPs detected via pyrosequencing (n = 244), a regression analysis was performed for pyrosequencing allele frequency (AF) estimates corresponding to the true minor alleles.(,0.5), as defined by allele-specific genotyping assays, and minor AFs (MAFs) directly ascertained by genotyping (n = 96 elite sires; 31 breeds). The true minor alleles (,0.5) were correctly identified for 236/244 (97%) SNPs via pyrosequencing. This analysis provided strong statistical evidence (P= 0.999846; Ho: slope = 1) for little or no bias in the pyrosequencing-based estimates of allele frequency.
estimated the relationship between the total number of discrete
TLRhaplotypes predicted (TLR1-10) in seven major U.S. taurine beef breeds [37] (Angus, Charolais, Gelbvieh, Hereford, Limousin, Red Angus, Simmental), and four U.S. taurine dairy breeds (Braunvieh, Brown Swiss, Holstein, Shorthorn), and found a significant correlation (r = 0.71,P#0.0224). This correlation was driven by the large number of haplotypes predicted to be shared among the beef and dairy breeds. For the investigated beef breeds, we predicted 84 discrete haplotypes across all 10TLRloci, and at least 60 (71.4%) were predicted to be shared with the four dairy breeds. However, we also detected disparities between the numbers of haplotypes predicted for TLR4and TLR5, with the dairy breeds possessing 3.8X and 2.3X more discrete haplotypes for these loci, respectively, than did our beef cattle. Exclusion of these two outlying loci resulted in a nearly perfect correlation (r = 0.98,P,0.0001) between the numbers of discrete haplotypes predicted in beef and dairy breeds across the remainingTLRloci. Interestingly, the single haplotype possessing the TLR5 putative nonsense mutation was almost exclusively predicted in Holstein cattle (Figure S1,TLR5Node Q; n = 53 Holstein, n = 1 Braford).
Functional modeling of bovine amino acid (AA) substitutions and tests of selection
Using both PolyPhen [38] and SIFT [39] to evaluate the putative functional effects of AA substitutions encoded by TLR
SNPs, we determined that 54/72 (75%) of AA substitutions were predicted to be benign and tolerated, whereas 23/72 (32%) were predicted to impact protein function [40] by at least one of the analytical methods employed (Table 3). For those mutations predicted to impact protein function, 18/23 (78%) were detected at frequencies,0.05, and 5/23 (22%) located inTLR2(1),TLR3
(2),TLR5(1; putative nonsense SNP), andTLR8(1) were observed at frequencies$0.05, with moderate frequency substitutions
detected in TLR8 (0.562) and TLR3 (0.432; see Table 3). The
MAF for theTLR5putative nonsense SNP, as estimated from 405 Holsteins in three herds was 0.068 (Table 3). Across all polymorphisms involving AA substitutions, PolyPhen and SIFT produced analogous predictions for 61/72 (85%) observed replacements.
To collectively estimate the extent of functional and/or selective constraint(s) related to bovine TLR protein function, we used a goodness of fit test to examine disparities between the observed distributions of AA phenotypes (PolyPhen+SIFT results; benign/ tolerated vs damaging/affect). Assuming equal probabilities for the occurrence of both classes of AA phenotypes across all bovine TLRs, we found there to be significantly fewer substitutions predicted to impact protein function than those classified as benign or tolerated (P= 0.00022). This is consistent with some degree of functional and/or selective constraints that generally operate to maintain the functional products of most protein coding genes [40-42]. However, this result describes a general trend across the
bovine TLR gene family, and does not provide locus-specific
insights regarding the evolutionary origin and magnitude of these constraints.
To elucidate gene-specific departures from a strictly neutral model of molecular evolution, we used Tajima’s frequency distribution test (Dstatistic) [43], as applied to the discovery panel samples (all cattle from 31 breeds vsB. t. taurus), and evaluated the significance of the observed values (D) via coalescent simulation (Table 4). Departures from neutrality were detected for TLR3,
TLR8, andTLR10. However, the direction of the deviation was not uniform across all three loci (Table 4), suggesting that Table 2.Summary data for validated polymorphisms detected in the bovineTLRgene family.
Bovine Gene
BTA Assigna
Total Hapsb
Sires Phasedc
MAF #0.10d
Avg r2
alle
Avg r2
B.t.t.e Valid.
SNPsf Hap SNPsg
Valid. Indelsh
Valid. nsSNPsi
Region Sizej(Kb)
QTL or Assoc.k
TLR1 BTA6 8 547 3 0.24 0.49 5 5 0 2 2.184 Q
TLR2 BTA17 38 532 38 0.19 0.24 44 41 1 20 3.224 Q, Al
TLR3 BTA27 40 78 20 0.29 0.57 56 52 0 3 9.469 A
TLR4 BTA8 29 532 23 0.10 0.08 28 27 0 7 3.470 Q, A
TLR5 BTA16 29 526 29 0.20 0.31 43 41 3 9 5.334 No
TLR6 BTA6 20 526 13 0.09 0.12 15 15 0 6 2.327 Q, Al
TLR7 BTAX 9 96 7 0.28 0.28 15 15 0 1 4.285 Q
TLR8 BTAX 6 96 1 0.70 0.69 13 13 0 8 3.702 Q
TLR9 BTA22 20 545 9 0.27 0.29 22 22 0 3 5.033 Q
TLR10 BTA6 43 524 34 0.27 0.15 35 35 0 13 3.859 Ql
Total/Avg 243 96% 177 0.26 0.32 276 266 4 72 42.887
aBTA assignments based on NCBI Refseq (Btau5.2).
bTotal number of haplotypes predicted from all validated markers and best pair reconstructions [31] with probabilities $0.90.
cNumber of cattle exhibiting best pair phase probabilities$0.90. BTAX haplotypes were directly ascertained. 96 animals were genotyped forTLR3,TLR7, andTLR8. For all other loci, 549 animals were genotyped.
dNumber of polymorphisms with minor allele frequencies #0.10.
eAverage intragenic linkage disequilibrium (r2) values estimated for adjacent SNP and indel sites for all cattle or for
B. t. taurus(B.t.t.). fNumber of putative SNPs validated as polymorphic.
gNumber of validated SNPs incorporated into discrete haplotypes. hNumber of putative indels validated as polymorphic.
iNumber of nonsynonymous SNPs validated as polymorphic, including the putativeTLR5nonsense SNP. jSize of the genic region. Kb = Kilobase.
kBovine health-related QTL overlapping or proximal to investigated gene (Q), or intragenic variation associated (A) with disease susceptibility in case-control studies [19-27,46].
disparate modes of evolution (i.e., selection) may have influenced genetic diversity within these genes, and that there may be differences among cattle lineages (Table 4, TLR10). For both
TLR3and TLR8, a significantly positive Tajima’sDreflected an excess of moderate frequency alleles, whereas a large negative value forTLR10(B. t. taurus) reflected an overabundance of rare, low frequency variants consistent with purifying selection [30]. Therefore, it is important to note that although a significant nonrandom trend toward benign or tolerated AA substitutions was detected across all investigated loci, the underlying reason for this functional and/or selective constraint appears to be fundamentally different between some gene family members (i.e.,TLR3,TLR8vs
TLR10). Notably, we observed at least one moderate frequency AA substitution that was predicted to impact protein function in
both TLR3 and TLR8 (Table 3), whereas all AA substitutions
predicted to impact protein function inTLR10were detected at very low frequencies (Table 3). To further investigate the overall
magnitude and origin(s) of the most significant deviations from a strictly neutral model (Tajima’s D; pyrosequencing discovery panel; Table 4), we used Fu’s FS statistic [44] to estimate the
probability of observing a number of haplotypes less than or equal to that predicted in our samples forTLR3(B. t. taurus);TLR3-1(B. t. taurus), and TLR8 (all cattle; B. t. taurus). For TLR3, we recognized that the inability to phase all individuals in the pyrosequencing discovery panel could lead to the absence of some low frequency alleles, thus potentially driving both Tajima’sDand Fu’sFStoward larger positive values. Consequently, we calculated
Fu’sFSand Tajima’sDforTLR3(B. t. taurus) andTLR3-1 (B. t.
taurus) using the following approach: 1) Both test statistics were first calculated only for sires that could be phased with best-pairs probabilities$0.90, as depicted in Table 4; and 2) If a significant result was achieved in this analysis, we then added the taurine haplotypes with phase probabilities,0.90 into our analyses (D;FS)
by choosing the best haplotype pairs reconstructed for each sire. For Fu’s FS, only TLR8 displayed unequivocal evidence for a
departure from neutrality (All cattleFS= 10.2712, P,0.01;B. t.
taurus FS= 10.296, P,0.01), with levels of significance that
withstood conservative correction for multiple testing (correc-tion =a/n locus-specific tests, 0.05/2 = Minimal P#0.025). For Tajima’sD, inclusion of the best TLR3 haplotype pairs for sires with phase probabilities,0.90 resulted in very similar test statistics (TLR3 B. t. taurus D= 3.6034, P,0.001; TLR3-1 B. t. taurus D= 3.4895, P,0.002; Table 4), with levels of significance that
endured correction for multiple testing (0.05/8 = Minimal
P#0.00625).
A regression-based approach considering all validated variable sites and the effective number of SNPs at each site [30] also demonstrated thatTLR3andTLR8possess significantly more gene diversity than do the eight otherTLRloci (P#0.05; Figure 5) in taurine and all cattle combined. In contrast, both regression analyses (all cattle; B. t. taurus only) indicated that TLR10 and
TLR2possess significantly less gene diversity than other members of the bovineTLRgene family (Figure 5). With the exception of
Figure 2. Median joining (MJ) haplotype networks for bovine
TLR3using haplotypes predicted for all cattle (n = 96 AI sires, 31 breeds).Because MJ networks require the absence of recombination [66], each network represents intragenic regions of elevated LD. Haplotypes predicted forB. t. taurus,B. t. indicusand hybrids (termed ‘‘composites’’) are color coded. Numbers indicate SNP positions in numerical order (see Table S2 for SNP information). Node sizes are proportional to haplotype frequency, and all branch lengths are drawn to scale. Alphabetized letters at nodes represent the breed distribution of each haplotype (Table S4). Median vectors are indicated as ‘‘mv’’. doi:10.1371/journal.pone.0027744.g002
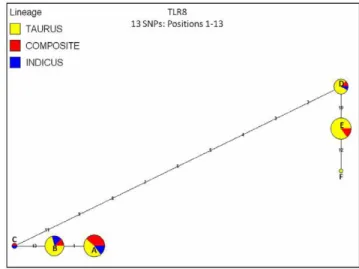
Figure 3. Median joining (MJ) haplotype network for bovine
TLR8using haplotypes directly ascertained for all cattle (n = 96 AI sires, 31 breeds).Haplotypes observed forB. t. taurus,B. t. indicus and hybrids (termed ‘‘composites’’) are color coded. Numbers indicate SNP positions in numerical order (see Table S2 for SNP information). Node sizes are proportional to haplotype frequency, and all branch lengths are drawn to scale. Alphabetized letters at nodes represent the breed distribution of each haplotype (Table S4).
TLR2, these results are precisely congruent with the results of Tajima’s test (D; Table 4).
Single Marker and Haplotype Association Tests with MAP Infection
Unphased diploid genotypes for a subset of the validated SNPs and indels (n = 35; nonsynonymous, putative nonsense, 5’ upstream regions, and introns) within bovine TLR genes either known or postulated to primarily recognize bacterial ligands (TLR1, TLR2, TLR4, TLR5, TLR6, TLR9, TLR10) were tested for associations with bacterial culture status for MAP (fecal and/or tissue) in three Holstein dairy herds (n = 68 cases, 270 controls). All
nonsynonymous TLR SNPs previously associated with MAP
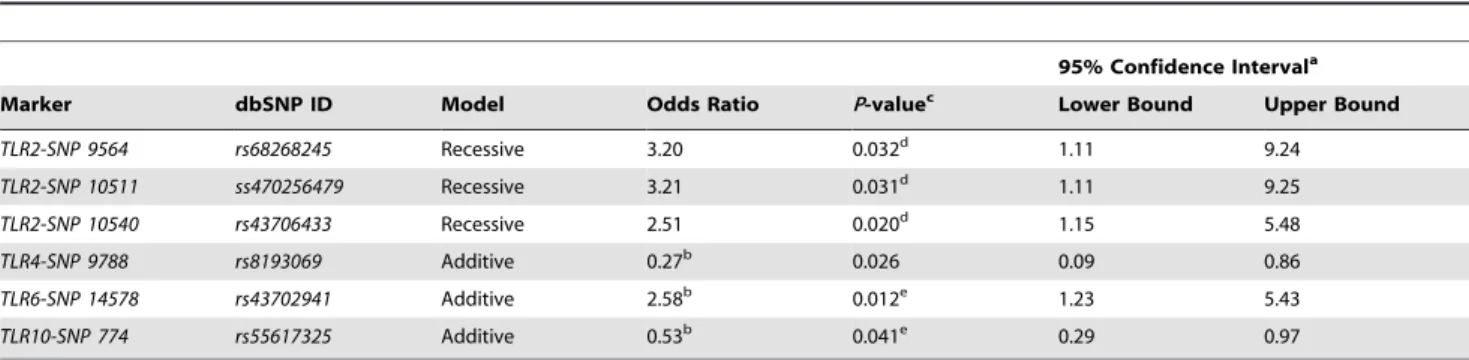
infection [19] (TLR1, TLR2, TLR4) were monomorphic in our samples (n = 549; 31 breeds). Conditional logistic regression models were constructed for each of 35 variable sites meeting our selection criteria (see methods) to estimate the relative odds of MAP infection given the defined diagnostic criteria adjusted for the effects of herd and age. Collectively, six SNPs produced suggestive associations, as evidenced by uncorrected P-values (Table 5). Interestingly, three SNPs in TLR2 and one in TLR6
were associated with increased odds of MAP infection in animals with 1 or more copies of the minor allele (Table 5). Two SNP loci, 1 inTLR4and 1 inTLR10, were associated with decreased odds of infection given increasing copies of the minor allele (Table 5). Following locus-specific correction of theP-values using the FDR method (http://sdmproject.com/utilities/? show=FDR) [45], two SNPs (TLR6-rs43702941; TLR10-rs55617325) remained signifi-cant (P#0.05), and three SNPs (TLR2-rs68268245, ss470256479, rs43706433) displayedP-values (P#0.053) that were suggestive of a potential recessive genetic association with MAP infection (Table 5). Two of these SNPs (TLR2-ss470256479, rs43706433)
were recently hypothesized to occur on a haplotype associated with an increased risk for Johne’s disease [46]. Consequently, we used PHASE 2.1 [31] to test the hypothesis that haplotype frequencies for bacterial-sensing TLRs differ between cases and controls. However, none of the investigated loci possessed significantly different haplotype distributions between cases and controls (P.0.05; 1,000 permutations).
Discussion
Our methodological workflows resulted in the robust identifi-cation of SNPs with precise estimates of MAF for the bovineTLR
genes (see methods), as evidenced by the regression of MAFs derived from the analysis of pyrosequencing data and allele-specific genotyping assays (Figure 1). For these genes, our genotyping assays provide a 70 fold increase in marker density relative to the Illumina BovineSNP50 assay, which queries four SNPs either within (TLR6,TLR10) or proximal to (TLR7,TLR8) the targeted loci, and a greater than 3 fold increase in marker density relative to the new Illumina BovineHD assay (777K), which possesses an average marker interval density of approxi-mately 1 SNP/3.5 kb. Notably, the new BovineHD assay includes 84 SNPs that are either within or proximal to (#2 Kb) the 10TLR
genes (i.e.TLR1[3]; TLR2[6];TLR3[8]TLR4[6];TLR5[22];
TLR6[23];TLR7[3];TLR8[4];TLR9[5];TLR10[4]), including one SNP implicated by our case-control study (TLR2-rs43706433; Table 5). Validated polymorphisms, reconstructed haplotypes, and the tagSNPs/Indels identified in this study will directly facilitate the fine mapping of bovine health-related QTL [23-27], while also enabling further evaluation of SNPs tentatively associated with differential susceptibility to Johne’s disease (MAP infection) [19-22,46] (Table 5). While large numbers of tightly clustered SNPs are sometimes difficult to genotype, we endeavored to validate all
Figure 4. Median joining (MJ) haplotype network for bovineTLR10using haplotypes predicted for all cattle (n = 96 AI sires, 31 breeds; 48 Purebred Angus; 405 Holstein cattle).Haplotypes predicted forB. t. taurus,B. t. indicusand hybrids (termed ‘‘composites’’) are color coded. Numbers indicate SNP positions in numerical order (see Table S2 for SNP information). Node sizes are proportional to haplotype frequency, and all branch lengths are drawn to scale. Alphabetized letters at nodes represent the breed distribution of each haplotype (Table S4). Notably, given the complexity of the network, only nodes representing$10 cattle are labeled (A-F), which collectively represents.93% of the cattle meeting the phase requirements (n = 524 cattle with best-pair probabilities$0.90). Median vectors are indicated as ‘‘mv’’.
detected variants by redesigning primers and manipulating PCR conditions for problematic markers. Accordingly, we successfully validated several SNPs for which assays had previously failed [30], and we also validated the majority of the newly identified putative SNPs (pyrosequencing data) that were not associated with homopolymer repeats. Furthermore, some regions ofTLR1posed the greatest technical challenge due to sequence similarity with
TLR6. For this reason, at least some DNA sequencing from
medium-range PCR products designed to specifically amplify each locus is needed to exhaustively ascertain all possible variants spanning theTLR1-TLR6gene cluster.
Across all adjacent variable sites within the bovineTLRgene family, we observed higher levels of LD (r2) inB. t. tauruscattle (0.32) than in the combined sample (0.26) ofBos t. taurus, Bos t. indicus, and composite breeds (Table 2). This is generally consistent with previous studies of bovine subspecific divergence, haplotype structure, and LD across short to moderate physical distances [3,47], including our previous study on bovine TLR
haplotype structure [30]. However, in this study intragenic estimates of r2increased for several loci upon pooling (all cattle),
including TLR4, TLR8, and TLR10, which was not predicted
given previously reported trends in LD [3,30,47]. We previously found that r2values were enhanced after pooling only forTLR7
and TLR8 [30]. This result indicates that phase-relationships have been preserved across bovine subspecies and specialized breeds for these loci, perhaps due to selection (Table 4), and is only apparent at high genotyping densities. Moreover, this observation may represent a signature of selection on some individual variable sites, with detectable levels of intragenic selection only becoming apparent (Table 4) with increasing numbers of variable sites subject to selection, and/or uniformly higher selection coefficients. For all genes exceptTLR2(Network 1 only),TLR3(Network 1 only),TLR5,TLR8, andTLR9, one or two predominant haplotypes were predicted for the majority of the cattle investigated (Figures 2,3,4, Figure S1; Table S4).
Moreover, significantly positive values for Tajima’s D were
detected for genomic regions encodingTLR3andTLR8(Table 4) despite correction for multiple testing, and forTLR3, the addition of best haplotype pairs for sires with phase probabilities,0.90 produced very similar test statistics (D) for B. t. taurus cattle, indicating that D is not falsely inflated by the absence of rare alleles within the sires that could not be stringently phased. Additionally, a regression based test also demonstrated thatTLR3
andTLR8 possess significantly more diversity than do all other
TLR loci (P#0.05; Figure 5). Significantly positive values for
Tajima’s D are often interpreted as evidence for a recent
Table 3.Summary data for 22 nonsynonymous SNPs and one putative nonsense SNP predicted to impact protein function.
Bovine Gene SNPa dbSNP ID GenBank Protein ID AA Subst.b Protein Domainc PolyPhen Resultd SIFT Resultd SNP Freqe
TLR2 G.T ss470256478 NP_776622.1 W119L LRR_TYP1 PrD AF 0.008
T.A rs68268251 NP_776622.1 F227L NCP PsD T 0.015
C.T ss470256481 NP_776622.1 T311M NCP PrD AF 0.006
C.T ss470256483 NP_776622.1 S485F LRR_TYP2 PrD AF 0.015
G.A rs68268260 NP_776622.1 R563H LRRCT B AF 0.066
G.C ss470256484 NP_776622.1 E738Q TIR PsD AF 0.001
TLR3 G.A rs55617272 NP_001008664.1 G426S LRR8 PsD AF 0.058 G.T rs42852439 NP_001008664.1 S664I LRRCT PsD T 0.432
TLR4 A.C rs8193049 NP_776623.5 N151T LRR3 PsD T 0.009
A.G rs8193055 NP_776623.5 K381R LRR6 B AF 0.005
A.G ss469376075 NP_776623.5 H587R LRRCT PrD AF 0.003
TLR5 C.T ss469376099 NP_001035591.1 R125* NCP PsD ND 0.053f G.A ss469376101 NP_001035591.1 R262H NCP PrD T 0.004 C.G ss469376107 NP_001035591.1 F643L NCP B AF 0.003
TLR6 T.G rs68268270 NP_001001159.1 L43R NCP PrD AF 0.003
A.G rs68268272 NP_001001159.1 R87G LRR1 B AF 0.017
T.A ss469376113 NP_001001159.1 F494I LRR5 PrD AF 0.024
TLR7 A.G ss469376123 NP_001028933.1 N439S NCP PrD AF 0.021
TLR8 G.A rs55617351 ABQ52584.1 S477N NCP B AF 0.562
A.C ss469376137 ABQ52584.1 K903T TIR PsD AF 0.010
TLR10 G.A rs55617437 NP_001070386.1 R18H SigPep PsD T 0.018 C.G rs55617286 NP_001070386.1 I134M LRR3 B AF 0.013 A.C rs55617297 NP_001070386.1 K753T TIR PsD AF 0.010
aSNPs with ‘‘rs’’ numbers were previously described [23-25,30,59] and validated in this study.
bAmino acid (AA) substitutions predicted from corresponding SNPs, GenBank Proteins, and previous studies [23-25,30,60]. c
Protein domain locations predicted by SMART (http://smart.embl-heidelberg.de/). Only confidently predicted domains are depicted (NCP = no confident prediction; LRRs are named in order of prediction).
dResults from PolyPhen and SIFT [38-39]. Results other than ‘‘Benign (B)’’ or ‘‘Tolerated (T)’’ are predicted to be Possibly Damaging (PsD), Probably Damaging (PrD), or Affect Protein Function (AF). SIFT could not be used (ND) to model theTLR5putative nonsense SNP.
population bottleneck, or for some form of balancing selection [48-50], withDbeing the most powerful test in its class [51], but may also indicate violations of the mutation-drift equilibrium assumption or random sample requirement. Worthy of discussion
is the fact that variation within TLR3 displayed the second
highest average r2values between adjacent variable sites (Table 2), which in conjunction with a large, significantly positiveDstatistic for taurine cattle (Table 4) suggests that this gene is under selection. However, unlikeTLR8, high r2($0.50 for 10/13 SNPs in TLR8) did not persist across the majority of all adjacent variable sites inTLR3, and therefore, it is relatively unsurprising that our analysis ofTLR3revealed no evidence for a deficiency of total discrete haplotypes in B. t. taurus cattle (i.e., FS was not
significant).
Surprisingly, the region of TLR3 demonstrating the strongest deviation from neutrality does not include the two nonsynonymous SNPs predicted to impact protein function (Table 3, Table 4), but includes a 59putative promoter region (PROSCAN 1.7: http:// www-bimas.cit.nih.gov/molbio/proscan/index.html) [23] harbor-ing several transcription factor bindharbor-ing sites (NF-kB, PEA1, AP-1, TFIID; Positions 2852041-2852291 of NW_001494406.2) as well as the first two exons and introns ofTLR3. No variation was detected within the predicted promoter itself. However, 40 validated SNPs were found to flank the putative promoter (see Table S2 for coordinates), with nearly half of this variation occurring immedi-ately upstream (n = 19 SNPs). Further evaluation of LD between adjacent variable sites for taurine cattle revealed two regions of
TLR3with persistent, unbroken r2.0.50 between all adjacent sites as follows: 1) Variable sites 1-5 upstream of the predicted promoter (Table S2); and 2) Variable sites 10-19, which span the predicted promoter. This unbroken pattern of persistent r2was also detected in our pooled analysis of all cattle, but did not extend across as many adjacent variable sites (Table S2, sites 13-17; region also spans the predicted promoter), and was only found in one upstream region. Therefore, it is possible that selection is primarily operating on noncoding variation within the genomic regions flanking the
predicted promoter. Future functional studies will be needed to determine whether the SNPs flanking the predictedTLR3promoter actually modulate differences in gene expression.
Notably, onlyTLR8displayed a significant, positive value for Fu’sFS, indicating a lower than expected number of haplotypes,
as would be predicted given a recent population bottleneck or strong balancing selection. However, the high r2 that persists across nearly all adjacent variable sites strongly implies selection (Table 2). While previous studies have suggested that population bottlenecks may have occurred at the time of domestication and breed formation for modern cattle [3,47], these are expected to drive frequency distribution tests (D, FS) toward more positive
values because of the loss of rare genetic variation at all loci. In particular, the effects of bottlenecks are expected to be uniform and potentially dramatic for proximal, evolutionarily related X-linked loci (TLR7, TLR8) performing similar functions (6, 11-12), especially given smaller effective population size
(chromo-somal) and female limited recombination. However, TLR7
possesses a fundamentally different frequency distribution trend (D= -0.19828 all cattle;D= -0.17037B. t. taurus) as compared to
TLR8(TLR7#103 Kb fromTLR8; Btau5.2), with no evidence
for a significant deviation from a strictly neutral model (Table 4). A regression based test also provided no evidence for the effects of a population bottleneck or selection operating on variation withinTLR7(P$0.05; see Figure 5). Therefore, it seems unlikely that historic bottlenecks are responsible for deviations from
neutrality for bovine TLR8, and more likely that balancing
selection is operating to preserve a limited number of functionally divergent haplotypes. Interestingly, the haplotypes
observed for TLR8were partitioned into two main functional
groups, as classified by our AA modeling (Table 3) and median joining haplotype networks (Figure 3). Specifically, haplotypes that fell into network nodes A, B, and C differed from haplotypes falling into nodes D, E, and F by eight nonsynon-ymous SNPs encoding AA substitutions (Table S2), with at least two (S477N; K903T) that were predicted to impact protein Table 4.Summary data for tests of selection across all members of the bovineTLRgene family.
Gene
Sires Phaseda
Tajima’s
Dallb
Coalescent
P-valuec Sires Phaseda
Tajima’sD
taurusb CoalescentP
-valuec
TLR1 95 (99%) 0.55535 P.0.05 64 (98%) 1.49328 P.0.05
TLR2 92 (96%) 0.51385 P.0.05 64 (98%) -0.06547 P.0.05
TLR3 78 (81%) 2.35965 P,0.03 54 (83%) 3.63792 P,0.001e, f
TLR3-1d
83 (86%) 2.12744 P,0.04 59 (91%) 3.59176 P,0.001e, f
TLR3-2d 94 (98%) 2.07897
P,0.05 63 (97%) 2.65634 P,0.02
TLR4 89 (93%) -0.83191 P.0.05 64 (98%) 0.93683 P.0.05
TLR5 86 (90%) 0.69344 P.0.05 59 (91%) 0.44166 P.0.05
TLR6 91 (95%) 0.16727 P.0.05 65 (100%) -0.71248 P.0.05
TLR7 96 (100%) -0.19828 P.0.05 65 (100%) -0.17037 P.0.05
TLR8 96 (100%) 3.53957 P,0.001e 65 (100%) 3.28763 P,0.001e
TLR9 95 (99%) 1.15800 P.0.05 64 (98%) 1.26794 P.0.05
TLR10 92 (96%) -0.29809 P.0.05 61 (94%) -1.78285 P,0.03
aNumber and proportion of cattle from the sequencing discovery panel with best-pair phase probabilities
$0.90 for all cattle (n = 96), and forB. t. tauruscattle (n = 65). bTajima’sDstatistic [43] for all cattle and forB. t. taurusbreeds.
cSignificance levels were estimated by coalescent simulation using 10,000 replicates [67]. All bolded loci were also significant (P,0.05) via application of the beta distribution [67].
dPhased variation within
TLR3Network 1 andTLR3Network 2.
eSignificant after correction for multiple tests (a/ n locus-specific tests;a= 0.05). f
function (Table 3; Figure 3). Additionally, the four most common haplotypes (nodes A, B, D, and E) differed only by one synonymous SNP (nodes A vs B; encoding S10S) and one putatively benign or tolerated nonsynonymous SNP (nodes D vs E; encoding S492N; see Table S2; Table 3). For these reasons, functional studies are now needed to comprehensively assess the
dynamic range of ligand-induced TLR8 signaling in domestic
cattle.
In addition toin silicodetermined signatures of selection, we also provide evidence for associations between several bovine TLR
SNPs and differential susceptibility to the causative agent of Johne’s disease (Table 5). Unlike most previous studies [19-22,46], we detected associations for whichTLRvariation both enhanced and decreased the risk of MAP infection. Furthermore, the SNPs
demonstrating associations in this study (Table 5) were within bovineTLRgenes that are either known or postulated to recognize ligands that would facilitate MAP detection and signaling [7,11,12,19-22,46,52]. While two recent genome wide association studies (GWAS) employing the Illumina BovineSNP50 assay
provided no evidence for TLR involvement in differential
susceptibility to Johne’s disease in cattle [53,54], the stringency of multiple testing employed during GWAS may have failed to identifyTLRloci modulating relatively small effects. Moreover, the marker density of the BovineSNP50 assay is insufficient to detect all possible associations with bovineTLRvariation [30] (Table S2). The SNP density for the new Illumina BovineHD assay also may not be sufficient to detect all disease associations withTLRloci, and therefore, additional association and functional studies are
Figure 5. Relationship between the number of validated SNPs and SNP diversity here denoted as the effective number of SNPs across all 10TLRloci in A) all cattle, and B) taurine cattle.The linear regressions and estimated 95% confidence intervals are shown in each panel.
needed to clarify the involvement of TLR2, TLR6, and TLR10
with respect to differential susceptibility to MAP infection in Holstein cattle.
Conclusions
Our detailed analysis of the haplotype structure, LD architec-ture, and tagSNP/Indel prediction for all 10 bovine TLRgenes will enable studies aimed at assessing the statistical and functional relationships between validated variation, and differential suscep-tibility to infectious disease [19-27,46] (Table 5). Moreover, because extensive haplotype sharing was confidently predicted for specialized beef and dairy cattle breeds, the deliverables of this study will broadly impact many facets of bovine health research, including the potential for marker-assisted vaccination; using genotypes as indicator variables for enhanced vaccine design or as predictors of animal response.
In view of the emerging global interest in genomic selection in beef and dairy cattle, we provide evidence for balancing selection on at least two of theTLRgenes (TLR3andTLR8), with detection of a weaker selective signal consistent with purifying selection in
TLR10 [30] (Table 4). Interestingly, TLR3 and TLR8 encode molecular sentries that recognize invading double-stranded (ds) and single-stranded (ss) RNA viruses, respectively, thereafter eliciting host innate immune responses (11, 12). Importantly,
selection on TLR3 and TLR8 may have direct implications on
aspects of differential susceptibility to major viral production diseases such as bluetongue (dsRNA;Reoviridae), foot and mouth disease (ssRNA; Picornaviridae), bovine viral diarrhea (ssRNA;
Flaviviridae), calf coronavirus (ssRNA; neonatal diarrhea; Coronavir-idae), and bovine parainfluenza 3 (ssRNA; Paramyxoviridae) (see [55,56]). Moreover, evolution under repeated exposure to many of these diseases may provide some explanation for the observed patterns of variation detected withinTLR3andTLR8. However, it is also possible that more ancient host-pathogen interactions (i.e., eradicated Rinderpest, ssRNA, Paramyxoviridae; etc) may have contributed to the signatures of selection detected in this study. It should also be noted that because frequency distribution tests generally lack power to detect selection [51], departures from neutrality noted in this study are likely to underscore the strength of the selective signals observed (for review see [57]). For these reasons, future studies involving all species of the subfamily Bovinae are needed to help elucidate whether selective signals in
TLR3andTLR8extend beyond modern domestic cattle lineages.
Moreover, variation within these genes should be comprehensively evaluated with respect to differences in ligand-induced signaling, disease susceptibility, and the potential for marker-assisted vaccination in domestic cattle.
In addition to selective signals observed forTLR3 and TLR8, several tentative associations were detected between bovineTLR
SNPs (Table 5) and differential susceptibility to MAP infection which have not previously been reported, with one implicated locus (TLR10) also exhibiting evidence of purifying selection (Table 4) [30]. However, because the natural ligand(s) forTLR10have yet to be comprehensively elucidated, the precise origin of this selective signal remains unclear. Previous studies [13,58] indicate that human TLR10 forms functional heterodimers with both TLR2 and TLR1, thereby enabling the resulting protein complexes to recognize a wide variety of microbial ligands [58], including those derived from Mycobacteria [11,12,14,59]. Similarly, TLR2 is also known to form functional heterodimers with TLR6 [14]. Recently, AA substitutions in humanTLR1andTLR10were demonstrated to negatively impact receptor function [58-59], with TLR10ligand recognition similar to the known range of ligands established for TLR1 [58]. The results of our single marker association tests indirectly support the biological concept of functional unity with respect to bovineTLR2,TLR6, andTLR10, with variation at all three loci categorically linked to a common microbial phenotype (bacterial culture status for MAP) in Holstein cattle.
Methods
DNA Samples for SNP Discovery
Bovine DNA samples (n = 96) representing B. t. taurus, B. t. indicus, and their hybrids were isolated from spermatozoa as previously described [23,25,30]. Bovine subspecies designation, breed names, and sample sizes (in parentheses) were:B. t. taurus -Angus (5), Belgian Blue (2), Blonde d’Aquitaine (1), Braunvieh (4), Brown Swiss (2), Charolais (6), Chianina-Chiangus (4), Corriente (1), Gelbvieh (4), Hereford (3), Holstein (6), Limousin (4), Maine-Anjou (3), Red Angus (4), Red Poll (1), Salers (2), Senepol (2), Shorthorn (4), Simmental (5), Texas Longhorn (2);B. t. indicus -Brahman (8), Nelore (2); Hybrids, termed Composites - Beefmaster (4), Braford (2), Brahmousin (2), Brangus (3), Piedmontese (1), Red Brangus (2), Romagnola (2), Santa Gertrudis (2), Simbrah (3). Bovine subspecies were assigned based on phenotype and breed origin (http://www.ansi.okstate.edu/breeds/cattle/).
Table 5.Summary statistics for single marker association tests with risk ofMycobacterium aviumsppparatuberculosisinfection.
95% Confidence Intervala
Marker dbSNP ID Model Odds Ratio P-valuec Lower Bound Upper Bound
TLR2-SNP 9564 rs68268245 Recessive 3.20 0.032d 1.11 9.24 TLR2-SNP 10511 ss470256479 Recessive 3.21 0.031d 1.11 9.25 TLR2-SNP 10540 rs43706433 Recessive 2.51 0.020d 1.15 5.48
TLR4-SNP 9788 rs8193069 Additive 0.27b 0.026 0.09 0.86
TLR6-SNP 14578 rs43702941 Additive 2.58b 0.012e 1.23 5.43 TLR10-SNP 774 rs55617325 Additive 0.53b 0.041e 0.29 0.97
a95% Confidence interval for odds ratio. bOdds ratio adjusted for the effect of birth year. cP-value not corrected for multiple comparisons. d
P-value marginal (0.053) after locus-specific FDR correction [45] (http://sdmproject.com/utilities/?show=FDR).
eP-value,0.05 after locus-specific FDR correction [45] (http://sdmproject.com/utilities/?show=FDR).TLR1,TLR6, andTLR10were considered a single locus for multiple test correction.
BovineTLRSequencing and SNP Detection
Procedures involving primer design, PCR amplification with gene-specific primers, and standard dye-terminator cycle sequenc-ing (Sanger) of all 10 bovineTLRs have previously been described [23-25,60]. For this study, we synthesized gene-specific amplifica-tion primers with a unique 10 bp 59 barcode (Roche MIDs) for
each of the 10 bovine TLR genes (Table S5). Thereafter, we
standardized all 96 discovery panel DNAs to 50 ng/ml and created
three DNA pools, with each pool consisting of 32 elite sire DNAs mixed at equal concentrations. Notably, larger-scale DNA pooling in a human amplicon study supports the accuracy and reliability of this approach when coupled with Roche 454 pyrosequencing [61]. Three bovine DNA pools were used to amplify allTLRtargets via barcoded primers (Table S5), with PCR conditions and thermal parameters as previously described [23-25,60]. Targets that were intolerant to the addition of 59oligonucleotide barcodes for PCR amplification were amplified using standard primers in conjunc-tion with downstream dye-terminator cycle sequencing methods previously described [23-25,60], with one exception: A second set of DNA pools (n = 12) was created, with each pool containing equal concentrations of DNA from eight elite sires derived from the sequencing discovery panel. Importantly, both sets of DNA pools (Sanger and Roche 454) were seeded with one or more reference DNAs that had previously been sequenced and/or SNP
genotyped across all 10 bovine TLR genes [23-25,60], which
collectively included$12 reference DNAs possessing 216 validated diallelic variants (212 SNPs+ 4 indels) [30]. All amplicons were purified using the Qiaquick PCR purification kit (Qiagen, Valencia, CA) as previously described [24,25], and the concen-trations were estimated by Nanodrop. For preparation of a Roche 454 Titanium fragment library, we standardized all barcoded amplicons to 10 ng/ml and devised a normalization procedure that
accounted for differences in amplicon size (Table S1). Because the
TLRamplicons differed in size, an adjustment was necessary to ensure balanced 454 pyrosequencing results. Specifically, using amplicon size, we computed the mean (bp) and standard deviation (SD; bp) across all PCR targets. Thereafter, any amplicon deviating from the mean by$0.5 SDs in either direction was subject to proportional adjustment within the fragment library (Table S1). The direction of adjustment (plus or minus) was determined by the direction of the deviation (i.e., smaller = pro-portionally less template; larger = propro-portionally more template; Table S1). Because the emulsion PCR process involved in the preparation of Roche 454 Titanium fragment libraries favors smaller fragments, amplicons smaller than the mean by$0.5 SDs must be proportionally reduced in the final library, whereas the opposite is true for larger amplicons. Following normalization, the
bovine TLR sequencing library was constructed via random
ligation of sequencing adaptors provided with the GS FLX Titanium library kit (Roche Applied Science, Indianapolis, IN). All library preparation, emulsion PCR, quantitation, and sequencing steps followed the manufacturer’s protocol (Roche Applied Science).
SNP detection analyses for the resulting pyrosequencing data employed the Neighborhood Quality Standard algorithm [62,63] implemented within CLC Genomics Workbench (v3.7.1), as previously described [29]. Putative SNPs were filtered using a method devised from a prioriknowledge of biallelic controls (212
SNPs + 4 indels) [30] that were purposely seeded into the
amplicon library. Briefly, we considered the possibility that some SNPs may only be found as one allele in a single elite sire (1/192 total alleles; see reference 30 for examples). Therefore, we filtered all putative SNPs predicted from our analysis of the pyrosequenc-ing data uspyrosequenc-ing the followpyrosequenc-ing formula: 1/1926(Total SNP
Cover-age) = Theoretical minimum number of reads, which represents the smallest number of reads required to shuttle putative SNPs into a validation workflow involving custom, allele-specific genotyping assays. This method proved valuable for the discovery and validation of many low frequency SNPs, including those that occurred as one allele for a single discovery panel sire (i.e.,TLR5
putative nonsense SNP = 1/192 alleles in the discovery panel). For SNP discovery using standard dye-terminator sequencing reads, we used an alignment-based method of variant detection within the program Sequencher 4.6 [23,25]. Briefly, high quality electropherograms were manually inspected for any evidence of a double peak. Individual nucleotide sites displaying any evidence of heterozygosity within$1 sequencing read were shuttled to our SNP validation workflow.
SNP Validation and Genotyping
All 96 DNAs from the pyrosequencing discovery panel were also used for allele-specific genotyping. Additionally for bovine
TLRs recognizing bacterial ligands, we also utilized the following industry-relevant DNA panels: Beef (48 Purebred Angus, 1 Herd); Dairy (405 Holstein dairy cows, 3 Herds). SNPs and indels were genotyped using the KASPar allele-specific fluorescent genotyping system (Kbiosciences, Hertfordshire UK), as previously described [29,30]. Thermal cycling parameters and reaction concentrations followed manufacturer’s recommendations, with some
modifica-tions to MgCl2 concentrations. Primer sequences and MgCl2
concentrations are available on request. Genotype clustering and calling was performed using KlusterCaller software (Kbiosciences). Genotype quality was assessed by manually inspecting the clustering data for every individual marker, and by comparing KASPar-derived genotypes to those derived from previously reported sequence data [23,25,30]. Poor clustering or inconsistent genotypes precipitated the following workflow: 1) Further optimization and/or redesigning the SNP assay followed by; 2) Genotyping the inconsistent samples again. Notably, to minimize the frequency of missing genotypes from a very low proportion of failed assays, most SNPs were genotyped multiple times for every DNA sample. Genotype data are available in Table S6.
Haplotype Inference, LD Estimates and Variant Tagging
Unphased diploid genotypes were compiled and cross-checked for parsing errors using two custom software packages [30]. Haplotype reconstruction and missing data imputation (,0.58%) was performed with PHASE 2.1 [31,64,65] using all validated intragenic polymorphisms, all cattle for a given locus, and the – X10 option. Haplotype estimation using PHASE 2.1 is not sensitive to departures from HWE [31,64,65]. Predicted haplotype phases with best pair probabilities$0.90 were retained for further analysis. Bovine X-linked haplotypes (TLR7,TLR8) were directly ascertained by genotype homozygosity in our sire panel used for SNP discovery. Estimates of recombination across each gene were also assessed in PHASE 2.1 using the general model for varying recombination rate [31,34,35]. Deviation from the average
background recombination rate () [34,35] by a factor$2.5
between adjacent sites was considered evidence for historical recombination.
Haploview for all validated markers within each gene for B. t. taurus and all cattle combined. A minimal set of tagSNPs/Indels predicted to capture 100% of the variation (r2.0.80) segregating in B. t. taurus and all cattle combined was deduced using the Tagger algorithm implemented in Haploview.
Median Joining Haplotype Networks
Because median joining (MJ) networks require the absence of recombination [66], genes displaying evidence of historical recombination (TLR2, TLR3, TLR6) were each partitioned into two regions of elevated LD. Haplotypes were reconstructed [31] for each intragenic region and best pairs were used for MJ network analyses [28]. This approach improved the proportion of cattle with best pairs phase probabilities$0.90 and eliminated regions displaying overt evidence of recombination. MJ networks were constructed using Network 4.5.1.0 (Fluxus Technology Ltd, Suffolk, England), and the default character weights of 10 for SNPs and 20 for indels. Results were visualized, annotated, and adjusted within Network Publisher (Fluxus Technology Ltd, Suffolk, England). Branch angles were adjusted to ensure proper network magnification and clarity without changing branch lengths.
AA Substitution Phenotypes andTLR10Evolutionary Analyses
Bovine AA substitution phenotypes were predicted using PolyPhen [38] and SIFT [39] (http://genetics.bwh.harvard.edu/ pph/; http://genetics.bwh.harvard.edu/pph/pph_help.html; http:// sift.jcvi.org/; http://sift.jcvi.org/www/SIFT_help.html) with the default settings. Results other than ‘‘benign’’ or ‘‘tolerated’’ were categorized as substitutions predicted to impact protein function [30,38,39]. To assess the potential for functional and/or selective constraint across the entire bovineTLRgene family, a goodness of fit test (x2) was performed assuming equal probabilities for benign or tolerated AA phenotypes versus those predicted to impact protein function. Frequency distribution tests, including Tajima’sD[43] and Fu’s FS [44], were performed in DnaSP v4.90.1 [67] using all validated SNPs. Significance levels for frequency distribution tests were defined by confidence intervals estimated for each test statistic via coalescent simulation (10,000 replicates) [67]. Simulations were performed given the observed number of segregating sites, both with and without recombination [67,68].
At each polymorphism we estimated the effective number of alleles as Ei= 1/(1 - 2pi(1-pi)) = 1/(pi2 + (1 - pi)2) = 1/(expected HWE frequency of homozygotes) where piis allele frequency at the ithlocus. Thus a measure of polymorphism diversity is log2(Ei) which also represents the information content of each SNP [30]. For monomorphic SNPs log2(Ei) = 0 and for SNPs with pi= 0.5, log2(Ei) = 1. Thus by summing across the Njpolymorphisms within the jthgene we obtain the diversity index I
j= . We used regression analysis to examine the relationship between Ijand Njfor these genes and to test for outliers using 95% confidence estimates for the fitted regression.
Association Tests with MAP infection status
A case-control study was performed to estimate the association between specificTLRgenotypes and MAP infection in Holstein cattle. The study population was derived from an established repository [69] that included whole blood samples preserved from adult Holstein cattle in three herds that were characterized on the basis of: 1) MAP bacterial culture of feces; 2) MAP bacterial culture of tissues for harvested cattle; 3) ELISA values for MAP-specific antibody. Cattle from which MAP was cultured in the
feces and/or the tissues collected at harvest were selected as cases (n = 68). Herd-matched controls (n = 270) were selected from those cattle in the repository with negative ELISA and bacterial culture data. Cattle with multiple negative tests were preferentially selected to reduce the probability of misclassification relative to infection status due to the low sensitivity of available diagnostic methods for MAP. DNA was extracted from available blood specimens using a commercial kit (MoBio DNA non-spin, Carlsbad, CA) and assessed for quality as well as concentration by standard spectrophotometric methods. Genotypes for validated SNPs and indels in the 59 upstream regions, introns, and those associated with nonsynonymous or putative nonsense mutations in bovine TLR genes recognizing bacterial ligands (TLR1, TLR2,
TLR4, TLR5, TLR6, TLR9, TLR10) (see refs [11,14]) were evaluated for further analysis. Loci fixed for the major allele in our dairy population were excluded, leaving 35 nonsynonymous and 1 putative nonsense substitution, and 37 other SNP loci within the 59upstream regions or intragenic introns. For these 73 variable sites, we excluded SNPs and indels with MAFs,0.01 in our infected cases, leaving 32 SNPs and 3 indels for association tests (see Table S1).
Conditional logistic regression models were constructed for each of the 35 variable loci to estimate the relative odds of being infected with MAP based on the defined diagnostic criteria adjusted for the effects of herd using the PHREG procedure of SAS (SAS v. 9.2, SAS, Cary, NC). Effects of genotype were estimated using 3 different covariate specifications. First, an additive mode of inheritance was examined whereby the odds of infection associated with each additional copy of the minor allele was modeled as a single continuous covariate. Second, a recessive mode of inheritance was modeled, where the odds of infection in cattle homozygous for the minor allele were estimated relative to cattle heterozygous and homozyzgous for the major allele. Finally, each genotype was modeled as an indicator variable and effect estimates were generated for cattle homozygous for the minor allele, and for heterozygous cattle, both relative to cattle homozygous for the major allele. This allowed evaluation of assumptions in the additive model with respect to the effect of the additional copies of the minor allele being linear in the log odds, and potential intermediate effects of the minor allele not captured in the other models. Potential confounding by age was examined by including birth year as a fixed covariate (where available), and was defined as a change in the relative odds of greater than 20% after addition of the birth year term. For models where evidence of confounding by age was detected, birth year was retained in the model to adjust genotype estimates for this effect. With the exception ofTLR1,
TLR6, andTLR10, all single markerP-values were corrected for multiple testing by applying the FDR correction (http:// sdmproject.com/utilities/?show=FDR) [45] to the rawP-values derived from each investigated gene (locus-specific correction). Given the close physical proximity ofTLR1,TLR6, andTLR10
on BTA6, these genes were considered a single locus for correction of multiple tests. However, it should be noted that
none of the variable markers within TLR1 met our inclusion
criteria (MAFs.0.01), and therefore, locus-specific correction was only applied to rawP-values fromTLR6andTLR10.
recognize bacterial ligands. Significance was estimated via 1,000 permutations.
Supporting Information
Figure S1 Median joining (MJ) haplotype networks
constructed for bovine TLR1, TLR2, TLR4, TLR5, TLR6, TLR7, and TLR9 using haplotypes predicted for all cattle.For all loci except TLR7, all cattle is defined as follows: n = 96 AI sires, 31 breeds; 48 Purebred Angus; 405 Holstein cattle. For TLR7, only the sequencing discovery panel was genotyped and is represented (n = 96 AI sires, 31 breeds). Because MJ networks require the absence of recombination [66], each network represents intragenic regions of elevated LD. Haplotypes predicted forB. t. taurus,B. t. indicusand hybrids (termed ‘‘composites’’) are color coded. Numbers indicate SNP and indel positions in numerical order (see Table S2 for SNP information). Node sizes are proportional to haplotype frequency, and all branch lengths are drawn to scale. Alphabetized letters at nodes represent the breed distribution of each haplotype (Table S4). Median vectors are indicated as ‘‘mv’’.
(PPTX)
Table S1 TLRAmplicon Normalization (XLSX).
(XLSX)
Table S2 Validated SNPs and Indels (XLSX).
(XLSX)
Table S3 TagSNPs and Indels (XLSX).
(XLSX)
Table S4 Network Node Breed Key (XLSX).
(XLSX)
Table S5 Barcoded Primers (XLSX).
(XLSX)
Table S6 TLRGenotype Data (XLSX).
(XLSX)
Acknowledgments
CMS thanks Dr. Alejandro P. Rooney for critical review and comments related to the manuscript. We also thank Steven Hoffman for insight regarding Roche Titanium chemistry and barcoded primer design with 59
phosphorothioate bond modifications.
Author Contributions
Conceived and designed the experiments: CMS. Performed the experi-ments: CAF EKB SED CMS. Analyzed the data: CAF CMS. Wrote the paper: CAF CMS. Performed regression analyses: JBO JFT CMS. Annotated genes: MV. Designed custom software to manage and compile genotype data: PMS. Provided DNA: JBO RHW YHS RDS JFT JEW CMS. Provided animal disease phenotypes: RHW YHS. Provided editorial suggestions and revisions: EKB JBO SED PMS MV RHW YHS RDS JFT JEW.
References
1. VanRaden PM, Van Tassell CP, Wiggans GR, Sonstegard TS, Schnabel RD, et al. (2009) Invited review: reliability of genomic predictions for North American Holstein bulls. J Dairy Sci 92: 16–24.
2. Bovine Genome Sequencing, Analysis Consortium, Elsik CG, Tellam RL, Worley KC (2009) The genome sequence of taurine cattle: A window to ruminant biology and evolution. Science 324: 522–528.
3. Bovine HAPMAP Consortium (2009) Genome-Wide Survey of SNP Variation Uncovers the Genetic Structure of Cattle Breeds. Science 324: 529–523. 4. Rosenthal KL (2006) Tweaking innate immunity: The promise of innate
immunologicals as anti-infectives. Can J Infect Dis Med Microbiol 17: 307–314. 5. Vasselon T, Detmers PA (2002) Toll Receptors: a Central Element in Innate
Immune Responses. Infect Immun 70: 1033–1041.
6. Kaisho T, Akira S (2006) Toll-like receptor function and signaling. J Allergy Clin Immunol 117: 979–987.
7. Plain KM, Purdie AC, Begg DJ, de Silva K, Whittington RJ (2010) Toll-like receptor (TLR) 6 and TLR1 differentiation in gene expression studies of Johne’s disease. Vet Immunol Immunopathol 137: 142–148.
8. Jann OC, King A, Corrales NL, Anderson SI, Jensen K, et al. (2009) Comparative genomics of Toll-like receptor signaling in five species. BMC Genomics 10: 216.
9. Kataria RS, Tait Jr. RG, Kumar D, Ortega MA, Rodiguez J, et al. (2011) Association of toll-like receptor four single nucleotide polymorphisms with incidence of infectious bovine keratoconjunctivitis (IBK) in cattle. Immunoge-netics 63: 115–119.
10. Glass EJ, Baxter R, Leach RJ, Jann OC (2011) Genes controlling vaccine responses and disease resistance to respiratory viral pathogens in cattle. Vet Immunol Immunopathol. In press.
11. West AP, Koblansky AA, Ghosh S (2006) Recognition and Signaling by Toll-Like Receptors. Annu Rev Cell Dev Biol 22: 409–437.
12. Akira S, Takeda K (2004) Toll-like receptor signaling. Nat Rev Immunol 4: 499–511.
13. Hasan U, Chaffois C, Gaillard C, Saulnier V, Merck E, et al. (2005) Human TLR10 is a functional receptor, expressed by B cells and plasmacytoid dendritic cells, which activates gene transcription through MyD88. J Immunol 174: 2942–2950. 14. Ozinsky A, Underhill DM, Fontenot JD, Hajjar AM, Smith KD, et al. (2000)
The repertoire for pattern recognition of pathogens by the innate immune system is defined by cooperation between Toll-like receptors. Proc Natl Acad Sci U S A 97: 13766–13771.
15. Mukhopadhyay S, Herre J, Brown GD, Gordon S (2004) The potential for Toll-like receptors to collaborate with other innate immune receptors. Immunology 112: 521–530.
16. Govindarai RG, Manavalan B, Lee G, Choi S (2010) Molecular modeling-based evaluation of hTLR10 and identification of potential ligands in Toll-like receptor signaling. PLoS ONE 5(9):e12713. (Available: http://www.ncbi.nlm.nih.gov/ pmc/articles/PMC2943521/?tool=pubmed. Accessed 2011 Jul 3).
17. Merx S, Zimmer W, Neumaier M, Ahmad-Nejad PA (2006) Characterization and functional investigation of single nucleotide polymorphisms (SNPs) in the human TLR5 gene. Hum Mutat 27: 293.
18. Texereau J, Chiche JD, Taylor W, Choukroun G, Comba B, et al. (2005) The importance of Toll-like receptor 2 polymorphisms in severe infections. Clin Infect Dis 41 Suppl 7: S408–S415.
19. Mucha R, Bhide MR, Chakurkar EB, Novak M, Mikula I Sr (2009) Toll-like receptors TLR1, TLR2, and TLR4 gene mutations and natural resistance to Mycobacterium avium subsp. paratuberculosis infection in cattle. Vet Immunol Immunopathol 128: 381–388.
20. Bhide MR, Mucha R, Mukula I Jr., Kisova L, Skrabana R, et al. (2009) Novel mutations in TLR genes cause hyporesponsiveness toMycobacterium aviumsubsp. paratuberculosisinfection. BMC Genet 10: 21.
21. Pinedo PJ, Buergelt CD, Donovan GA, Melendez P, Morel L, et al. (2009) Candidate gene polymorphisms (BoIFNG, TLR4, SLC11A1) as risk factors for paratuberculosis infection in cattle. Prev Vet Med 91: 189–196.
22. Pinedo PJ, Wang C, Li Y, Rae DO, Wu R (2009) Risk haplotype analysis for bovine paratuberculosis. Mamm Genome 20: 124–129.
23. Cargill EJ, Womack JE (2007) Detection of polymorphisms in bovine toll-like receptors 3, 7, 8, and 9. Genomics 89: 745–755.
24. Seabury CM, Cargill EJ, Womack JE (2007) Sequence variability and protein domain architectures for bovine Toll-like receptors 1, 5, and 10. Genomics 90: 502–515.
25. Seabury CM, Womack JE (2008) Analysis of sequence variability and protein domain architectures for bovine Peptidoglycan Receptor Protein 1 (PGLYRP1) and Toll-Like Receptors 2 and 6. Genomics 92: 235–245.
26. Kuhn CH, Bennetwitz J, Reinsch N, Xu N, Thomsen H, et al. (2003) Quantitative trait loci mapping of functional traits in the German Holstein cattle population. J Dairy Sci 86: 360–368.
27. Heyen DW, Weller JI, Ron M, Ban M, Beever JE, et al. (1999) A genome scan for QTL influencing milk production and health traits in dairy cattle. Physiol Genomics 1: 165–175.
28. Bandelt HJ, Forster P, Rohl A (1999) Median joining networks for inferring intraspecific phylogenies. Mol Biol Evol 16: 37–48.
29. Seabury CM, Bhattarai EK, Taylor JF, Viswanathan GG, Cooper SM, et al. (2011) Genome-wide polymorphism and comparative analyses in the white-tailed deer (Odocoileus virginianus): a model for conservation genomics. PLoS ONE 6: e15811.
30. Seabury CM, Seabury PM, Decker JE, Schnabel RD, Taylor JF, et al. (2010) Diversity and evolution of 11 innate immune genes inBos taurus taurusandBos taurus indicuscattle. Proc Natl Acad Sci U S A 107: 151–156.
31. Stephens M, Smith NJ, Donnelly P (2001) A new statistical method for haplotype reconstruction from population data. Am J Hum Genet 68: 978–989. 32. Barrett JC, Fry B, Maller J, Daly MJ (2005) Haploview: analysis and
![Table 5). Validated polymorphisms, reconstructed haplotypes, and the tagSNPs/Indels identified in this study will directly facilitate the fine mapping of bovine health-related QTL [23-27], while also enabling further evaluation of SNPs tentatively associat](https://thumb-eu.123doks.com/thumbv2/123dok_br/17216771.243679/6.918.89.565.92.450/validated-polymorphisms-reconstructed-haplotypes-identified-facilitate-evaluation-tentatively.webp)