____________________________
Corresponding author:Sofija Petrovi , Faculty of Agriculture, sq. D. Obradovi a 8, 21000 Novi Sad, Serbia. Phone: +381 21 485 3211, e-mail [email protected]
UDC 575:633.11 DOI: 10.2298/GENSR1003545P
Original scientific paper
THE VARIATION OF YIELD COMPONENTS IN WHEAT (Triticum aestivum L.) IN RESPONSE TO STRESSFUL GROWING CONDITIONS OF
ALKALINE SOIL
Sofija PETROVI 1, Miodrag DIMITRIJEVI 1, Milivoj BELI 1, Borislav
BANJAC1,Jelena BOŠKOVI 2,Veselinka ZE EVI 2 and Borivoj PEJI 1
1 Department of Field and Vegetable Crops, Faculty of Agriculture, University of
Novi Sad, Serbia
2
Faculty of Biofarming - Ba ka Topola, Megatrend University, Belgrade, Serbia
Petrovi S., M. Dimitrijevi , M. Beli , B.Banjac, J.Boškovi , V.Ze evi and B. Peji (2010):The variation of yield components in wheat (Triticum aestivum L.,) in response to stressful growing conditions of alkaline soil - Genetika, Vol 42, No. 3 545 -555.
conditions and ameliorative measures. Based on the AMMI analysis results the significance of PCA axis was observed.
Key words: AMMI, solonetz, stability, wheat, yield components
INTRODUCTION
Constant striving to intensify agricultural production, using high quantities of chemicals has led to degradation of arable land, pollution of the environment and significant climate change, during the twentieth century. The result is stress cultivation conditions in crop production, such as drought, soil salinization, extreme temperatures, etc.Wheat crop is a crop that has great economic importance and requires favorable conditions of soil, both in terms of fertility, and in terms of physical properties and chemical reactions. In Vojvodina, beside the fertile chernozem soil, there is a low productive soil of solonetz type, with adverse physical and chemical properties, high content of adsorbed sodium and pH value above 9 (ŽIVKOVI et al., 1972; BELI , 2005). Solonetz is mostly used as a natural pasture.
Translation of solonetz to farmland fund could be possible by using reclamation measures including: the application of chemical ameliorations, disturbation of Bt horizon, laying drainage and open channel network, fertilization with organic and mineral fertilizers (BELI et al., 2006).The behavior of genotypes in different environmental conditions was caused by its genetic basis and interacting with the external environment. In modern wheat breeding programs, these sources of variation helps to select growing regions in which one genotype gave its best, moreover they are essential for the selection of genotypes that would best meet environmental, cultural practices and economic demands of some regions (DIMITRIJEVI and PETROVI , 2005; DIMITRIJEVI et al., 2009; SABAGHNIA et al., 2008).The aim of this study was to examine, by the application of AMMI model, variation of number and weight of grains per spike of wheat genotypes and to study the impact of the genotype by environment interaction on alkaline soil of solonetz type.
MATERIAL AND METHOD
repair) and soil with the use of phosphogypsum as ameliorative measure in the amount of 25t/ha and 50/ha. Amelioration led to the increment of humus content in the deeper layers and changes in chemical reactions (reducing alkalinity). The cultivars were sown in rows of 2m length, with a 20cm row spacing and spacing between plants in a row 10 cm, where with the seeding 50kg of NPK15: 15:15 fertilizers was given. In the phase of full maturity, we analyzed the number and yield of grains per spike (GNS and GYS, respectively). Genotype by environment interaction (GEI) was tested using AMMI (Additive Main Effects and Multiplicative Interaction) by ZOBELet al. (1988). Data processing was performed in GenStat 8th Edition (trial ver.) VSN International Ltd (www. vsn-intl.com).
RESULTS AND DISCUSSION
Grain number per spike (GNS) belongs to traits directly highly correlated to grain yield. BOKAN and MALEŠEVI (2004) stated that the highest yield was achieved in seasons where the highest grain number per spike was observed. Mean values, denoted in the experiment, varied within the range of 27 to 30 grains per spike. Somewhat lower GNS average was calculated for varieties Dragana, Simonida and Ljiljana (
x
= 23,x
= 25 andx
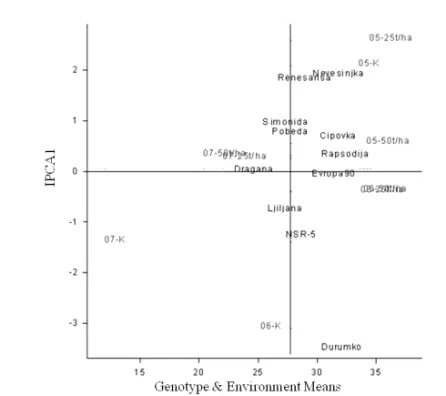
= 26, respectively). The effect of soil type, as well as, ameliorative measures could be noticed easily by comparing treatment means. The lack of significant average differences between treatments in 2004/2005 vegetation period, brings up the importance of environmental condition variation in effectiveness of ameliorative measures (tab. 1).According to ANOVA, partitioning the total sum of squares for the trial revealed the complex nature of variation, especially genotype by environment interaction, where three explainable sources of variation were denoted. The first source of variation, quantified by IPCA1 axis held about 36% of GEI sum of squares, while two other axes, IPCA2 and IPCA3, brought out about 27% and 19%, respectively (tab. 2).
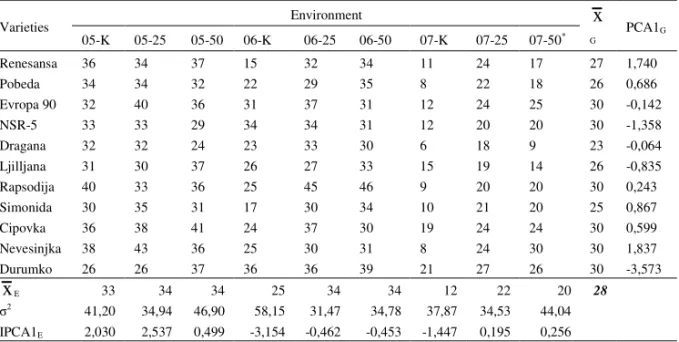
Table 1. Grain number per spike mean values for 11 wheat varieties in 9 environments. Genotype and environmental means, variance ( 2) and the first principal axis (IPCA1) are given
Environment Varieties
05-K 05-25 05-50 06-K 06-25 06-50 07-K 07-25 07-50*
x
G
PCA1G
Renesansa 36 34 37 15 32 34 11 24 17 27 1,740
Pobeda 34 34 32 22 29 35 8 22 18 26 0,686
Evropa 90 32 40 36 31 37 31 12 24 25 30 -0,142
NSR-5 33 33 29 34 34 31 12 20 20 30 -1,358
Dragana 32 32 24 23 33 30 6 18 9 23 -0,064
Ljilljana 31 30 37 26 27 33 15 19 14 26 -0,835
Rapsodija 40 33 36 25 45 46 9 20 20 30 0,243
Simonida 30 35 31 17 30 34 10 21 20 25 0,867
Cipovka 36 38 41 24 37 30 19 24 24 30 0,599
Nevesinjka 38 43 36 25 30 31 8 24 30 30 1,837
Durumko 26 26 37 36 36 39 21 27 26 30 -3,573
x
E 33 34 34 25 34 34 12 22 20 282 41,20 34,94 46,90 58,15 31,47 34,78 37,87 34,53 44,04
IPCA1E 2,030 2,537 0,499 -3,154 -0,462 -0,453 -1,447 0,195 0,256
*Environmental labels where the first number represents harvest year, and the second label represents
control (K), and 25t/ha or 50t/ha phosphogypsum applied.
LSD0.05=3.254
LSD0.01=4.250
Table 2. ANOVA for grain number per spike mean values for 11 wheat varieties in 9 environments.
F – tab. Sources of variation
Degree of freedom
Sum of squares
Mean
square F values 0,05 0,01
Total 296 29394 99,3
Treatments 98 24032 245,5 **9,28 1,00 1,00
Genotypes 10 1691 169,1 **6,40 1,83 2,32
Environments 8 17750 2218,7 **65,77 1,94 2,41
Block 18 607 33,70 1,28 1,57 1,87
GE interaction 80 4591 57,4 **2,17 1,00 1,00
IPCA1 17 1639 96,4 **3,65 1,57 1,87
IPCA2 15 1221 81,4 **3,08 1,75 2,18
IPCA3 13 869 66,80 **2,53 1,75 2,18
Residue 35 862 24,60 0,93 1,46 1,69
Figure 1. Biplot of the grain number per spike for 11 varieties of wheat in 9 environments
Grain weight per spike (GWS) is an important component of plant yield, as well as the number of grains per spike, can be included in the indirect indicators of grain yield (Asfaq et al., 2003; Petrovi et al., 2009; Kneževi et al., 2008).Weight and number of grains per spike Ze evi et al. (2010) are among the criteria in the selection process in wheat breeding. According to the results, a greater sensitivity of that mass property to the meteorological conditions, could be observed, as the general average was the lowest in the control variant (solonetz without ameliorative measures) in dry growing conditions of 2006/2007 vegetation period. More favorable 2004/2005 season exhibited more significant impact on minimizing the differences between the averages per treatment. In terms of 2005/2006, that was characterized by increased rainfall in March and April, less rainfall in May with the temperature at the level of multi-annual average, and then cooling and stronger precipitation during June, the effects ameliorative measures were the most obvious (Table 3).
Table 3. Mean values of grain weight per spike (g) 11 wheat varieties in 9 agroecological environments. Genotypic and environmental values, the variance ( 2), and the first axis of variation (IPCA1), are given
Environments PCAg1
Varieties
05-K 05-25 05-50 06-K 06-25 06-50 07-K 07-25 07-50
x
GRenesansa 1,46 1,39 1,56 0,39 1,37 1,33 0,47 1,05 0,57 1,07 0,050 Pobeda 1,35 1,32 1,34 0,68 1,22 1,54 0,32 0,93 0,75 1,05 -0,105 Evropa 90 1,31 1,50 1,33 1,19 1,53 1,25 0,42 0,97 0,96 1,16 -0,183 NSR-5 1,39 1,26 1,24 1,26 1,50 1,19 0,49 0,82 0,87 1,11 -0,232 Dragana 1,37 1,26 1,02 0,81 1,60 1,25 0,29 0,83 0,36 0,98 -0,575 Ljilljana 1,18 1,15 1,60 0,96 1,20 1,25 0,54 0,79 0,57 1,03 0,085 Rapsodija 1,63 1,21 1,47 0,79 1,51 1,40 0,41 0,81 0,79 1,11 -0,206 Simonida 1,09 1,27 1,28 0,65 1,20 1,23 0,36 0,93 0,79 0,98 0,049 Cipovka 1,42 1,37 1,57 0,89 1,48 1,12 0,68 0,89 0,86 1,14 0,049 Nevesinjka 1,44 1,56 1,43 0,69 1,07 1,08 0,31 1,07 1,32 1,11 0,290 Durumko 1,20 1,05 1,99 0,93 1,05 1,16 0,96 1,22 1,16 1,19 0,778
x
E 1,35 1,30 1,44 0,84 1,34 1,25 0,48 0,94 0,82 1,08 2 0,090 0,053 0,124 0,084 0,063 0,059 0,075 0,072 0,950IPCAe1 -0,263 -0,192 0,544 -0,193 -0,571 -0,284 0,315 0,214 0,431 LSD0.05=0.155 LSD0.01=0.202
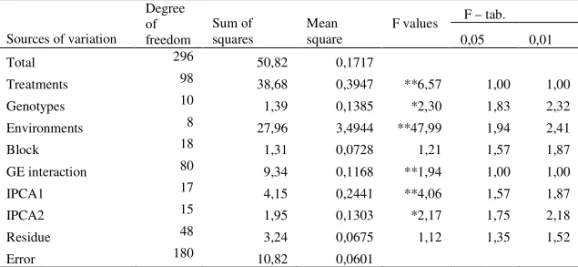
Table 4. Analysis of variance for grain weight per spike (g) 11 wheat varieties in 9 agroecological environment
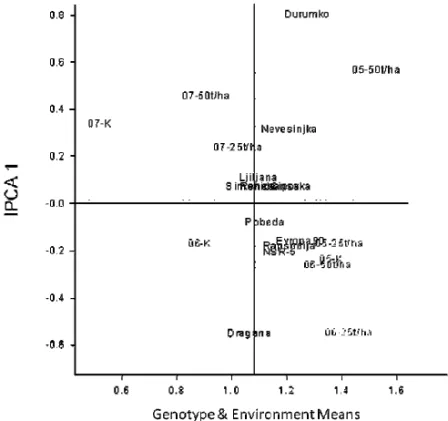
Screening the average distribution of the treatment in respect to overall trial mean value, i.e. analyzing the additive component of variation the influence of more favorable weather conditions of 2004/2005 and 2005/2006, compared to the dry 2006/2007, on grain weight per spike average variation, was observable. The array of varieties indicates multiplicative factors of variation influence on the GWS variation, while the additive component was significantly reduced, which reduces the
F – tab. Sources of variation
Degree of freedom
Sum of
squares Mean square F values 0,05 0,01
Total 296 50,82 0,1717
Treatments 98 38,68 0,3947 **6,57 1,00 1,00
Genotypes 10 1,39 0,1385 *2,30 1,83 2,32
Environments 8 27,96 3,4944 **47,99 1,94 2,41
Block 18 1,31 0,0728 1,21 1,57 1,87
GE interaction 80 9,34 0,1168 **1,94 1,00 1,00
IPCA1 17 4,15 0,2441 **4,06 1,57 1,87
IPCA2 15 1,95 0,1303 *2,17 1,75 2,18
Residue 48 3,24 0,0675 1,12 1,35 1,52
repeatability of the experiment. Effect of treatment is less evident, because of the more complex nature of GEI and it was notable that weather conditions corrected treatment effect and influenced the reaction of varieties to amelioration measures. Varieties Simonida and Ljiljana exhibited a stable response to the first, predominant source of variation (Fig. 2).
Figure 2. Biplot of grain weight / spike (g) 11 wheat varieties in 9 environments
CONCLUSION
The experiment showed a complex variation of the GE interaction in the given conditions. Varieties Europe 90 and Dragana were recorded as the most stable for the grain numberper spike, and Simonida, Ljiljana, as well as, Ljiljana for grain weight per spike. For the traits in study, varieties Durumko and Nevesinjka well endured the most stressful conditions on the control. Varieties responded to ameliorated measures enhancing the level of GNS and GWS, at the most, especially in favorable agro-ecological conditions.
Received April 20th 2010
REFERENCES
ASFAQ, M., A., SALAM KHAN, and Z.ALI (2003). Association of Morphological Traits with Grain Yield in Wheat (Triticum aestivum L.). Int. J. Agri. Biol., 5(3), 262-264
BELI , M. (2005). Effect of meliorative practices mechanical composition and adsorptive complex of the solonetz soil. Savremena poljoprivreda,[Contemporary Agriculture] 54( 3-4), 47-51
BELI , M., LJ.NEŠI , M. DIMITRIJEVI , S.PETROVI , B. PEJI (2006). Uticaj promena vodno fizi kih svojstava solonjeca primenom fosforgipsa na prinos i komponente prinosa pšenice [Effect of changes in water-physical properties of soil by applying the phosphogypsum on the yield and
yield components in wheat]. Monografija "Prirodne mineralne sirovine i mogu nosti njihove upotrebe u poljoprivrednoj proizvodnji i prehrambenoj industriji" [Monograph “The Natural Mineral Row Materials and Poossibilities of Theirs Application in Agricultural Production and
Food Industry”]. Savez poljoprivrednih inženjera i tehni ara Srbije [Union of Agricultural Engineers and Technicians of Serbia], Beograd [Belgrade], 165-178.
BOKAN, N., M. MALESEVI (2004). The planting density effect on wheat yield structure. Acta Agriculturae Serbica, IX, 18, 65-79
DIMITRIJEVI , M., S.PETROVI (2005). Genetika populacije - Adaptabilnost i stabilnost genotipa [Population Genetics – Adaptability and Stability]. Poljoprivredni fakultet [Faculty of Agriculture], Novi Sad, 56-63.
DIMITRIJEVI , M., S. PETROVI , N. MLADENOV, M. BELI , N. HRISTOV, B. BANJAC, M. VUKOSAVLJEV (2009). Phenotypic Reaction of Wheat Grown on Different Soil Type. Genetika, 41, 2, 169-177. KNEŽEVI, D., V. ZE EVI , N. UKI , D. DODIG (2008). Genetic and Fenotypic Variability of Grain Mass
per Spike of Winter Wheat Genotypes (Triticum aestivum L.). Kragujevac J. Sci., 30, 131-136 PETROVI, S., M., DIMITRIJEVI , M., BELI , B., BANJAC, and M. VUKOSAVLJEV, (2009). Spike Stability
Parameters in Wheat Grown on Solonetz Soil. Genetika, 41, 2, 199-205.
SABAGHNIA, N., S.H. SABAGHPOUR, and H. DEHGHANI (2008). The use of an AMMI model and its parameters to analyse yield stability in multi-environment trials. Jour. of Agric. Sci., 146,
571-581.
ZE EVI, V., J., BOŠKOVI , M., DIMITRIJEVI , S. PETROVI (2010). Genetic and Phenotypic Variability of Yield Components in Wheat (Triticum aestivum L.). Bulgarian Journal of Agricultural Science,
16 (4), 422-428.
ZOBEL, R.W., M.J., WRIGHT, H.G. GAUCH (1988). Statistical analysis of yield trial. Agron. Jour., 80, 388-393.
VARIJACIJA KOMPONENTI PRINOSA HLEBNE PŠENICE U STRESNIM USLOVIMA GAJENJA NA ALKALIZOVANOM ZEMLJIŠTU
Sofija PETROVI 1, Miodrag DIMITRIJEVI 1, Milivoj BELI 1,
Borislav BANJAC1,Mirjana VUKOSAVLJEV2, Jelena BOŠKOVI 3,
Veselinka ZE EVI 3, i Borivoj PEJI 1
1Departman za ratarstvo i povrtarstvo, Poljoprivredni fakultet, Univerzitet u Novom
Sadu, Srbija
2Fakultet za biofarming - Ba ka Topola, Univerzitet Megatrend, Beograd, Srbija
I z v o d
U radu su prikazani rezultati ogleda sa 11 sorti pšenice gajenih u stresnim uslovima, na alkalizovanom zemljištu. Ogled je postavljen na lokalitetu u Banatu, na tlu tipa solonjec, na prirodnom pašnjaku, kao kontrolnoj varijanti i sa merama popravke zemljišta uz primenu fosforgipsa, kao meliorativnog sredstva. Ispitana je fenotipska varijabilnost i interakcija genotip/spoljna sredina za broj i masu zrna po klasu, uz primenu AMMI modela, u tri vegetaciona perioda. Analizom dobijenih rezultata može da se primeti da su ispitane sorte razli ito reagovale na stresne uslove i na meliorativne mere. Na osnovu rezultata AMMI analize je uo ena zna ajnost izvora varijacije i sorte sa manjom GE interakcijom, kao i one koje su dobro reagovale na meliorativne mere.
Primljeno 20. IV. 2010.