RESEARCH ARTICLE
The Combined Effects of Obesity, Abdominal
Obesity and Major Depression/Anxiety on
Health-Related Quality of Life: the LifeLines
Cohort Study
Yeshambel T. Nigatu1*, Sijmen A. Reijneveld1, Peter de Jonge2, Elisabeth van Rossum3, Ute Bültmann1
1Department of Health Sciences, University Medical Center Groningen, University of Groningen, Groningen, The Netherlands,2Interdisciplinary Center Psychopathology and Emotion Regulation, Department of Psychiatry, University Medical Center Groningen, University of Groningen, Groningen, the Netherlands,3Department of Internal Medicine, Erasmus Medical Center, Rotterdam, the Netherlands
*y.t.nigatu@umcg.nl
Abstract
Background
Obesity and major depressive disorder (MDD)/anxiety disorders often co-occur and aggra-vate each other resulting in adverse health-related outcomes. As little is known about the potential effects of interaction between obesity and MDD and/or anxiety disorders on health-related quality of life (HR-QoL), this study was aimed at examining these combined effects.
Methods
We collected data among N = 89,332 participants from the LifeLines cohort study. We cate-gorized body weight using body mass index (kg/m2) as normal weight (18.5–24.99), over-weight (25–29.9), mild obesity (30–34.9) and moderate/severe obesity (35); we measured abdominal obesity using a waist circumference of102 and88 cm for males and females, respectively. MDD and anxiety disorders were diagnosed with the Mini-Inter-national Neuropsychiatric Interview. HR-QoL was assessed using the RAND-36 question-naire to compute physical and mental quality of life scores. We used binary logistic and linear regression analyses.
Results
The combined effect of obesity and MDD and/or anxiety disorders on physical QoL was larger than the sum of their separate effects; regression coefficients, B (95%-confidence interval, 95%-CI) were: - 1.32 (-1.75; -0.90). However, the combined effect of obesity and major depression alone on mental QoL was less than the additive effect. With increasing body weight participants report poorer physical QoL; when they also have MDD and/or
PLOS ONE | DOI:10.1371/journal.pone.0148871 February 11, 2016 1 / 15
OPEN ACCESS
Citation:Nigatu YT, Reijneveld SA, de Jonge P, van Rossum E, Bültmann U (2016) The Combined Effects of Obesity, Abdominal Obesity and Major Depression/ Anxiety on Health-Related Quality of Life: the LifeLines Cohort Study. PLoS ONE 11(2): e0148871. doi:10.1371/journal.pone.0148871
Editor:Andreas Stengel, Charité-Universitätsmedizin Berlin, Campus Benjamin Franklin, GERMANY
Received:April 24, 2015
Accepted:January 24, 2016
Published:February 11, 2016
Copyright:© 2016 Nigatu et al. This is an open access article distributed under the terms of the Creative Commons Attribution License, which permits unrestricted use, distribution, and reproduction in any medium, provided the original author and source are credited.
Data Availability Statement:The data catalogue of LifeLines is publicly accessible on (http://www. lifelines.net/). The LifeLines system allows access for reproducibility of the study results.
Funding:The authors have no support or funding to report.
anxiety disorders participants report even poorer physical QoL. In persons without MDD and/or anxiety disorders, obesity was associated with a better mental QoL.
Conclusions
Obesity and MDD and/or anxiety disorders act synergistically on physical and mental QoL. The management of MDD and/or anxiety disorders and weight loss may be important routes to improve HR-QoL.
Introduction
Obesity, major depressive disorder (MDD) and anxiety disorders are major public health prob-lems, posing enormous challenges for the decades to come [1,2]. Obesity and MDD and/or anxiety disorders are associated with long-term disability, morbidity and mortality, and enor-mous economic costs [3–5]. Since the 1980s the prevalence of obesity has tripled in many countries of the World Health Organization (WHO) European Region, and continues to rise at an alarming rate. The rate of MDD and/or anxiety disorders has also increased in the past decade. For instance, in the UK, the incidence of depressive symptoms rose threefold from the baseline of 5.11/1000 person years in 1996 to 15.5/1000 person years in 2006 [4,6]. MDD is even expected to be one of the top leading causes of disability-adjusted life years in 2030 [7]. Obesity and MDD and/or anxiety have become the most serious health risks today, and are associated with major chronic diseases such as cardiovascular diseases, type 2 diabetes, ortho-pedic problems and certain kinds of cancer [8,9].
Co-occurrence of chronic physical conditions with MDD and/or anxiety disorders may have even worse consequences, including a poorer health-related quality of life (HR-QoL) [10]. HR-QoL has gained increasing interest as an outcome measure in clinical practice and public health settings [11]. Alley et al showed that obesity is associated with poor QoL, especially due to its earlier age of onset and long-term exposure [12]. MDD and/or anxiety disorders are also associated with significant reductions in HR-QoL [4]. During a depressive episode, a patient’s level of HR-QoL is the same as that of as a patient with a severe stroke [13].
The interaction between obesity and MDD and/or anxiety disorders on HR-QoL can best be measured by statistical interaction on the additive scale as opposed to conventional interac-tion [21]. On the one hand, knowledge on interacinterac-tion effects on the additive scale could pro-vide empirical epro-vidence for public health interventions in vulnerable groups; on the other hand, knowledge on interactions on the multiplicative scale is more relevant in disease etiology [22]. The present study focuses essentially on interaction on the additive scale (i.e. comparing the sum of separate effects of obesity and MDD and/or anxiety versus the combined effect). It is very important to be aware of a slight arbitrariness of interaction on the additive scale from the conventional interaction in terms of defining, detecting and interpreting the interaction effect, particularly for continuous outcomes. In conventional interaction, for instance, it is assumed in advance that obesity modifies the effect of MDD and/or anxiety on poor HR-QoL (i.e. unidirectional). In contrast, the interaction on the additive scale concept considers the potential bidirectional interaction effect of obesity and MDD and/or anxiety on poor HR-QoL, because obesity and MDD and/or anxiety do not precede each other. For instance, if the com-bined effect of obesity and MDD and/or anxiety disorders surpasses the sum of their separate effects, then intervening on obesity might also reduce the effect of MDD and/or anxiety disor-ders on poor HR-QoL and vice versa.
Therefore, the aim of this study was to examine the combined effect of obesity and MDD and/or anxiety disorders on HR-QoL and to determine whether the effect of obesity on HR-QoL further increases in persons with and without MDD and/or anxiety disorders. Inter-action on the additive scale was used as a measure to test the hypothesis that the combined effect of obesity and MDD and/or anxiety disorders on HR-QoL was larger than the sum of the separate effects.
Material and Methods
Study design and population
Data were collected in the ongoing LifeLines Cohort Study, a multi-disciplinary prospective population-based cohort study examining in a unique three-generation design the health and health-related behaviors of 167,729 persons living in the north of The Netherlands. The study employs a broad range of investigative procedures to assess the biomedical, socio-demographic, behavioral, physical and psychological factors which contribute to the health and disease of the general population, with a special focus on multi-morbidity and complex genetics. The design of the LifeLines cohort study has been described elsewhere [23]. For the study, we included N = 89,332 persons, who were enrolled between November 2006 and June 2013. Inclusion cri-teria for the present study were: age 18 years and older, psychiatric diagnosis, anthropometric measurements, and complete data on HR-QoL.
The LifeLines study protocol was approved by the Ethical Review Board of the University Medical Center Groningen. After receiving full verbal and written information about the study, all participants gave written informed consent. The study was conducted in accordance with the Declaration of Helsinki.
Measurements
General and abdominal obesity. General obesity was assessed using the body mass index (BMI). The BMI was calculated from measured body weight (kg) and height (m). Participants were classified into four BMI classes according to the standard international classification of the World Health Organization (WHO): normal weight (BMI: 18.5–24.99 kg/m2), overweight (BMI 25.0–29.99 kg/m2), mild obesity (BMI 30.0–34.99 kg/m2) and moderate/severe obesity (BMI35.0 kg/m2). Abdominal obesity was defined using objectively measured waist
Obesity, Major Depression/Anxiety and Quality of Life
circumference (WC) of102 cm and88 cm for males and females, respectively [24]. We included abdominal obesity because BMI has been criticized for its inadequate reflection of body composition and we wanted to make our analyses robust. Anthropometric measurements were conducted by nurses during a visit at the LifeLines test location.
Major depressive disorders (MDD) and anxiety disorders. MDD and anxiety disorders (generalized anxiety disorder (GAD), social phobia, panic and agoraphobia) were assessed by using the Mini-International Neuropsychiatric Interview (MINI) [25]. The MINI is a short structured diagnostic interview. It is compatible with international diagnostic criteria, includ-ing the International Classification of Diseases (ICD-10) and the fourth edition of the Diagnos-tic and StatisDiagnos-tical Manual of Mental Disorders (DSM-IV) [25]. The MINI was designed to meet the need for a short (15 minutes) but accurate structured psychiatric interview for epidemio-logical studies. The MINI has an excellent inter-rater reliability (Kappa, k>90), and high
retest reliability (k = 0.87 for MDD, k = 0.78 for anxiety disorders) [25]. The MINI interview was conducted by trained interviewers.
Health-related quality of Life (HR-QoL). HR-QoL was assessed by the RAND-36 ques-tionnaire. The RAND-36 is a generic and widely used measure of HR-QoL, designed for use in clinical practice and research, health policy evaluations, and general population surveys [19]. It has been adapted for use in various countries, including the Netherlands [26,27]. The question-naire covers eight dimensions: Physical Functioning, Role Limitations due to Physical Func-tioning (Role-Physical), Bodily Pain, General Health, Vitality, Social FuncFunc-tioning, Role Limitations due to Emotional Functioning (Role-Emotional), and Mental Health. Two sum-mary scores of QoL can be calculated: the physical component sumsum-mary (PCS) and the mental component summary (MCS) scores, reflecting physical and mental QoL, respectively. These summary scores provide information on the patient’s physical and mental QoL in just two val-ues, thereby reducing the number of statistical analyses needed and offering easier interpreta-tion of the data [28]. The PCS- and MCS-scores have good discriminant validity for identifying differences between clinically meaningful groups [29]. The eight domains and two summary scores range from 0 to 100, with higher scores indicating better HR-QoL. PCS- and MCS-scores were computed by using recommended scoring algorithms[30], and standardized by linear z-score transformation to have a mean of 50 and standard deviations of 10 in the US gen-eral population.
Statistical analyses
First, we described participants’sociodemographics, lifestyle factors, psychopathology and chronic conditions as frequencies, means and standard deviations, using the four BMI catego-ries and abdominal obesity status. The associations of BMI categocatego-ries and abdominal obesity with MDD and/or anxiety disorders were assessed using binary logistic regression.
Second, we assessed the average deviation in HR-QoL scores for overweight, obese (mild to moderate or severe) persons compared to normal weight persons by MDD and/or anxiety dis-orders status using one-way analysis of variance (ANOVA). Third, we examined the combined effect of obesity and MDD and/or anxiety disorders on physical and mental QoL. We assessed the presence of interactions by testing the significance of the increment in squared multiple correlation (ΔR2) by including the product terms (overweight/obesity x MDD and/or anxiety disorders) in the model adjusted for obesity and MDD and/or anxiety disorders, and also by testing whether the coefficient for the product terms differs from 0 [33]. The regression coeffi-cient of the product term (β) reflects interaction as departure from additivity and is the abso-lute value difference between the combined effect and the separate effects of obesity and MDD and/or anxiety disorders on physical and mental QoL [21]. The combined effect of obesity and MDD and/or anxiety disorders on physical or mental QoL as measured on a continuous scale is given by the sum of the separate effects of obesity, MDD and/or anxiety disorders and the product term. A synergistic effect of obesity and MD/anxiety on physical and mental QoL is reflected as B<0, while B>0 represents a negative interaction (antagonistic) of obesity and
MDD and/or anxiety disorders on physical and mental QoL:B = 0 represents no interaction effect of obesity and MDD and/or anxiety disorders on physical and mental QoL.
Fourth, using linear regression models, we examined the association of BMI categories with physical and mental QoL in persons with and without MDD and/or anxiety disorders. In these analyses, we tested four different models of general and abdominal obesity to adjust for other variables potentially affecting the associations of obesity and/or MDD and/or anxiety disorders with physical and mental QoL. Model 1 tested the crude association of overweight and obesity categories with physical and mental QoL compared to normal weight category, and stratified by MDD and/or anxiety disorders status. Model 2 adjusted additionally for socio-demographic factors (i.e. age, sex and education). In Model 3, lifestyle factors (i.e. physical exercise, smoking and alcohol) were added, and Model 4 contained all variables from Model 3 plus major chronic conditions (i.e. cardiovascular diseases, hypertension, diabetes, rheumatoid arthritis and cancer).
All analyses were performed using SPSS statistical software (SPSS version 22.0), a two-sided p<0.05 was considered statistically significant.
Results
Sample characteristics
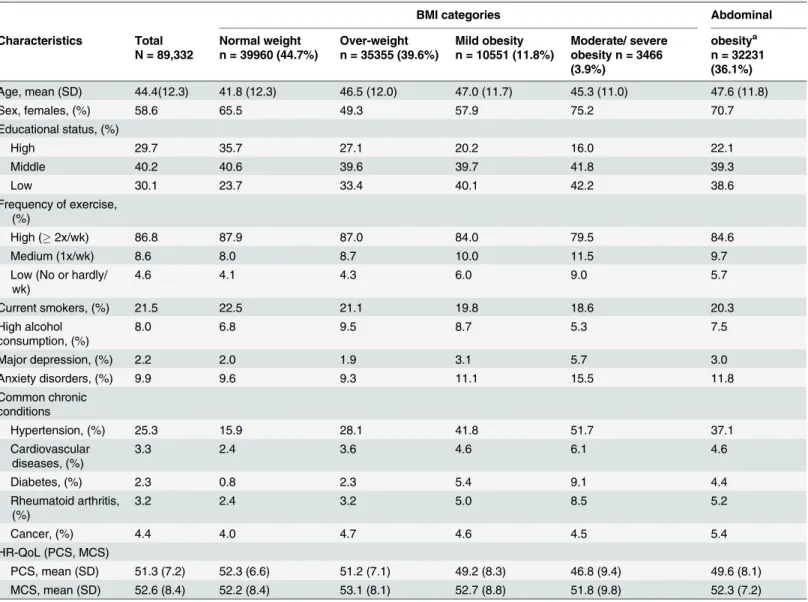
Table 1shows the characteristics of participants (N = 89,332) by BMI categories and abdomi-nal obesity status. The prevalences of overweight, mild obesity, moderate/severe obesity and abdominal obesity were 40%, 12%, 4% and 36%, respectively, and of MDD and/or anxiety dis-orders was 11%. In addition, mild, moderate/severe and abdominal obesity were associated with MDD and/or anxiety disorders (odds ratio, OR (95% confidence interval, CI): = 1.20 (1.12; 1.28), 1.81 (1.65; 1.99) and 1.40 (1.34; 1.46)), respectively. Overweight was not associated with MDD/anxiety disorders OR = 0.96 (0.91; 1.01).
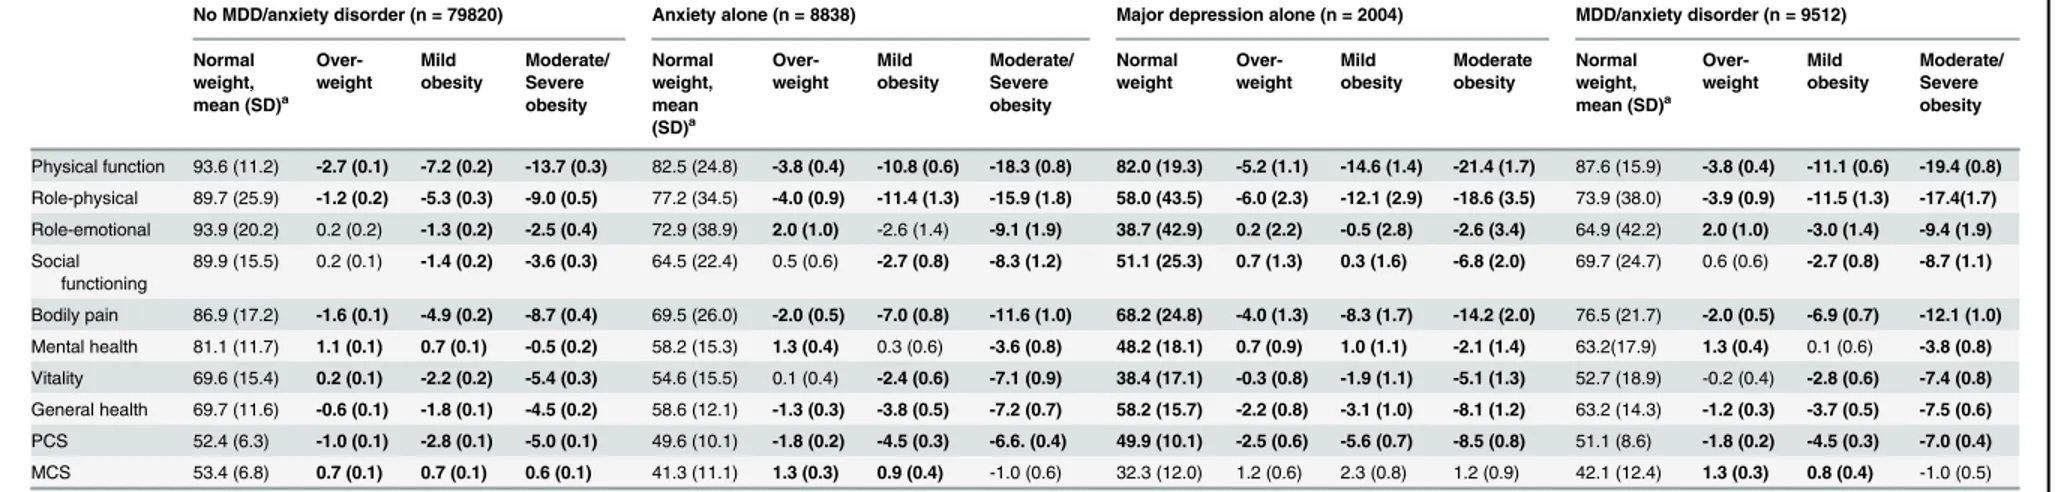
InTable 2we present the average deviation in HR-QoL domains in participants with obesity and MDD and/or anxiety disorders compared with normal weight counterparts. On all
Obesity, Major Depression/Anxiety and Quality of Life
physical health measures and health perceptions overweight and obese persons had a signifi-cantly poorer HR-QoL than normal weight persons (Table 2). However, overweight and nor-mal weight participants showed no difference in psychosocial aspects of HR-QoL (social functioning and emotional role) (p<0.01).
The combined effect of obesity and MDD and/or anxiety disorders on
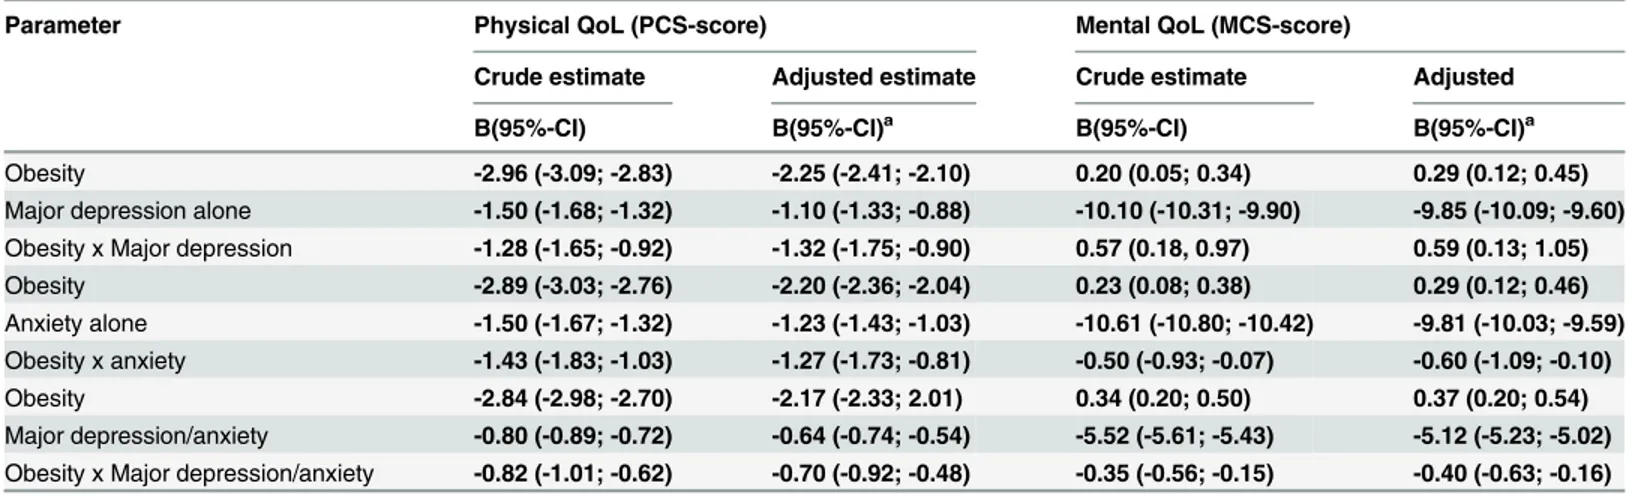
HR-QoL
Table 3shows the interaction of obesity and major depression/anxiety with physical and men-tal quality of life, which is the main finding of this study. We found that the combined effect of obesity and MDD and anxiety on physical QoL was (B = -1.32, 95%CI: -1.75; -0.90 and B = -1.27, 95%CI: -1.73; -0.81, respectively (Table 3). The interaction effect sizes of B = -1.32 Table 1. LifeLines cohort characteristics by BMI categories and abdominal obesity.
BMI categories Abdominal
Characteristics Total
N = 89,332
Normal weight n = 39960 (44.7%)
Over-weight n = 35355 (39.6%)
Mild obesity n = 10551 (11.8%)
Moderate/ severe obesity n = 3466 (3.9%)
obesitya n = 32231 (36.1%)
Age, mean (SD) 44.4(12.3) 41.8 (12.3) 46.5 (12.0) 47.0 (11.7) 45.3 (11.0) 47.6 (11.8)
Sex, females, (%) 58.6 65.5 49.3 57.9 75.2 70.7
Educational status, (%)
High 29.7 35.7 27.1 20.2 16.0 22.1
Middle 40.2 40.6 39.6 39.7 41.8 39.3
Low 30.1 23.7 33.4 40.1 42.2 38.6
Frequency of exercise, (%)
High (2x/wk) 86.8 87.9 87.0 84.0 79.5 84.6
Medium (1x/wk) 8.6 8.0 8.7 10.0 11.5 9.7
Low (No or hardly/ wk)
4.6 4.1 4.3 6.0 9.0 5.7
Current smokers, (%) 21.5 22.5 21.1 19.8 18.6 20.3
High alcohol consumption, (%)
8.0 6.8 9.5 8.7 5.3 7.5
Major depression, (%) 2.2 2.0 1.9 3.1 5.7 3.0
Anxiety disorders, (%) 9.9 9.6 9.3 11.1 15.5 11.8
Common chronic conditions
Hypertension, (%) 25.3 15.9 28.1 41.8 51.7 37.1
Cardiovascular diseases, (%)
3.3 2.4 3.6 4.6 6.1 4.6
Diabetes, (%) 2.3 0.8 2.3 5.4 9.1 4.4
Rheumatoid arthritis, (%)
3.2 2.4 3.2 5.0 8.5 5.2
Cancer, (%) 4.4 4.0 4.7 4.6 4.5 5.4
HR-QoL (PCS, MCS)
PCS, mean (SD) 51.3 (7.2) 52.3 (6.6) 51.2 (7.1) 49.2 (8.3) 46.8 (9.4) 49.6 (8.1)
MCS, mean (SD) 52.6 (8.4) 52.2 (8.4) 53.1 (8.1) 52.7 (8.8) 51.8 (9.8) 52.3 (7.2)
HR-QoL: Health-related quality of life; PCS: physical component summary score; MCS: mental component summary score; Normal weight (BMI: 18.5–
24.99 kg/m2), overweight (BMI 25.0–29.99 kg/m2), mild obesity (BMI 30.0–34.99 kg/m2) and moderate/severe obesity (BMI35.0 kg/m2)
aWaist circumference (WC)102 cm for males and88cm for females.
Table 2. Health-related quality of life (HR-QoL) domains in participants by BMI categories and MDD and/or anxiety disorders: deviation with standard error from the mean for normal weight participants.
No MDD/anxiety disorder (n = 79820) Anxiety alone (n = 8838) Major depression alone (n = 2004) MDD/anxiety disorder (n = 9512)
Normal weight, mean (SD)a
Over-weight
Mild obesity
Moderate/ Severe obesity
Normal weight, mean (SD)a
Over-weight
Mild obesity
Moderate/ Severe obesity
Normal weight
Over-weight
Mild obesity
Moderate obesity
Normal weight, mean (SD)a
Over-weight
Mild obesity
Moderate/ Severe obesity
Physical function 93.6 (11.2) -2.7 (0.1) -7.2 (0.2) -13.7 (0.3) 82.5 (24.8) -3.8 (0.4) -10.8 (0.6) -18.3 (0.8) 82.0 (19.3) -5.2 (1.1) -14.6 (1.4) -21.4 (1.7) 87.6 (15.9) -3.8 (0.4) -11.1 (0.6) -19.4 (0.8)
Role-physical 89.7 (25.9) -1.2 (0.2) -5.3 (0.3) -9.0 (0.5) 77.2 (34.5) -4.0 (0.9) -11.4 (1.3) -15.9 (1.8) 58.0 (43.5) -6.0 (2.3) -12.1 (2.9) -18.6 (3.5) 73.9 (38.0) -3.9 (0.9) -11.5 (1.3) -17.4(1.7)
Role-emotional 93.9 (20.2) 0.2 (0.2) -1.3 (0.2) -2.5 (0.4) 72.9 (38.9) 2.0 (1.0) -2.6 (1.4) -9.1 (1.9) 38.7 (42.9) 0.2 (2.2) -0.5 (2.8) -2.6 (3.4) 64.9 (42.2) 2.0 (1.0) -3.0 (1.4) -9.4 (1.9)
Social functioning
89.9 (15.5) 0.2 (0.1) -1.4 (0.2) -3.6 (0.3) 64.5 (22.4) 0.5 (0.6) -2.7 (0.8) -8.3 (1.2) 51.1 (25.3) 0.7 (1.3) 0.3 (1.6) -6.8 (2.0) 69.7 (24.7) 0.6 (0.6) -2.7 (0.8) -8.7 (1.1)
Bodily pain 86.9 (17.2) -1.6 (0.1) -4.9 (0.2) -8.7 (0.4) 69.5 (26.0) -2.0 (0.5) -7.0 (0.8) -11.6 (1.0) 68.2 (24.8) -4.0 (1.3) -8.3 (1.7) -14.2 (2.0) 76.5 (21.7) -2.0 (0.5) -6.9 (0.7) -12.1 (1.0)
Mental health 81.1 (11.7) 1.1 (0.1) 0.7 (0.1) -0.5 (0.2) 58.2 (15.3) 1.3 (0.4) 0.3 (0.6) -3.6 (0.8) 48.2 (18.1) 0.7 (0.9) 1.0 (1.1) -2.1 (1.4) 63.2(17.9) 1.3 (0.4) 0.1 (0.6) -3.8 (0.8)
Vitality 69.6 (15.4) 0.2 (0.1) -2.2 (0.2) -5.4 (0.3) 54.6 (15.5) 0.1 (0.4) -2.4 (0.6) -7.1 (0.9) 38.4 (17.1) -0.3 (0.8) -1.9 (1.1) -5.1 (1.3) 52.7 (18.9) -0.2 (0.4) -2.8 (0.6) -7.4 (0.8)
General health 69.7 (11.6) -0.6 (0.1) -1.8 (0.1) -4.5 (0.2) 58.6 (12.1) -1.3 (0.3) -3.8 (0.5) -7.2 (0.7) 58.2 (15.7) -2.2 (0.8) -3.1 (1.0) -8.1 (1.2) 63.2 (14.3) -1.2 (0.3) -3.7 (0.5) -7.5 (0.6)
PCS 52.4 (6.3) -1.0 (0.1) -2.8 (0.1) -5.0 (0.1) 49.6 (10.1) -1.8 (0.2) -4.5 (0.3) -6.6. (0.4) 49.9 (10.1) -2.5 (0.6) -5.6 (0.7) -8.5 (0.8) 51.1 (8.6) -1.8 (0.2) -4.5 (0.3) -7.0 (0.4)
MCS 53.4 (6.8) 0.7 (0.1) 0.7 (0.1) 0.6 (0.1) 41.3 (11.1) 1.3 (0.3) 0.9 (0.4) -1.0 (0.6) 32.3 (12.0) 1.2 (0.6) 2.3 (0.8) 1.2 (0.9) 42.1 (12.4) 1.3 (0.3) 0.8 (0.4) -1.0 (0.5)
aReference group
SD: standard deviation; MDD: major depressive disorder; HR-QoL: Health related quality of life; PCS: physical component summary score; MCS: Mental component summary score; Normal weight (BMI: 18.5–24.99kg/m2), overweight (BMI 25.0–29.99 kg/m2), mild obesity (BMI 30.0–34.99 kg/m2) and moderate/severe obesity (BMI35.0 kg/m2);Boldfiguresreflect statistically significant deviations from the mean for normal weight participants (p<0.05).
doi:10.1371/journal.pone.0148871.t002
Obesity,
Major
Depression
/Anxiety
and
Quality
of
Life
PLOS
ONE
|DOI:10.137
1/journal.p
one.0148871
February
11,
2016
7/1
indicated that the combined effect of obesity and MDD and/or anxiety disorders on physical QoL was greater than the additive effect. However, the combined effect of obesity and major depression alone on mental QoL was less than the additive effect (Table 3).
Furthermore, our stratified analysis revealed a significant association of physical QoL across BMI categories and abdominal obesity in depressed and anxious individuals (Table 4). How-ever, the association of obesity and mental QoL was not statistically significant in depressed and anxious individuals in the general population. In non-depressed and anxious individuals, obesity was significantly associated with better mental QoL (Table 5).
Discussion
In this large, representative cohort study, we found that the combined effects of obesity and MDD and/or anxiety disorders on physical and mental QoL were greater than the sum of their separate effects. Moreover, general and abdominal obesity were significantly associated with a poorer physical QoL in persons with and without MDD and/or anxiety disorders after adjust-ment for potential confounders. General and abdominal obesity were found to be associated with better mental QoL in persons without MDD/anxiety disorders. This association was not found in persons with MDD/anxiety disorders after adjustment for potential confounders.
The combined effect of obesity and MDD and/or anxiety disorders on physical QoL was sig-nificantly larger than the sum of their estimated separate effects. As indicated in the interaction model, the average physical QoL for obese persons (BMI30) with MDD was 4.46 points lower than that of non-obese non-depressed persons. With sufficient-cause interaction in mind, obesity and MDD and/or anxiety disorders are component causes that act in concert and are associated with poor physical QoL. Obesity may interact with MDD and/or anxiety dis-orders, whereby each augmenting the effect of the other on physical QoL. Although this finding is based on cross-sectional data, it seems plausible because obesity shares genetic and complex biologic etiologic substrates with MDD and/or anxiety disorders [14,20,34]. Although the pres-ence of inflammatory responses and the crucial role of cytokines have been established more Table 3. The separate association of obesity, major depression/anxiety and their interactions with physical and mental quality of life.
Parameter Physical QoL (PCS-score) Mental QoL (MCS-score)
Crude estimate Adjusted estimate Crude estimate Adjusted
B(95%-CI) B(95%-CI)a B(95%-CI) B(95%-CI)a
Obesity -2.96 (-3.09; -2.83) -2.25 (-2.41; -2.10) 0.20 (0.05; 0.34) 0.29 (0.12; 0.45)
Major depression alone -1.50 (-1.68; -1.32) -1.10 (-1.33; -0.88) -10.10 (-10.31; -9.90) -9.85 (-10.09; -9.60)
Obesity x Major depression -1.28 (-1.65; -0.92) -1.32 (-1.75; -0.90) 0.57 (0.18, 0.97) 0.59 (0.13; 1.05)
Obesity -2.89 (-3.03; -2.76) -2.20 (-2.36; -2.04) 0.23 (0.08; 0.38) 0.29 (0.12; 0.46)
Anxiety alone -1.50 (-1.67; -1.32) -1.23 (-1.43; -1.03) -10.61 (-10.80; -10.42) -9.81 (-10.03; -9.59)
Obesity x anxiety -1.43 (-1.83; -1.03) -1.27 (-1.73; -0.81) -0.50 (-0.93; -0.07) -0.60 (-1.09; -0.10)
Obesity -2.84 (-2.98; -2.70) -2.17 (-2.33; 2.01) 0.34 (0.20; 0.50) 0.37 (0.20; 0.54)
Major depression/anxiety -0.80 (-0.89; -0.72) -0.64 (-0.74; -0.54) -5.52 (-5.61; -5.43) -5.12 (-5.23; -5.02)
Obesity x Major depression/anxiety -0.82 (-1.01; -0.62) -0.70 (-0.92; -0.48) -0.35 (-0.56; -0.15) -0.40 (-0.63; -0.16)
Abbreviations: PCS: physical component summary score; MCS: Mental component summary score; Obesity (BMI30.0 kg/m2) compared to non-obese.
aAdjusted for age, sex, educational status, smoking, exercise, alcohol consumption and major chronic conditions (i.e. cardiovascular diseases,
hypertension, diabetes, rheumatoid arthritis and cancer). For instance, the combined effect of obesity and major depression on PCS-score was = -2.96–
1.50–1.28 = -5.74, while the sum of individual effects of obesity and major depression/anxiety assuming no interaction was = -2.96–1.50 = -4.46. The departure from additivity is given by = -5.74- (-4.46) = -1.28, by definition, the regression coefficient of the product term.
for depression than for anxiety [35], the joint presence of MDD/anxiety disorders and obesity can contribute to morbidity and poorer physical conditions [14,20,36]. In addition, subtypes of both obesity and MDD and/or anxiety disorders are assumed to be related to stress, which is characterized by endogenous overproduction of adrenocorticotrophin (ACTH) and cortisol [37] This chronic hypercortisolism induces (abdominal) obesity and depressive symptoms, and severely reduced HR-QoL, conditions which are all known to improve in the majority of patients after treating the disease by surgery or medication [37]. Hence, the current study shows that joint exposure of obesity and MDD and/or anxiety disorders decreases physical Table 4. Crude and adjusted regression coefficients (B) for physical quality of life with general and abdominal obesity categories, stratified by major depression/anxiety.
Mental disorder and body weight N (%) Physical component summary score of HR-QoL
Model 1 Model 2 Model 3 Model 4
B (95%-CI) B (95%-CI) B (95%-CI) B (95%-CI)
No major depression/anxiety (n = 79,820)
Normal weight 35854 (44.9) Reference Reference Reference Reference
Overweight 31833 (39.9) -1.07 (-1.19; -0.95) -0.74 (-0.86; -0.61) -0.73 (-0.85; -0.60) -0.64 (-0.76; -0.52)
Mild obesity 9266 (11.6) -2.87 (-3.05; -2.69) -2.37 (-2.55; -2.19) -2.34 (-2.52; -2.16) -1.87 (-2.05; -1.70)
Moderate/severe obesity 2867 (3.6) -5.05 (-5.35; -4.75) -4.49 (-4.79; -4.19) -4.44 (-4.73; -4.14) -3.55 (-3.84; -3.26)
No abdominal obesity 51708 (64.8) Reference Reference Reference Reference
Abdominal obesity 28112 (35.0) -2.36 (-2.48; -2.25) -1.75 (-1.87; -1.64) -1.72 (-1.84; -1.60) -1.37 (-1.49; -1.26)
Anxiety alone (n = 8838)
Normal weight 3832 (43.4) Reference Reference Reference Reference
Overweight 3298 (37.3) -1.90 (-1.94; -0.94) -1.44 (-1.94; -0.94) -1.44 (-1.94; -0.94) -1.29 (-1.79, -0.78)
Mild obesity 1172 (13.3) -4.37 (-4.34; -2.95) -3.65 (-4.34; -2.95) -3.65 (-4.35; -2.95) -3.20 (-3.90; -2.49)
Moderate/severe obesity 536 (6.1) -6.68 (-6.97; -5.07) -6.03 (-6.97; -5.07) -5.94 (-6.89; -4.99) -5.30 (-6.27; -4.33)
No abdominal obesity 5047 (57.1) Reference Reference Reference Reference
Abdominal obesity 3791 (42.9) -3.32 (-3.77; -2.87) -2.59 (-3.06; -2.13) -2.57 (-3.03; -2.11) -2.19 (-2.66; -1.72)
Major depression alone (n = 2004)
Normal weight 808 (40.3) Reference Reference Reference Reference
Overweight 673 (33.6) -2.21 (-3.54; -0.88) -1.61 (-2.95; -0.27) -1.64 (-2.98; -0.30) -1.50 (2.84; -0.15)
Mild obesity 326 (16.3) -5.69 (-7.34; -4.05) -4.92 (-6.57; -3.27) -4.89 (-6.54; -3.23) -4.60 (-6.29; -2.91)
Moderate/severe obesity 197 (9.8) -8.07 (-10.01; -6.13) -7.47 (-9.40; -5.53) -7.36 (-9.29; -5.42) -6.88 (-8.88; -4.89)
No abdominal obesity 1050 (52.4) Reference Reference Reference Reference
Abdominal obesity 954 (47.6) -4.31 (-5.45; -3.16) -3.75 (-4.92; -2.58) -3.74 (-4.91; -2.56) -3.33 (-4.54; -2.12)
Major depression/anxiety (n = 9,512)
Normal weight 4106 (43.2) Reference Reference Reference Reference
Overweight 3522 (37.0) -1.87 (-2.36; -1.38) -1.40 (-1.89; -0.90) -1.40 (-1.89; -0.91) -1.24 (-1.74; -0.75)
Mild obesity 1285 (13.5) -4.35 (-5.02; -3.67) -3.64 (-4.32; -2.97) -3.62 (-4.30; -2.95) -3.15 (-3.84; -2.47)
Moderate/severe obesity 599 (6.3) -6.97(-7.89; -6.05) -6.30 (-7.21; -5.39) -6.20 (-7.11; -5.28) -5.53 (-6.46; -4.60)
No abdominal obesity 5393 (56.7) Reference Reference Reference Reference
Abdominal obesity 4119 (43.3) -3.39 (-3.84; -2.23) -2.68 (-3.13; -2.23) -2.64 (-3.09; -2.19) -1.99 (-2.43; -1.56)
Abbreviations: HR-QoL: Health related quality of life; Normal weight (BMI: 18.5–24.99 kg/m2), overweight (BMI 25.0–29.99 kg/m2), mild obesity (BMI 30.0–34.99 kg/m2) and moderate/severe obesity (BMI35.0 kg/m2); B; regression coefficient; 95%-CI: 95%-confidence interval; Model 1: Crude estimate; Model 2: Model 1 plus sociodemographic factors (i.e. Age, sex, educational status); Model 3: Model 2 plus lifestyle factors (i.e. smoking, exercise, alcohol consumption); Model 4: Model 3 plus major chronic conditions (i.e. cardiovascular diseases, hypertension, diabetes, rheumatoid arthritis and cancer);Boldfiguresreflect statistically significant estimates (p<0.05).
doi:10.1371/journal.pone.0148871.t004
Obesity, Major Depression/Anxiety and Quality of Life
QoL, and the joint association of obesity and MDD and/or anxiety disorders is greater than the additive effect.
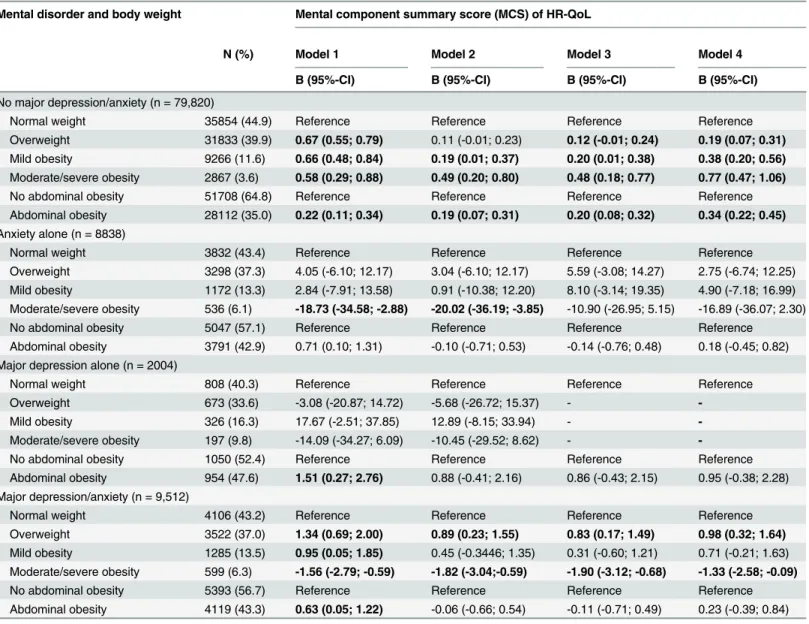
The combined effect of obesity and MDD/anxiety disorders on mental QoL was also signifi-cantly greater than the sum of their separate effects. The interaction model indicates that mean mental QoL scores were 5.52 points lower in obese persons (BMI30) with MDD/anxiety dis-orders than in those without such disdis-orders. This underlines the findings of Atlantis et al [38], who reported mean mental QoL scores of 39% to 43% points lower in all BMI groups with MDD compared to groups with normal weight and without MDD. Although the excess Table 5. Crude and adjusted regression coefficients (B) for mental quality of life with general and abdominal obesity categories stratified by major depression/anxiety.
Mental disorder and body weight Mental component summary score (MCS) of HR-QoL
N (%) Model 1 Model 2 Model 3 Model 4
B (95%-CI) B (95%-CI) B (95%-CI) B (95%-CI)
No major depression/anxiety (n = 79,820)
Normal weight 35854 (44.9) Reference Reference Reference Reference
Overweight 31833 (39.9) 0.67 (0.55; 0.79) 0.11 (-0.01; 0.23) 0.12 (-0.01; 0.24) 0.19 (0.07; 0.31)
Mild obesity 9266 (11.6) 0.66 (0.48; 0.84) 0.19 (0.01; 0.37) 0.20 (0.01; 0.38) 0.38 (0.20; 0.56)
Moderate/severe obesity 2867 (3.6) 0.58 (0.29; 0.88) 0.49 (0.20; 0.80) 0.48 (0.18; 0.77) 0.77 (0.47; 1.06)
No abdominal obesity 51708 (64.8) Reference Reference Reference Reference
Abdominal obesity 28112 (35.0) 0.22 (0.11; 0.34) 0.19 (0.07; 0.31) 0.20 (0.08; 0.32) 0.34 (0.22; 0.45)
Anxiety alone (n = 8838)
Normal weight 3832 (43.4) Reference Reference Reference Reference
Overweight 3298 (37.3) 4.05 (-6.10; 12.17) 3.04 (-6.10; 12.17) 5.59 (-3.08; 14.27) 2.75 (-6.74; 12.25) Mild obesity 1172 (13.3) 2.84 (-7.91; 13.58) 0.91 (-10.38; 12.20) 8.10 (-3.14; 19.35) 4.90 (-7.18; 16.99) Moderate/severe obesity 536 (6.1) -18.73 (-34.58; -2.88) -20.02 (-36.19; -3.85) -10.90 (-26.95; 5.15) -16.89 (-36.07; 2.30)
No abdominal obesity 5047 (57.1) Reference Reference Reference Reference
Abdominal obesity 3791 (42.9) 0.71 (0.10; 1.31) -0.10 (-0.71; 0.53) -0.14 (-0.76; 0.48) 0.18 (-0.45; 0.82) Major depression alone (n = 2004)
Normal weight 808 (40.3) Reference Reference Reference Reference
Overweight 673 (33.6) -3.08 (-20.87; 14.72) -5.68 (-26.72; 15.37) -
-Mild obesity 326 (16.3) 17.67 (-2.51; 37.85) 12.89 (-8.15; 33.94) -
-Moderate/severe obesity 197 (9.8) -14.09 (-34.27; 6.09) -10.45 (-29.52; 8.62) -
-No abdominal obesity 1050 (52.4) Reference Reference Reference Reference
Abdominal obesity 954 (47.6) 1.51 (0.27; 2.76) 0.88 (-0.41; 2.16) 0.86 (-0.43; 2.15) 0.95 (-0.38; 2.28) Major depression/anxiety (n = 9,512)
Normal weight 4106 (43.2) Reference Reference Reference Reference
Overweight 3522 (37.0) 1.34 (0.69; 2.00) 0.89 (0.23; 1.55) 0.83 (0.17; 1.49) 0.98 (0.32; 1.64)
Mild obesity 1285 (13.5) 0.95 (0.05; 1.85) 0.45 (-0.3446; 1.35) 0.31 (-0.60; 1.21) 0.71 (-0.21; 1.63) Moderate/severe obesity 599 (6.3) -1.56 (-2.79; -0.59) -1.82 (-3.04;-0.59) -1.90 (-3.12; -0.68) -1.33 (-2.58; -0.09)
No abdominal obesity 5393 (56.7) Reference Reference Reference Reference
Abdominal obesity 4119 (43.3) 0.63 (0.05; 1.22) -0.06 (-0.66; 0.54) -0.11 (-0.71; 0.49) 0.23 (-0.39; 0.84)
Abbreviations: HR-QoL: Health related quality of life; Normal weight (BMI: 18.5–24.99kg/m2), overweight (BMI 25.0–29.99 kg/m2), mild obesity (BMI 30.0– 34.99 kg/m2) and moderate/severe obesity (BMI35.0 kg/m2); B; regression coefficient;95%-CI: 95%-confidence interval; Model 1: Crude estimate;
Model 2: Model 1 plus sociodemographic factors (i.e. Age, sex, educational status); Model 3: Model 2 plus lifestyle factors (i.e. smoking, exercise, alcohol consumption); Model 4: Model 3 plus major chronic conditions (i.e. cardiovascular diseases, hypertension, diabetes, rheumatoid arthritis and cancer);
Boldfiguresreflect Statistically significant estimates (p<0.05).
reduction of the mental QoL score is expected to be related to MDD/anxiety disorders, being obese may further decrease mental QoL. In Western societies, where being thin is considered attractive beauty, obesity might impact on an individual’s body image and self-esteem, and thus be a source of clinically significant distress or depression, thereby reducing the quality of life [39]. Hilbert et al have also shown that obese persons taking part in social activities face more stigma and prejudice than do obese persons [40].
Furthermore, multivariate analyses showed that general and abdominal obesity were consis-tently associated with a poorer physical QoL in persons both with and without MDD and/or anxiety disorders. This finding is in line with a systematic review and several other studies [17, 41–50], which found a robust relationship between overweight, obesity and poorer HR-QoL. The severity of obesity and treatment-seeking behavior might be underlying factors linking obesity and poor physical QoL [17]. Higher body weight and an excess of visceral fat are associ-ated with higher rates of health care utilization [17]. Persons who had sought treatment or tried to lose weight were significantly more impaired on physical measures (e.g. bodily pain, general health and vitality) of HR-QoL than those who did not try to lose weight [17]. As pre-sented in this study, the physical measures of HR-QoL showed significant linear reductions in obese persons, and the greatest decline (20 point lower) was observed in obese persons with MDD and/or anxiety disorders (Table 2). The effect of obesity on mental QoL seems reduced with increasing obesity in anxious individuals compared to depressed counterparts, but was not statically significant after adjustment of potential confounders (Table 2andTable 5). Therefore, all forms of obesity are associated with poorer physical QoL, and the associations may even be stronger in obese persons who also have MDD and/or anxiety disorders.
We did not find associations of general and abdominal obesity with mental QoL in persons with MDD and/or anxiety disorders. The associations were explained by lifestyle factors and chronic conditions. However, in persons without MDD and/or anxiety disorders, both general and abdominal obesity were significantly associated with a better mental QoL after adjustment for potential confounders. This finding contradicts those of Cameron et al [41] and Vetter et al [44], who found that BMI change was associated with a decrease in mental QoL. Laaksonen et al and Renzaho et al reported no association between obesity and mental QoL and other mental health domains [43,45]. Possible explanations for these discrepancies are differences in the assessment of MDD and anxiety disorders, the study population and confounding factors. Most of the previous studies used self-reported measures of MDD and/or anxiety disorders [37,43], while the present study used a psychiatric interview. In the previous studies, the poten-tial interactions between obesity and MDD and/or anxiety disorders were also not considered. Generally, mental health problems could be expected in obese persons because of the stigma associated with excess body weight, but some obese persons appear to have essentially normal psychosocial functioning. This might be due to several underlying factors, such as perceived body image, self-esteem, and the level of severity and persistence of depressive disorders in obese persons [39,43]. It could also be due to the generic instrument used to assess mental Qol, where the generic versions may not reflect the impact of weight related stigma and dis-crimination issues on mental QoL in obese persons. Taken together, these results indicate that the joint exposures of obesity and MDD and/or anxiety disorders are associated with poorer physical and mental QoL; obesity alone has no effect on mental QoL in the general population.
Strengths and limitations
The major strength of our study is the nature of the study population, which is derived from the general population and both large and well characterized. The sample size of N = 89,332 participants allowed us to perform subgroup analysis with different BMI categories and MDD
Obesity, Major Depression/Anxiety and Quality of Life
and/or anxiety disorders status. Moreover, a comprehensive assessment of chronic conditions, a psychiatric interview, and two anthropometry metrics, i.e. BMI and WC, were used. The sim-ilar results for BMI and WC suggest that our results are robust.
The main limitation of our study is its cross-sectional nature, i.e. inferences concerning the direction of the observed associations between obesity, MDD and/or anxiety disorders and HR-QoL cannot be made. Moreover, the use of the RAND-36 may be a limitation, as many researchers for its inadequate reflection of HR-QoL have criticized it. The RAND-36 may also not cover all essential health aspects pertinent to a particular disease. However, it does have the advantage of enabling HR-QoL comparisons across different diseases. It has been shown to have had a high degree of responsiveness to diseases, by which it discriminates between people in different categories of overweight and obesity, as presented here. Nevertheless, it is highly important to sue a multidimensional instrument embracing different health aspects that do not necessarily correlate to each other, such as obesity specific measures like the impact of weight on quality of life (IWQoL-Lite). Furthermore, misclassification may have occurred in the mea-surements of smoking and alcohol consumption, which were based on self-administered ques-tionnaires. However, earlier studies have showed that self-reported smoking status and alcohol consumption can be used with notable confidence and provide an estimate comparable to the actual consumption [32,49]. Finally, because data on the binge eating disorder (BED) was not available we were not able to analyse the potential role of this variable in the association of obe-sity and MDD and/or anxiety with poor HR-QoL. Further studies are needed to assess the potential role of BED.
Practical and policy implications
In this large, representative study, we showed that in the general population the combination of obesity and MDD and/or anxiety disorders is associated with a poor HR-QoL. This com-bined effect may have implications for prevention and public health measures if confirmed in prospective studies. The magnitude of the impact of obesity and MDD and/or anxiety disorders on a range of HR-QoL dimensions indicates that the successful management of depression in the primary care setting would result in a significant alleviation of suffering in obese adults. In light of this, the weight-increasing side effects of many commonly used antidepressants should also be considered. Where possible, a more restrained use of those antidepressants with the greatest weight stimulating effects would seem advisable, in particular for obese persons [50]. Several studies have shown that a weight loss program can lead to a significant reduction in depression scores [51]. Thus, monitoring depressive and anxiety symptoms is important in obese persons, and maintaining normal weight or reducing excess weight would be by far the best approach to improve the HR-QoL.
Conclusions
In conclusion, the combined effect of obesity and MDD and/or anxiety disorders on HR-QoL is greater than the sum of the separate effects of obesity and MDD and/or anxiety disorders on HR-QoL. Moreover, both general and abdominal obesity are associated with poor physical QoL. General and abdominal obesity without MDD and/or anxiety disorders are associated with better mental QoL. Longitudinal studies are needed to explore the causal pathways between obesity, MDD and/or anxiety disorders and HR-QoL.
Acknowledgments
Cohort Study (BRIF4568) is engaged in a Bioresource research impact factor (BRIF) policy pilot study, details of which can be found at https://www.bioshare.eu/content/bioresource-impact-factor. The data catalogue of LifeLines is publicly accessible onhttp://www.lifelines.net/ . The LifeLines system allows access for reproducibility of the study results.
Author Contributions
Conceived and designed the experiments: YTN SAR PD EVR UB. Performed the experiments: YTN SAR PD EV UB. Analyzed the data: YTN. Contributed reagents/materials/analysis tools: YTN SAR PD EVR UB. Wrote the paper: YTN SAR PD EVR UB. Approved the decision to publish: YTN SAR PD EVR UB.
References
1. Kelly T, Yang W, Chen CS, Reynolds K, He J. Global burden of obesity in 2005 and projections to 2030. Int J Obes (Lond) 2008; 32:1431–1437.
2. Kessler RC, Berglund P, Demler O, Jin R, Koretz D, Merikangas KR, et al. The epidemiology of major depressive disorder: results from the National Comorbidity Survey Replication (NCS-R). JAMA 2003; 289:3095–3105. PMID:12813115
3. Pi-Sunyer X. The medical risks of obesity. Postgrad Med 2009; 121:21–33. doi:10.3810/pgm.2009.11. 2074PMID:19940414
4. Sobocki P, Lekander I, Borgstrom F, Strom O, Runeson B. The economic burden of depression in Swe-den from 1997 to 2005. Eur Psychiatry 2007; 22:146–152. PMID:17194573
5. Muller-Riemenschneider F, Reinhold T, Berghofer A, Willich SN. Health-economic burden of obesity in Europe. Eur J Epidemiol 2008; 23:499–509. doi:10.1007/s10654-008-9239-1PMID:18509729 6. Rait G, Walters K, Griffin M, Buszewicz M, Petersen I, Nazareth I. Recent trends in the incidence of
recorded depression in primary care. Br J Psychiatry 2009; 195:520–524. doi:10.1192/bjp.bp.108.
058636PMID:19949202
7. Murray CJ, Lopez AD. Alternative projections of mortality and disability by cause 1990–2020: Global Burden of Disease Study. Lancet 1997; 349:1498–1504. PMID:9167458
8. Ghoorah K, Campbell P, Kent A, Maznyczka A, Kunadian V. Obesity and cardiovascular outcomes: a review. Eur Heart J Acute Cardiovasc Care 2014. doi:10.1177/2048872614523349
9. Kabadi SM, Lee BK, Liu L. Joint effects of obesity and vitamin D insufficiency on insulin resistance and type 2 diabetes: results from the NHANES 2001–2006. Diabetes Care 2012; 35:2048–2054. PMID:
22751957
10. Baune BT, Adrian I, Jacobi F. Medical disorders affect health outcome and general functioning depend-ing on comorbid major depression in the general population. J Psychosom Res 2007; 62:109–118. PMID:17270568
11. Soto M, Failde I, Marquez S, Benitez E, Ramos I, Barba A, et al. Physical and mental component sum-maries score of the SF-36 in coronary patients. Qual Life Res 2005; 14:759–768. PMID:16022068 12. Alley DE, Chang VW. The changing relationship of obesity and disability, 1988–2004. JAMA 2007;
298:2020–2027. PMID:17986695
13. Sobocki P, Ekman M, Agren H, Krakau I, Runeson B, Martensson B, et al. Health-related quality of life measured with EQ-5D in patients treated for depression in primary care. Value Health 2007; 10:153–
160. PMID:17391424
14. Afari N, Noonan C, Goldberg J, Roy-Byrne P, Schur E, Golnari G, et al. Depression and obesity: do shared genes explain the relationship? Depress Anxiety 2010; 27:799–806. doi:10.1002/da.20704
PMID:20821799
15. de Wit LM, Fokkema M, van Straten A, Lamers F, Cuijpers P, Penninx BW. Depressive and anxiety dis-orders and the association with obesity, physical, and social activities. Depress Anxiety 2010; 27:1057–1065. doi:10.1002/da.20738PMID:20734363
16. Luppino FS, de Wit LM, Bouvy PF, Stijnen T, Cuijpers P, Penninx BW, et al. Overweight, obesity, and depression: a systematic review and meta-analysis of longitudinal studies. Arch Gen Psychiatry 2010; 67:220–229. doi:10.1001/archgenpsychiatry.2010.2PMID:20194822
17. Fontaine KR, Bartlett SJ, Barofsky I. Health-related quality of life among obese persons seeking and not currently seeking treatment. Int J Eat Disord 2000; 27:101–105. PMID:10590455
Obesity, Major Depression/Anxiety and Quality of Life
18. Pan A, Sun Q, Czernichow S, Kivimaki M, Okereke OI, Lucas M, et al. Bidirectional association between depression and obesity in middle-aged and older women. Int J Obes (Lond) 2012; 36:595–
602.
19. Pan A, Kawachi I, Luo N, Manson JE, Willett WC, Hu FB, et al. Changes in Body Weight and Health-Related Quality of Life: 2 Cohorts of US Women. Am J Epidemiol 2014; 180:254–62. doi:10.1093/aje/
kwu136PMID:24966215
20. Penninx BW, Milaneschi Y, Lamers F, Vogelzangs N. Understanding the somatic consequences of depression: biological mechanisms and the role of depression symptom profile. BMC Med 2013 15; 11:129-7015-11-129.
21. Knol MJ, van der Tweel I, Grobbee DE, Numans ME, Geerlings MI. Estimating interaction on an addi-tive scale between continuous determinants in a logistic regression model. Int J Epidemiol 2007; 36:1111–1118. PMID:17726040
22. Knol MJ, VanderWeele TJ. Recommendations for presenting analyses of effect modification and inter-action. Int J Epidemiol 2012; 41:514–520. doi:10.1093/ije/dyr218PMID:22253321
23. Stolk RP, Rosmolen JG, Postma DS, de Boer RA, Davis G, Sleets JP, et al. Universal risk factors for multifactorial diseases: LifeLines: a three-generation population-based study. Eur J Epidemiology 2008; 23:67–74.
24. World Health Organization. Waist Circumference and Waist-Hip Ratio: Report of a WHO Expert Con-sultation.Geneva. 2008.
25. Sheehan DV, Lecrubier Y, Sheehan KH, Amorim P, Janavs J, Weiller E, et al. The Mini-International Neuropsychiatric Interview (M.I.N.I.): the development and validation of a structured diagnostic psychi-atric interview for DSM-IV and ICD-10. J Clin Psychiatry 1998; 59 (Suppl) 20:22–33.
26. Krueger RF, Eaton NR. Transdiagnostic factors of mental disorders. World Psychiatry 2015; 14(1):27–
29. doi:10.1002/wps.20175PMID:25655146
27. Barajas Gutierrez MA, Robledo Martin E, Tomas Garcia N, Sanz Cuesta T, Garcia Martin P, Cerrada Somolinos I. Quality of life in relation to health and obesity in a primary care center. Rev Esp Salud Publica 1998; 72:221–231. PMID:9810829
28. Gandek B, Ware JE, Aaronson NK, Apolone G, Bjorner JB, Brazier JE, et al. Cross-validation of item selection and scoring for the SF-12 Health Survey in nine countries: results from the IQOLA Project. International Quality of Life Assessment. J Clin Epidemiol 1998; 51:1171–1178. PMID:9817135 29. Hays RD, Morales LS. The RAND-36 measure of health-related quality of life. Ann Med 2001; 33:350–
357. PMID:11491194
30. Ware JE, Kosinski M, Keller SD. SF-36 Physical and mental summary scales: A user’s manual. Bos-ton: The Health Institute 1994.
31. Ware JE Jr, Gandek B, Kosinski M, Aaronson NK, Apolone G, Brazier J, et al. The equivalence of SF-36 summary health scores estimated using standard and country-specific algorithms in 10 countries: results from the IQOLA Project. International Quality of Life Assessment. J Clin Epidemiol 1998; 51: 1167–1170. PMID:9817134
32. Slagter SN, van Vliet-Ostaptchouk JV, Vonk JM, Boezen HM, Dullaart RP, Kobold AC, et al. Combined Effects of Smoking and Alcohol on Metabolic Syndrome: The LifeLines Cohort Study. PLoS One 2014; 9:e96406. doi:10.1371/journal.pone.0096406PMID:24781037
33. Egede LE. Major depression in persons with chronic medical disorders: prevalence, correlates and association with health resource utilization, lost productivity and functional disability. Gen Hosp Psychi-atry 2007; 29:409–416. PMID:17888807
34. Thormann J, Chittka T, Minkwitz J, Kluge M, Himmerich H. Obesity and depression: an overview on the complex interactions of two diseases. Fortschr Neurol Psychiatr 2013; 81:145–153. doi:
10.1055/s-0032-1330351PMID:23516104
35. Vogelzangs N, Beekman AT, de Jonge P, et al. Anxiety disorders and inflammation in a large adult cohort. Transl Psychiatry 2013; 3:e24.
36. Whisman MA, McClelland GH. Designing, testing, and interpreting interactions and moderator effects in family research. J Fam Psychol 2005; 19:111–120. PMID:15796657
37. Badia X, Valassi E, Roset M, Webb SM. Disease-specific quality of life evaluation and its determinants in Cushing's syndrome: what have we learnt? Pituitary 2014; 17:187–195. doi:
10.1007/s11102-013-0484-2PMID:23564339
38. Atlantis E, Goldney RD, Eckert KA, Taylor AW. Trends in health-related quality of life and health service use associated with body mass index and comorbid major depression in South Australia, 1998–2008. Qual Life Res 2012; 21:1695–1704. doi:10.1007/s11136-011-0101-7PMID:22205135
40. Hilbert A, Braehler E, Haeuser W, Zenger M. Weight bias internalization, core self-evaluation, and health in overweight and obese persons. Obesity (Silver Spring) 2014; 22: 79–85.
41. Cameron AJ, Magliano DJ, Dunstan DW, Zimmet PZ, Hesketh K, Peeters A, et al. A bi-directional rela-tionship between obesity and health-related quality of life: evidence from the longitudinal AusDiab study. Int J Obes (Lond) 2012; 36:295–303.
42. Gariepy G, Wang J, Lesage AD, Schmitz N. The longitudinal association from obesity to depression: results from the 12-year National Population Health Survey. Obesity (Silver Spring) 2010; 18:1033–
1038.
43. Renzaho A, Wooden M, Houng B. Associations between body mass index and health-related quality of life among Australian adults. Qual Life Res 2010; 19:515–520. doi:10.1007/s11136-010-9610-zPMID:
20182918
44. Vetter ML, Wadden TA, Lavenberg J, Moore RH, Volger S, Perez JL, et al. Relation of health-related quality of life to metabolic syndrome, obesity, depression and comorbid illnesses. Int J Obes (Lond) 2011; 35:1087–1094.
45. Laaksonen M, Sarlio-Lahteenkorva S, Leino-Arjas P, Martikainen P, Lahelma E. Body weight and health status: importance of socioeconomic position and working conditions. Obes Res 2005; 13:2169–2177. PMID:16421352
46. Nigatu YT, Bultmann U, Reijneveld SA. The prospective association between obesity and major depression in the general population: does single or recurrent episode matter? BMC Public Health 2015; 15(1):350.
47. Nigatu Y, Bültmann U, Reijneveld S. The prospective association between obesity and major depres-sion: a longitudinal cohort study in the general population. The European Journal of Public Health 2013; 23(suppl 1).
48. van Zutven K, Mond J, Latner J, Rodgers B. Obesity and psychosocial impairment: mediating roles of health status, weight/shape concerns and binge eating in a community sample of women and men. Int J Obes (Lond) 2015; 39:346–352.
49. Giovannucci E, Colditz G, Stampfer MJ, Rimm EB, Litin L, et al. The assessment of alcohol consump-tion by a simple self-administered quesconsump-tionnaire. Am J Epidemiol 1991: 133: 810–817. PMID:2021148 50. Blumenthal SR, Castro VM, Clements CC, Rosenfield HR, Murphy SN, Fava M, et al. An electronic
health records study of long-term weight gain following antidepressant use. JAMA Psychiatry 2014; 71:889–896. doi:10.1001/jamapsychiatry.2014.414PMID:24898363
51. Barnes RD, White MA, Martino S, Grilo CM. A randomized controlled trial comparing scalable weight loss treatments in primary care. Obesity (Silver Spring) 2014; 22:2508–2516.
Obesity, Major Depression/Anxiety and Quality of Life