Services
King-Wah Chiu*, Shue-Shian Chiou*
Division of Hepato-Gastroenterology, Department of Internal Medicine, Kaohsiung Chang Gung Memorial Hospital, and Chang Gung University, College of Medicine, Taiwan, Republic of China
Abstract
Gastroendoscopy (GS) procedures are not only performed by gastroenterologists (GE) but also by hepatologists (HT) in many countries. Endoscopic biopsy (EBx) remains the gold standard for the investigation and documentation of esophago-gastro-duodenal pathology. EBx is subjectively performed by an endoscopist, and the level of skill and experience of the endoscopist may affect the quality of the endoscopic service. Reasons for this discrepancy included lack of experience practitioners to order EBx when required of GS issues between in GE and HT limit access. Ideally, services should be safe and of high quality. This study assessed the EBx/GS ratio as the endoscopic quality assurance as an index of GS services. This was a cohort study of endoscopists at Kaohsiung Chang Gung Memorial Hospital, a teaching hospital in southern Taiwan. There were 34,570 episodes of EBx in 199,877 GS procedures. The 25 endoscopists were divided into GE (n = 13) and HT (n = 12) groups, and correlation coefficients were calculated over a 14.5-year duration of intervention. The Trimmean of EBx/GS was 19.29% in 14.5 years (34570/199877 with Trimmean 0.2 percentile ratio correlations), and the Pearson correlation coefficient was 0.90229. There were significantly more EBx procedures in the GE group than in the HT group at 1 and 5 years (21.5% vs. 15.1% and 20.9% vs. 17.3%, respectively, P,0.00001). Junior GE attempted significantly more EBx than both the senior GE (24.06% vs. 20.41%, P,0.0001), and junior HT (24.06% vs. 13.2%, P,0.0001). In conclusion, quality assurance for gastrointestinal endoscopy involves numerous aspects of unit management and patient safety. Quality measures used with the EBx/GS ratio may be one of the best ways to ensure the quality of endoscopic procedures in a teaching hospital.
Citation:Chiu K-W, Chiou S-S (2013) Endoscopic Biopsy as Quality Assurance for Endoscopic Services. PLoS ONE 8(11): e78557. doi:10.1371/journal.pone.0078557
Editor:John Green, University Hospital Llandough, United Kingdom
ReceivedJuly 16, 2013;AcceptedSeptember 20, 2013;PublishedNovember 12, 2013
Copyright:ß2013 Chiu, Chiou. This is an open-access article distributed under the terms of the Creative Commons Attribution License, which permits unrestricted use, distribution, and reproduction in any medium, provided the original author and source are credited.
Funding:The authors have no support or funding to report.
Competing Interests:The authors declare that they have no competing interests.
* E-mail: [email protected] (KC); [email protected] (SC)
Introduction
In clinical practice, gastroendoscopy (GS) procedures are performed by both gastroenterologists (GE) and hepatologists (HT) in many countries. An increased demand for endoscopic procedures has led to the provision of these services without satisfactory quality assessment methods [1]. The importance of performing high-quality endoscopic procedures has increased [2], in particular to prevent acquired infections after the procedures [3–6]. In GS, endoscopic biopsy (EBx) remains the gold standard for the investigation and documentation of esophageal, gastric and duodenal pathology [7]. EBx is subjective performed by an endoscopist, and the level of skill and experience of the endoscopist may affect the quality of the endoscopic service. Reasons for this discrepancy included lack of experience practitioners to order EBx when required of GS issues between in GE and HT are limited access. Ideally, services should be safe and of high quality. An interesting point of view that focus on the attempt of EBx was investigated the difference between the GE and HT. We proposed this study to try to draw up a guideline along with the endoscopic quality assurance for the adoption of this practice that EBx/GS ratio to be an index for the clinical investigation.
Methods
According to the database of computerized records from the endoscopic unit of Kaohsiung Chang Gung Memorial Hospital
endoscopic biopsy, and all cases stopped spontaneously or by endoscopic hemostasis.
Ethics Statement
All clinical investigations were conducted according to the principles expressed in the Declaration of Helsinki. Written informed consent was obtained from all participants for their information to be stored in the hospital database and used for
research. This study was approved by the Institutional Review Board of Chang Gung Memorial Hospital Ethics Committee (No.102-2299B).
Statistical Analysis
All statistical analyses were performed using the Trimmean method of Microsoft Office Excel 2007 with percent = 0.2. A mean trimmed 20% was computed by discarding the lower and higher 10% of the scores and taking the mean of the remaining scores (http://www.java2s.com/Tutorial/Microsoft-Office-Excel-2007/0420__Statistical-functions/TRIMMEANarraypercentre turnsthemeanoftheinteriorofadataset.htm), and Pearson corre-lation coefficient analysis was performed (http://www.java2s. com/Tutorial/Microsoft-Office-Excel-2007/0420__Statistical-functions/PEARSONindependentdependentreturnsthePearson productmomentcorrelationcoefficient.htm) to create standard quality assurance curves of EBx/GS linear correlation with 95% mean prediction intervals. Comparisons of parameters of the EBx/GS ratio between 1-year and 5-year investigations of the GE and HT were performed using the X2 test, Fisher’s
exact test, and Student’s t-test with SPSS software (version
12.0; SPSS, Chicago, IL, USA).P values less than 0.05 were
considered to be statistically significant.
Results
The ratio of EBx/GS was 17.29% (34570/199877, mean biopsy rate 19.8768.14%) for the 27 endoscopists over the 14.5-year study period. The Pearson correlation coefficient was 0.90229. The Trimmean of EBx/GS was 19.29% (34570/199877 over 14.5 years) with Trimmean 0.2 percentile ratio correlation, R2= 0.8141 (27, 0.2) (Figure 1) (Table 2). In 1-year and 5-year investigations, the ratio of EBx/GS was significantly higher in the GE group than in the HT group (21.5% vs. 15.1% and 20.9% vs. 17.3%, respectively, P,0.00001)(Table 2). There were no significant differences between the 1-year and 5-year analyses in both the GE and HT groups (Table 2). In the 5-year analysis with the 25 endoscopists, there were significantly more EBx procedures in the GE group than in the HT group (20.9% vs. 17.3%, P,0.0001) (Table 3). The junior GE attempted significantly more EBx procedures than both the senior GE (24.1% vs. 20.4%, P,0.0001) and the junior HT (24.1% vs. 13.2%, P,0.0001) (Table 3). For the HT group, the EBx/GS was significantly higher for the senior than the junior physicians (18.3% vs. 13.2%, P,0.0001) (Table 3). According to the indications for endoscopy (Table 1), the discrepancies between the GE and HT groups were significantly different, especially in esophageal varices, gastric varices and portal hypertensive gastropathy.
Discussion
Kaohsiung Chang Gung Memorial Hospital is a medical center with 2,715 beds and over 6,900 outpatients and 370 emergency patients. To deliver a high quality medical service, the Hospital adopts a patient-centered approach, safety practices, and encour-ages innovations in teaching, research and medical services. In this large academic medical cohort study, the average biopsy rate was 17.3% of about 200 thousand endoscopic procedures over a 14.5-year period. Because of differences in EBx for each endoscopist, an appropriate statistical method was used to represent the accuracy, and showed a statistical average of the EBx/GS of 19.8768.24% with a confidence correlation coefficient of 0.90229. According to the Pearson correlation coefficient, the rate of EBx was statistically related to the GS service. For draw up a standard assurance in Table 1.Indications for upper endoscopies for the
gastroenterologists and hepatologists.
Indications for endoscopy* GE (%) HT (%) Pvalue
UGI bleeding 2597 (1.1) 911 (0.9) ,0.0001
PU 149 (0.1) 142 (0.1) 0
Esophagus GERD 7716 (3.4) 5037 (4.9) ,0.0001
Ulcer 4786 (2.1) 2348 (2.3) ,0.0001
Cancer 2584 (1.1) 525 (0.5) ,0.0001
Polyp 1016 (0.4) 278 (0.3) ,0.0001
Submucosa tumor 1421 (0.6) 258 (0.3) ,0.0001
Varices 10523 (4.6) 6686 (6.6) ,0.0001
Mallory Weiss 188 (0.1) 12 (0.0) ,0.0001
Hiatus herniation 5907 (2.6) 1488 (1.5) 0
Achalasia 403 (0.2) 30 (0.0) ,0.0001
Barrett 991 (0.4) 158 (0.2) ,0.0001
Other 5933 (2.6) 488 (0.5) 0
Stomach Gastritis 57055 (24.9) 21822 (21.4) 0
Erosion 24982 (10.9) 17613 (17.3) ,0.0001
Ulcer 30477 (13.3) 14571 (14.3) 0
Cancer 1610 (0.7) 708 (0.7) ,0.0001
Polyp 6441 (2.8) 3041 (3.0) ,0.0001
Submucosa tumor 4719 (2.1) 1021 (1.0) 0
Lymphoma 312 (0.1) 64 (0.1) ,0.0001
Chronic Gastritis 9230 (4.0) 1316 (1.3) 0
Varices 3354 (1.5) 2093 (2.1) ,0.0001
Angiodysplasia 933 (0.4) 292 (0.3) ,0.0001
Xanthoma 2058 (0.9) 927 (0.9) ,0.0001
Marginal ulcer 836 (0.4) 420 (0.4) ,0.0001
Stomal gastritis 1246 (0.5) 880 (0.9) ,0.0001
PHG 976 (0.4) 1462 (1.4) ,0.0001
Endoscopic treatment
2002 (0.9) 909 (0.9) ,0.0001
EVL 1295 (0.6) 909 (0.9) ,0.0001
Other 5068 (2.2) 1534 (1.5) 0
Duodenum Ulcer 19356 (8.5) 9813 (9.6) 0
Endoscopic treatment
287 (0.1) 80 (0.1) ,0.0001
Lymphoma 312 (0.1) 64 (0.1) ,0.0001
Endoscopic treatment
12129 (5.3) 3911 (3.8) 0
Total 228892 (100.0) 101811 (100.0)
*Indications can be more than one selection for each case. PHG: portal hypertensive gastropathy; PU: peptic ulcer; UGI: upper gastrointestine; EVL: esophageal varices ligation; GE gastroenterologist; GERD; gastroesophageal reflux disease; HT: hepatologist.
doi:10.1371/journal.pone.0078557.t001
endoscopic procedural practice, Trimmean modified with Trim-mean statistical method was used to discard the variant data for some endoscopists. A recent study showed that more attending physicians (42%) than fellows (40%) felt that writing a manuscript and belonging to a gastrointestinal society improved knowledge, however the fellows expressed that they needed more practice [8]. In the current study, the higher biopsy ratio for the junior GE (24%) than the senior GE showed that pathological findings can improve experience. That is, the junior GE needed more pathological diagnoses to contribute to the endoscopic findings. In contrast, the lower biopsy ratio for the junior HT (13.2%) than the senior HT (18.3%) suggests a lack of subjective clinical alertness to perform a biopsy, and that the clinical experience of senior HT in interpreting endoscopic findings may not be sufficient. With regards to the indications for the endoscopic procedures, the causes were similar in the two groups. It should be
noted that the hepatologists may have been looking for varices and therefore less likely to be taking biopsies in patients with dyspepsia. The large variation in EBx/GS ranging from 8.64% to 44.58% makes it difficult to calculate a confident mean. A mean trimmed by 20% is computed by discarding the lower and higher 10% of the scores and taking the mean of the remaining scores. The Trimmean (27, 0.2) of this study was 19.29%, and the R2value was 0.8141, showing that a 19.3% EBx rate was a quality assurance reference for daily clinical GS services. This is a simple method to calculate a reference mean from a large endoscopic unit for endoscopic assurance of quality. There was no evidence to suggest that a higher EBx/GS mean (44.58%) from the senior GE contributed to better results for the early detection of cancer than the HT or junior GE. If there is no apparent reason for this discrepancy, it is a so-called aberration of waste medical resources. Stand on the physician education that it may be an evidence of the Figure 1. The ratio of the 34,570 endoscopic biopsies and 199,877 gastroendoscopic services with Trimmean (0.2 percent) correction performed by 27 endoscopists including 15 gastroenterologists and 12 hepatologists over 14.5 years.
doi:10.1371/journal.pone.0078557.g001
Table 2.The ratio of endoscopic biopsy/gastroendoscopic procedures and Trimmean modified with Trimmean statistical method of Microsoft Office Excel 2007 between the gastroenterologists and hepatologists.
Category Gastroenterologist (n = 13) Hepatologist (n = 12)
EBx GS Ratio (%) Trimmean (%) EBx GS Ratio (%) Trimmean (%)
1 year 2261 10503 21.5a 22.23 775 5149 15.1a 16.50
5 years 11185 53492 20.9%b 22.36 4446 25679 17.3%b 16.97
14.5 years* EBx/GS = 34570/199877, (ratio = 17.29%), (mean = 19.8768.14%), (Trimmean = 19.29%)
Statistic analysis used with Trimmean method of Microsoft Office Excel 2007 with percent = 0.2. A mean trimmed 20% was computed by discarding the lowest and highest 10% of the scores and taking the mean of the remaining scores.
*total 27 endoscopists included 15 gastroenterologists and 12 hepatologists; The Pearson correlation coefficient was 0.90229; EBx = endoscopic biopsy; GS = gastroendoscopy;
a, bP
,0.0001.
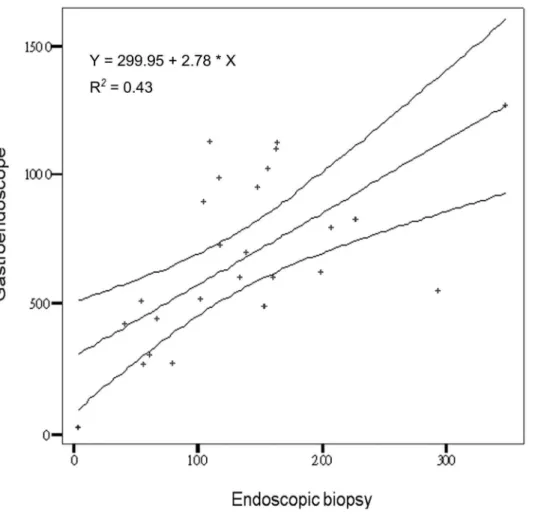
deviant behavior with medical waste. Educating physicians is an essential step in establishing a broader culture of compliance and improved integrity in a healthcare system, extending beyond Medicare and Medicaid [9–10]. Therefore, this behavior needs to be corrected [11]. In contrast, a lower EBx/GS mean down to 8.64%, the endoscopic unit staff should have in charge to make a sense or alarm to correct or review the malpractice for the patient safely in a large academic teaching hospital because of the risky for missing diagnosis. How to measure the assurance of the endoscopic service is very important [12–14]. Therefore, the value of the present study is in suggesting the mean EBx/GS as a guideline to cover both GE and HT in the clinical endoscopic service. We also attempted to calculate an acceptable range in 95% mean prediction interval with 65% distribution for the clinical reference as a standard quality assurance curve. The R2 was equal to 0.43 (Figure 2). Our results suggest that a ratio of EBx/GS of 19.365% (range 14.3% to 24.3%) should be followed by not only GE but also HT in the quality investigation of endoscopic services. There was no significant difference in mean EBx/GS between the 1-year and 5-year observations. Annual performance evaluations should take advantage of this method objectively to observe the physician’s medical performance. This emphasizes the importance of focusing service improvement on enhancing the quality of a patient’s experience of endoscopy and describes the processes used here for quality assurance of endoscopy units [15]. In Taiwan, both GE and HT endoscopists are board certified in gastroenterology. According to the rules of the Digestive Endoscopy Society of Taiwan, all GE and HT are permitted to perform endoscopic service clinically after completing two years of fellowship training in a hepato-gastroenterology program followed by active endoscopic practice and certification from the Digestive Endoscopy Society of Taiwan. There were no definitions for senior or junior certification and no clear definitions to clarify the seniors who were certified in advanced endoscopic
techniques. In addition, there were no differences in the endoscopic training and certification between HT and GE. It should be emphasized that biopsy attempts were dependent on the endoscopist. Too many biopsies are a waste of medical resources, and too few biopsies risk misdiagnosis. Therefore, an average curve for clinical reference for each endoscopist may be useful. Bias was present in this study in that misdiagnoses such as discrepancies between macroscopic and microscopic pathological findings was clinical evidence. However, the final diagnosis depended on the pathology. It is very difficult to clarify the misdiagnoses because the endoscopist did not perform a biopsy in each case. Finally, the patient’s satisfaction post-investigation is an important part of the endoscopic service [16], and this will be investigated in future studies. Although it is really difficult (if not impossible) to draw a conclusion only from the EBx/GS ration on the endoscopic quality, it may be one of the usable method to educate by positive measures or open to criticism the assurance of the endoscopic service. In contrast, the data regarding complica-tion after biopsy some like bleeding, perforacomplica-tions, and infeccomplica-tions that it is a statement of a negative list approach to medical negligence, it does not focus of this thesis statement nor the endoscopists would like to have. One thing would like to emphasize here, a miss-diagnosis should happen when the lesion needs to be biopsy for pathological confirmation but the endoscopist could not do so. The patients-satisfaction post-investigational also a useful index for the endoscopic service but it is a subjective investigation with questionnaire study because of recall bias [1] when compared with the EBx/GS ration.
In conclusion, quality assurance for gastrointestinal endoscopy involves numerous aspects of unit management and patient safety. Quality measures used with the EBx/GS ratio may be one of the best ways to ensure the quality of endoscopic procedures in a teaching hospital. The acceptable mean of EBx/GS was 19.3% ranging from 14.3% to 24.3% in 1-year evaluations.
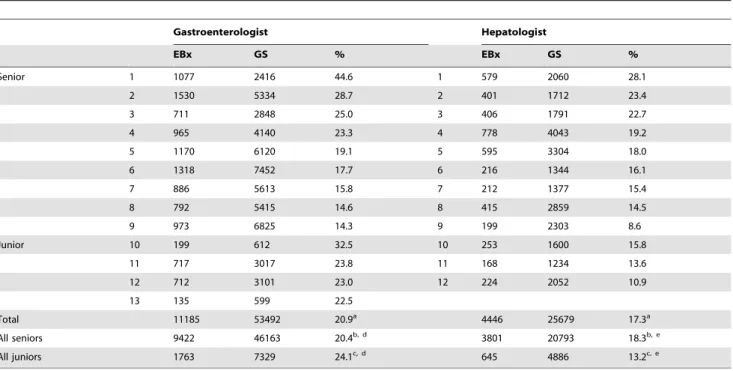
Table 3.The 5-year endoscopic biopsy/gastroendoscopy ratio of the 25 endoscopists including 13 gastroenterologists and 12 hepatologists and the distribution of senior and junior physicians in our unit.
Gastroenterologist Hepatologist
EBx GS % EBx GS %
Senior 1 1077 2416 44.6 1 579 2060 28.1
2 1530 5334 28.7 2 401 1712 23.4
3 711 2848 25.0 3 406 1791 22.7
4 965 4140 23.3 4 778 4043 19.2
5 1170 6120 19.1 5 595 3304 18.0
6 1318 7452 17.7 6 216 1344 16.1
7 886 5613 15.8 7 212 1377 15.4
8 792 5415 14.6 8 415 2859 14.5
9 973 6825 14.3 9 199 2303 8.6
Junior 10 199 612 32.5 10 253 1600 15.8
11 717 3017 23.8 11 168 1234 13.6
12 712 3101 23.0 12 224 2052 10.9
13 135 599 22.5
Total 11185 53492 20.9a 4446 25679 17.3a
All seniors 9422 46163 20.4b, d 3801 20793 18.3b, e
All juniors 1763 7329 24.1c, d 645 4886 13.2c, e
EBx: endoscopic biopsy; GS: gastroendoscopy; a, b, c, d, e
P,0.0001.
doi:10.1371/journal.pone.0078557.t003
Acknowledgments
The authors thank Ms. Ching-Yin Huang for helping with data collection and Ms. Mei-Chin Hsu for help with the statistical analysis of this study.
Author Contributions
Conceived and designed the experiments: KWC. Performed the experiments: KWC. Analyzed the data: KWC SSC. Contributed reagents/materials/analysis tools: KWC SSC. Wrote the paper: KWC SSC. Read and approved the final version of this manuscript: KWC SSC.
References
1. Ko HH, Zhang H, Telford JJ, Enns R. (2009) Factors influencing patient satisfaction when undergoing endoscopic procedures. Gastrointest Endosc 69: 883–91.
2. Faigel DO, Pike IM, Baron TH, Chak A, Cohen J, et al. (2006) Quality indicators for gastrointestinal endoscopic procedures: an introduction. Am J Gastroenterol 101: 866–72.
3. Chiu KW, Fong TV, Wu KL, Chiu YC, Chou YP, et al. (2010) Surveillance Culture of Endoscope to Monitor the Quality of High-Level Disinfection of Gastrointestinal Reprocessing. Hepatogastroenterology 57: 531–4.
4. Lu LS, Wu KL, Chiu YC, Lin MT, Hu TH, et al. (2012) Swab culture monitoring of automated endoscope reprocessors after high-level disinfection. World J Gastroenterol 18: 1660–3.
5. Chiu KW Lu LS, Wu KL, Lin MT, Hu ML, et al. (2012) Surveillance Culture Monitoring of Double-Balloon Enteroscopy Reprocessing With High-Level Disinfection. Eur J Clin Invest 42: 427–31.
6. Chiu KW, Lu LS, Chiu YC, Wu KL, Lin MT, et al. (2012) Surveillance cultures of samples obtained from biopsy channels and automated endoscope reprocessors after high-level disinfection of gastrointestinal endoscopes. BMC Gastroenterol 12: 120.
7. Nakanishi Y, Ochiai A, Shimoda T, Yamaguchi H, Tachimori Y, et al. (1999) Heterotopic sebaceous glands in the esophagus: histopathological and immuno-histochemical study of a resected esophagus. Pathol Int. 49: 364–8.
8. Koczka CP, Geraldino-Pardilla LB, Goodman AJ, Gress FG. (2013) A nationwide survey of gastroenterologists and their acquisition of knowledge. Am J Gastroenterol. 108: 1033–5.
9. Agrawal S, Tarzy B, Hunt L, Taitsman J, Budetti P. (2013) Expanding Physician Education in Health Care Fraud and Program Integrity. Acad Med 88: 1081–7. 10. Lakbala P, Lakbala M. (2013) Knowledge, attitude and practice of hospital staff
management. Waste Manag Res 31: 729–32.
11. Moriates C, Soni K, Lai A, Ranji S. (2013) The value in the evidence: teaching residents to ‘‘choose wisely’’. AMA Intern Med 173: 308–10.
12. Challand CP, Bullen N, Wu E, Hosie KB. (2011) How do you measure performance as a colonoscopist? Colorectal Dis 13: 939–43.
13. Bjorkman DJ, Popp JW Jr. (2006) Measuring the quality of endoscopy. Gastrointest Endosc 63(4 suppl): 1–2.
14. Rex DK, Petrini JL, Baron TH, Chak A, Cohen J, et al. (2006) Quality indicators for colonoscopy. Am J Gastroenterol 101: 873–85.
15. Fried M, Quigley EM, Hunt RH, Guyatt G, Anderson BO, et al. (2008) Are global guidelines desirable, feasible and necessary? Nat Clin Pract Gastroenterol Hepatol 5: 2–3.
16. Johanson JF, Schmitt CM, Deas TM Jr, Eisen GM, Freeman M, et al. (2000) Quality and outcomes assessment in gastrointestinal endoscopy. Gastrointest Endosc 52(6 pt 1): 827–30.
Figure 2. The 5-year ratio of endoscopic biopsies and gastroendoscopic services with 95% mean prediction interval to create a standard quality assurance curve with±5% border distribution.