L. Gelman1, I. Jennions2, and I. Petrunin3
1,3School of Engineering, Cranfield University, Cranfield, Bedfordshire, MK43 0AL, UK
[email protected] [email protected]
2IVHM Centre, Cranfield University, Cranfield, Bedfordshire, MK43 0AL, UK
A
BSTRACTThe novel residual technology is applied for the detection/diagnosis of partly-missing (chipped) tooth in a gear of the machine fault simulator (MFS) produced by SpectraQuest (USA). The automated sensor-less technique is implemented for the speed estimation. This technique estimates the speed data from raw vibration data using the narrow-band demodulation of the mesh component, providing that an approximate running speed and number of teeth are known. An advanced technique based on the likelihood ratio is used for decision making. The novel technology is compared with the conventional technique, the classical residual technology. For both technologies, the gear fault has been continuously diagnosed throughout the whole test duration without false alarms and missed detections. The use of the novel residual technology in comparison to the classical residual technology provides higher probability of the correct damage detection and faster damage diagnosis.
1. INTRODUCTION
Three main approaches are applied for detecting faults in geared systems: acoustic analysis, debris monitoring and vibration analysis. The vibration-based diagnosis has been the most popular monitoring technique because of its high effectiveness. Local fault detection in gears using vibration analysis has been a subject of intensive research. A plethora of methods have been proposed including amplitude and phase demodulation (McFadden, 1986, Gelman et al., 2005, Combet, Gelman, Anuzis, & Slater, 2009), cepstrum analysis (Randall 1982), residual analysis (Combet at al., 2009, Wang, Ismail, & Golnaraghi, 2001), adaptive filtering (Brie, Tomczak, Oehlmann, & Richard, 1997, Lee & White, 1998, Combet & Gelman, 2009), use of a model
(Wang & Wong, 2002, Martin, Jaussaud, & Combet, 2004), inverse filtering (Lee & Nandi, 2000, Endo & Randall, 2007), time frequency (TF) analysis (Wang & McFadden, 1993, Forrester, 1996, Choy, Polyshchuk, Zakrajsek, Handschuh, & Townsend, 1996, Wang & McFadden, 1996, Loutridis, 2006, Halima, Shoukat Choudhuryb, Shaha, & Zuoc, 2008) and time-scale analysis (Wang et al., 2001, Dalpiaz, Rivola, & Rubini, 2000, Lin & Zuo, 2003). The majority of the gear fault detection methods are based on the residual signal as classically obtained after the removal of the mesh harmonic components from the gear vibration signal which is processed using the time synchronous average (TSA) (Stewart, 1977, McFadden, 1987). However, our literature search (McFadden, 1986, Combet at al., 2009, Wang at al., 2001, Lee & White, 1998, Halima et al., 2008, Stewart, 1977, McFadden, 1987) showed that nobody has investigated the effectiveness of the residual technology for detection of partly missing (chipped) gear tooth. Therefore, the aim of this paper is to investigate for the first time detection of partly missing (chipped) gear tooth by the residual technology.
2. THENOVELRESIDUALTECHNOLOGY
Schematic of the damage detection technology, based on the novel residual signal is shown in Fig. 1. The first stage of the technology is the angular re-sampling of the raw vibration signal using the estimate of the shaft speed. The speed estimate can be obtained using the one / rev signal from a tachometer; however, in some cases, the speed can be extracted from vibration data without need of the tachometer signal. In the present paper, the advanced automatic technology for the time synchronous averaging of the raw gear vibrations has been employed (Combet & Gelman, 2007). This technology does not require detailed speed data; only the approximate value of the running speed and number of teeth are necessary.
Figure 1. Schematic of the novel residual damage detection technology.
The speed is estimated from the automatically selected mesh component of the vibration data using the narrow-band demodulation (Combet & Gelman, 2007). The TSA is then performed for the signal re-sampled according to the estimated speed. In order to estimate the signal duration required for the TSA, the dependency of the ratio between the averaged variance of the TSA signal and the variance of the re-sampled vibration signal versus the number of averages was estimated. The length of the raw signal required for the TSA was estimated according to the number of averages at which the ratio of variances begin demonstrate the stationary-like behavior (Fig. 2). This approach is proposed in (Combet & Gelman, 2009).
The novel residual signal is obtained from the TSA signal by removing not only the mesh harmonics but also low and high shaft orders. This approach is proposed in (Combet at al., 2009). It improves detection effectiveness as impacts created by local gear faults usually affect the relatively narrow frequency range of the gearbox vibration spectrum.
The extraction of the diagnostic features is based on the averaging of the residual signal envelope within the meshing interval. The feature values are obtained for each tooth of the gear.
The decision making procedure is based on the estimation of the likelihood ratio using training data witha priori known classification. During the testing, values of the likelihood ratio are accumulated and compared to the threshold in order to make the final decision. This procedure allows for making decision for each tooth of the gear separately.
Figure 2. Estimation of the relative variance change of the TSA signal vs realization size.
3. THEEXPERIMENTDESCRIPTION
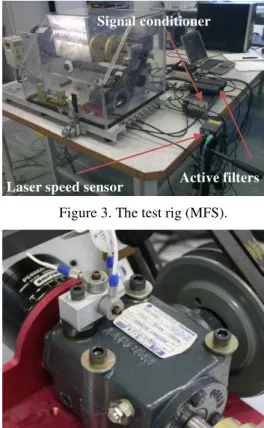
The experimental set up is based on the MFS test rig produced by SpectraQuest (USA) (Fig. 3) equipped with one-stage gearbox (Fig. 4). Two gears were used for the test: gear 1 with no damage on teeth and gear 2 with a partly missing (chipped) tooth (Fig. 5). The test was performed at a constant shaft speed of 3000 rpm (measured on the motor shaft) which corresponds to approximately 1200 rpm on the tested gear shaft.
Figure 3. The test rig (MFS).
Figure 4. The gearbox with installed accelerometers.
Active filters Signal conditioner
Figure 5. The gear with partly missing tooth.
Figure 6. Schematic of the measurement set-up.
The load on the gear was applied by a magnetic brake system with the torque value of 6 lbs*in. The schematic of the measurement set-up is shown in Fig. 6.
Vibrations from three channels for axial, horizontal and vertical directions were recorded using 3 Endevco 7251A-100 accelerometers installed on the gearbox case (Fig. 4). Signal conditioning was performed using an Endevco 133 signal conditioner and analogue active anti-aliasing filters Kemo PocketMaster 1600. The cut-off frequency of the filters was set at 10 kHz. The averaged speed estimation was obtained using a laser speed sensor and reflective tape, attached to the driven wheel of the belt transmission (Fig. 3). All signals were recorded using National Instruments’ data acquisition card NI DAQ-6062E at 25kHz sampling frequency.
The whole data set is represented by 7 records of approximately 3 minutes duration each with a 10-minute interval between them for damaged and undamaged gears.
The length of the signal realization for the residual signal estimation by the TSA was selected 20s according to the above-mentioned dependency of the ratio between the averaged TSA signal variance and the variance of the angular re-sampled vibration signal versus the number of averages. Therefore, each record represented by 9-10 realizations, and the whole data set of 7 records will contain 64 realizations.
4. THEDATAPROCESSINGANDRESULTS
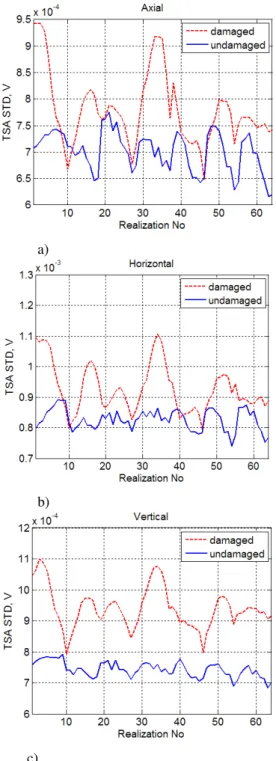
A channel selection for processing of the gear vibrations was performed according to the analysis of the standard deviation of the residual signal for undamaged and damaged gears. In Figs. 7 (a-c), the standard deviations of the TSA signals are shown in blue for the case of no damage and in red for the case when a gear tooth is damaged.
For all directions of accelerometers, values of Fisher criterion (Webb, 1999) were calculated in order to estimate the separation of standard deviation values (Table 1). According to results of this analysis, the vertical channel has been selected for further processing as the one providing the best difference of the standard deviations for the residual signals from undamaged and damaged gears.
The estimated speed required for angular re-sampling was obtained directly from the raw vibration signal (Combet & Gelman, 2007), taking the averaged speed estimation from the laser speed sensor as the input.
As it was mentioned above, the whole set of data consists of 64 realizations of data representing gears with tooth damage and 64 realizations of data representing gears without tooth damage. The training data for the damage detection were selected as follows:
Class “damaged” was presented by 32
diagnostic features for damaged tooth 7 of the gear in 32 gear vibration signals, i.e. every other realization of the total amount of 64 realizations.
Class “undamaged” was presented by all 18 teeth of 32 realizations for the undamaged gear and remaining 17 teeth (all, except the tooth number 7) of 32 realizations for the damaged gear (in total, 1120 diagnostic features).
Axial direction
Horizontal direction
Vertical direction Fisher
criterion 1.0 1.4 7.9
a)
b)
c)
Figure 7. The standard deviations of the TSA signals for axial, horizontal and vertical directions for gear
with and without tooth damage.
The averaged error probability of the correct detection was calculated for training data using the kNN classifier (Webb, 1999) for k=5:
0.5 ,
errAvg errDam errUndam
P P P
where PerrDam is the error probability for the damaged conditions, PerrUndam is the error probability for the undamaged conditions. For the case of using the classical residual technology, the averaged error probability of correct detection is 0.14; for the case of using the novel residual technology, this probability is 0.047. Therefore, use of the novel residual technology improves separation between diagnostic features for damaged and undamaged conditions of the gear and provides almost 3 times decrement in the averaged error probability of the correct detection.
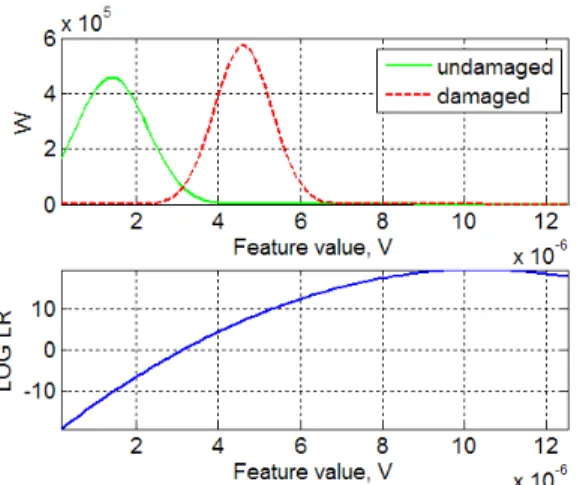
Observing the unimodal shape of diagnostic features distributions, the likelihood ratio was obtained using the Gaussian models of the data for classes “undamaged” and “damaged”. To build the models, the corresponding values of mean and variance were estimated for each class. Gaussian models for classes and the resulting logarithm of the likelihood ratio are shown in Fig. 8, 9 for the classical and novel residual technologies respectively.
The likelihood ratio is estimated using the selected damaged and undamaged training data and finally, the testing data are processed. The decision making procedure used is based on the accumulated likelihood ratio which is given by:
1
1
1
,..., | log
,..., |
| |
log log ,
| |
acc
N dam N
N undam N
i dam i dam i
i
i undam i undam i
p x x
p x x
p x p x
p x p x
where p x
i|
dam
and p x
i|
undam
are theconditional probability density functions for the two diagnostic classes ωdam for data from damaged
conditions and ωundam for data from undamaged
conditions; i=1,…,Nacc, are diagnostic features estimated on the selected sequence of realizations. Nacc is the number of accumulations.
The decision making rule for damage diagnosis using the sequence of realizations is:
, b
thr
where thrb is the threshold for the accumulated
likelihood ratio.
Figure 8. The Gaussian models of the probability density function W for classes “undamaged” and “damaged” (top), and logarithm of likelihood ratio
(bottom) for training data based on the classical residual technology.
Figure 9. The Gaussian models of the probability density function W for classes “undamaged” and “damaged” (top), and logarithm of likelihood ratio (bottom) for training data based on the novel residual
technology.
Selection of parameters for the test was performed as follows. The initial value of the threshold thrb was
selected lying approximately between histograms of Gaussian models of data with and without damage. The final values of thrb and Nacc were obtained by optimization of the damage diagnosis procedure using the minimum of the total error probability as the optimization criterion.
For both considered cases with using the classical and the novel residual technology, the errorless diagnosis was achieved, i.e. the partly missing (chipped) tooth was diagnosed without missed detections and false alarms.
It was found that the use of the novel residual technology provides 2.3 times decrement in the diagnosis time in comparison with the classical residual technology.
5. CONCLUSIONS
The novel residual technology for gear
damage /diagnosis was successfully applied for the first time to the detection/diagnosis of the partly missing tooth.
The gear fault: partly missing (chipped) tooth has been continuously diagnosed throughout the whole test duration without false alarms and missed detections.
The use of the novel residual technology in comparison to the classical residual technology provides better separation of diagnostic features (i.e. the total averaged error of detection reduced 3 times for the novel residual technology) and faster damage diagnosis (i.e. diagnosis time is 2.3 times less for the novel residual technology).
ACKNOWLEDGEMENT
The authors would like to acknowledge the
contribution of the Cranfield IVHM Centre
experimental facilities and resource in the successful completion of this work.
REFERENCES
McFadden, P. D. (1986). Detecting fatigue cracks in gears by amplitude and phase demodulation of the meshing vibration.Journal of Vibration, Acoustics, Stress, and Reliability in Design, vol. 108, pp. 165-170.
Gelman, L., Zimroz, R., Birkel, J., Leigh-Firbank, H., Simms, D., Waterland, B., & Whitehurst, G. (2005). Adaptive vibration condition monitoring technology for local tooth damage in gearboxes. Insight Int. J. Non-Destructive Testing and Condition Monitoring, vol. 47(8), pp. 461–464.
Combet, F., Gelman, L., Anuzis, P., & Slater, R. (2009). Vibration detection of local gear damage
by advanced demodulation and residual
techniques. Proc. IMechE, vol. 223 Part G: J. Aerospace Engineering, pp.507-514.
Randall, R. B. (1982). A new method of modeling gear faults. ASME Journal of Mechanical Design, vol. 104, pp. 259–267.
Brie, D., Tomczak, M., Oehlmann, H., & Richard, A. (1997). Gear crack detection by adaptive amplitude and phase modulation. Mechanical Systems and Signal Processing, vol. 11(1), pp. 149–167.
Lee, S. K., & White, P. R. (1998). The enhancement of impulsive noise and vibration signals for fault detection in rotating and reciprocating machinery. Journal of Sound and Vibration, vol. 217(3), pp. 485–505.
Combet, F., & Gelman, L. (2009). Optimal filtering of gear signals for early damage detection based on the spectral kurtosis. Mechanical Systems and Signal Processing, vol. 23(3), pp. 652–668.
Wang, W., & Wong, A. K. (2002). Autoregressive model-based gear fault diagnosis. ASME Journal of Vibration and Acoustics, vol. 124, pp. 172–179.
Martin, N., Jaussaud, P., & Combet, F. (2004). Close shock detection using time-frequency Prony
modeling. Mechanical Systems and Signal
Processing, vol. 18(2), pp. 235–261.
Lee, J. Y., & Nandi, A. K. (2000). Extraction of impacting signals using blind deconvolution. Journal of Sound and Vibration, vol. 232(5), pp. 945–962.
Endo, H., & Randall, R. B. (2007). Enhancement of autoregressive model based gear tooth fault detection technique by the use of minimum entropy deconvolution filter. Mechanical Systems and Signal Processing, vol. 21(2), pp. 906–919.
Wang, W. J., & McFadden, P. D. (1993). Early detection of gear failure by vibration analysis—I. Calculation of the time-frequency distribution. Mechanical Systems and Signal Processing, vol. 7(3), pp. 193–203.
Forrester, B. D. (1996). Advanced Vibration Analysis Techniques for Fault Detection and Diagnosis in Geared Transmission Systems. Ph. D. Dissertation. Swinburne University of Technology, Melbourne, Australia.
Choy, F. K., Polyshchuk, V., Zakrajsek, J. J., Handschuh, R. F., & Townsend, D. P. (1996).
Analysis of the effects of surface pitting and wear on the vibration of a gear transmission system. Tribology International, vol. 29(1), pp. 77–83.
Wang, W. J. & McFadden, P. D. (1996). Application of wavelets to gearbox vibration signals for fault detection.Journal of Sound and Vibration,vol. 192 (5), pp. 927-939.
Loutridis, S. J. (2006). Instantaneous energy density as a feature for gear fault detection. Mechanical Systems and Signal Processing, vol. 20(5), pp. 1239–1253.
Halima, E. B., Shoukat Choudhuryb, M. A. A., Shaha, S. L., & Zuoc, M. J. (2008). Time domain averaging across all scales: A novel method for detection of gearbox faults. Mechanical Systems and Signal Processing, vol.22(2), pp.261–278.
Dalpiaz, G., Rivola, A., & Rubini, R. (2000). Effectiveness and sensitivity of vibration processing techniques for local fault detection in gears. Mechanical Systems and Signal Processing, vol. 14(3), pp. 387–412.
Lin, J., & Zuo, M. J. (2003). Gearbox fault diagnosis using adaptive wavelet filter. Mechanical Systems and Signal Processing, vol. 17(6), pp. 1259–1269.
Stewart, R. M. (1977). Some useful data analysis techniques for gearbox diagnostics. Institute of Sound and Vibration Research, Paper MHM/R/10/77.
McFadden, P. D. (1987). Examination of a technique for the early detection of failure in gears by signal processing of the time domain average of the meshing vibration.Mechanical Systems and Signal Processing, vol. 1(2), pp. 173–183.
Combet, F., & Gelman, L. (2007). An automated methodology for performing time-synchronous averaging of a gearbox signal without speed
sensor. Mechanical Systems and Signal
Processing, vol. 21(6), pp. 2590-2606.