www.atmos-chem-phys.net/10/12285/2010/ doi:10.5194/acp-10-12285-2010
© Author(s) 2010. CC Attribution 3.0 License.
Chemistry
and Physics
Measurements of HONO during BAQS-Met
J. J. B. Wentzell1,2,*, C. L. Schiller1,2,**, and G. W. Harris1,2 1Department of Chemistry, York University, Toronto, Ontario, Canada
2Centre for Atmospheric Chemistry, York University, Toronto, Ontario, Canada *now at: Environment Canada, Science and Technology Branch, Toronto, ON, Canada **now at: Environment Canada, Science and Technology Branch, Vancouver, BC, Canada Received: 30 April 2010 – Published in Atmos. Chem. Phys. Discuss.: 21 June 2010 Revised: 29 November 2010 – Accepted: 3 December 2010 – Published: 23 December 2010
Abstract. Measurements of nitrous acid (HONO) were per-formed as part of the 2007 Border Air Quality and Meteo-rology Study (BAQS-Met) at the Harrow, Ontario, Canada supersite between 20 June and 10 July 2007. Nitrous acid is an important precursor of the hydroxyl radical and un-derstanding its chemistry is important to unun-derstanding day-time oxidation chemistry. The HONO measurements were made using a custom built Long Path Absorption Photome-ter (LOPAP). The goal of this work was to shed light on sources of daytime HONO in the border region. During the course of the campaign HONO mixing ratios consistently ex-ceeded expected daytime values by more than a factor of 6. Mean daytime mixing ratios of 61 pptv were observed. While HONO decay began at sunrise, minimum HONO values were measured during the late afternoon. There was little dif-ference between the daytime (mean = 1.5%) and night-time (mean = 1.7%) ratios of HONO/NO2, thus there was a very strong daytime source of HONO which is consistent with other recent studies. Correlations of daytime HONO produc-tion with a variety of chemical and meteorological parame-ters indicate that production is dependent on UV radiation, NO2and water vapour but is not consistent with a simple gas phase process. Apparent rate constants for the production of HONO from photolyticaly excited NO2and water vapour vary from 2.8–7.8×10⁻¹³cm3molec−1s−1, during the cam-paign. These results appear to be consistent with the hetero-geneous conversion of NO2enhanced by photo-excitation.
Correspondence to:G. W. Harris (gharris@yorku.ca)
1 Introduction
Nitrous acid plays an important role in the atmospheric chemistry of the troposphere. Typically it follows a diurnal cycle where the mixing ratio of HONO increases at night and HONO is destroyed in the morning by photolysis (Reac-tion R1). The photolysis results in the produc(Reac-tion of the hy-droxyl radical and may be the dominant early morning source of OH (Alicke et al., 2002; Alicke et al., 2003; Harris et al., 1982; Platt et al., 1980).
HONO+hv(300−400 nm)→OH+NO (R1) In addition to HONO photolysis, OH can be produced by photolysis of ozone and formaldehyde (followed by the reac-tion of HO2with NO). OH is also a secondary product of the ozonolysis of alkenes. Nitrous acid’s contribution to the OH budget affects photochemistry in both urban and rural areas. In urban environments HONO mixing ratios can reach sev-eral parts per billion (ppbv) (Harris et al., 1982), while in ru-ral or remote environments 10’s to 100’s of parts per trillion (pptv) appear to be common (Acker et al., 2006). A study of HONO in a forest in 2005 found that HONO contributed 33% of the integrated daytime OH budget (Kleffmann et al., 2005), surpassing all other OH formation pathways.
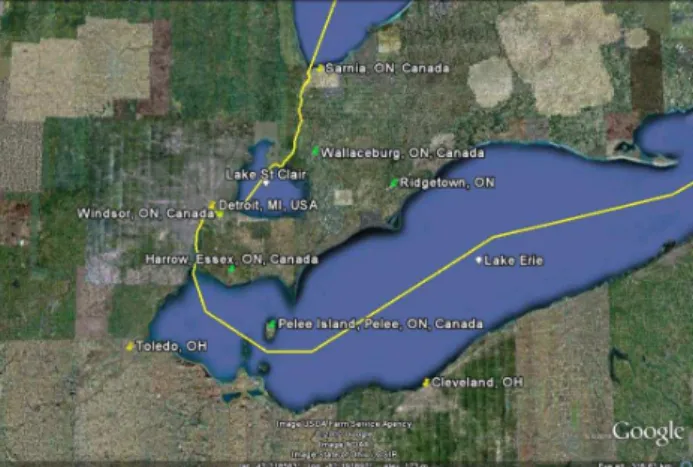
Fig. 1.Map South Western Ontario showing BAQS-Met measure-ment sites in green and industrial towns in the Lake Erie area.
relevant daytime production mechamism in the urban atmo-sphere (Bejan et al., 2006). An excellent overview of daytime HONO chemistry which examines daytime sources and sinks has been published (Kleffmann, 2007).
Here we present results HONO measurement results from the Border Air Quality Meteorology study (BAQS-Met) at the Harrow, Ontario, Canada supersite. The mixing ratios observed were higher than anticipated during the daytime hours. Daytime HONO production rates appear to be con-sistent with a heterogeneous sunlight enhanced source.
2 Experimental
2.1 Site description
During the summer of 2007 the Long Path absorption Pho-tometer (LOPAP) was deployed as part of the Border Air Quality and Meteorological Study (BAQS-Met) at the Har-row, Ontario (Essex County) supersite (42.03418,−82.9174) (Fig. 1). BAQS-Met was a major collaborative study de-signed to help understand the effects of the transborder flow of pollutants, lake effects and gas/particle processing that occur in Southern Ontario. There were three Supersite lo-cations during the study; Harrow, Ontario, Ridgetown, On-tario and Bear Creek, OnOn-tario (southwest of Wallaceburg, Ontario). Measurements were also performed at two smaller sites, one on Pelee Island, the other in Windsor, Ontario. Harrow is in close proximity to the metropolitan Detroit, Michigan and Windsor, Ontario areas. It is a semi rural lo-cation which is frequently affected by emissions from De-troit/Windsor as well from the Ohio Valley to the South and the Sarnia, Ontario region to the North.
2.2 Long Path Absorption Photometer
Nitrous acid was measured using a custom built Long Path Absorption Photometer (LOPAP) located in the middle of a grass field on the grounds of Agriculture and Agri-Food Canada’s Greenhouse and Processing Crops Research Cen-tre. The LOPAP technique has been described in detail else-where, (Heland et al., 2001; Kleffmann et al., 2002) and is therefore only briefly described here. The instrument is com-posed of two sections, a sampling unit and a detection unit. The sampling section is composed of two glass coils (17 cm of glass each) in series, one for each channel. A 0.06 M sul-fanilamide (SA) solution is pumped to and from each coil at a flow rate of 0.4 mL min−1. Air is pulled through the coils at a flow rate of 1 L min−1. No liquid is carried from chan-nel 1 to chanchan-nel 2. The liquid from each coil is pumped to debubblers where any small air bubbles are separated from the liquid. The solutions are then mixed with a 0.2 mM solu-tion of 1-naphtyl ethylennediammine dihydrohloride (NED), where an azo dye is formed from sampled NO−2. The azo dye is pumped from each channel into separate liquid core waveguides. The waveguides used were 2 m in length and purchased from World Precision Instruments (WPI LWCC, 2200). The dye can then be measured by photometry using a UV/VIS light source and a spectrometer. The light source used was a Tungsten Halogen lamp (LS-1, Ocean Optics) while the detector was a 2-channel mini-CCD spectrometer (Ocean Optics S2000). All solutions are delivered using an 8-channel peristaltic pump (Ismatec). From gas phase cali-brations it was determined that nitrous acid is sampled nearly quantitatively in the first channel (99%). Other slightly sol-uble species are sampled in both channels and the resulting interference in the 1st channel is removed by subtraction of the signal in the 2nd channel. Interferences have been dis-cussed at length by others (Kleffmann et al., 2002). A 3σ
detection limit of 5 pptv was determined for a 5 min measure-ment with the LOPAP. At the Harrow site the LOPAP was in-stalled in a trailer that contained other standard instruments for measuring gas and aerosol mixing ratios. The sampling coil was mounted outside of the trailer. During the campaign the instrument was regularly calibrated using sodium nitrite (NaNO2) standard solutions.
2.3 Other measurements
radiometer on the roof of the trailer. The estimation was based on a previously quantified relationship between the UV Radiometer and a HONO Chemical Actinometer (Wall et al., 2006). In that study a Heraeus Amersil Electrically Fused quartz cell was used as the photolysis cell on the roof of a building in Toronto, Ontario. The actinometer was set up so that known amounts of HONO could be sent through the cell to a high pressure liquid chromatograph (HPLC) detec-tion unit or diverted directly to the HPLC detecdetec-tion unit. The measured difference was used to calculate values ofJHONO. The estimated error inJHONOvalues under clear sky condi-tions was 11% at sunrise and 4% at solar noon during the summer months. Based on the error in the originalJHONO measurement (from clear sky conditions)JHONOvalues dur-ing BAQS-Met are estimated to be accurate within 20%. A list of instruments used is shown in Table 1.
3 Measurements of HONO at Harrow
Nitrous acid measurements were made between 20 June and 10 July 2007. During many nights of the campaign HONO mixing ratios built up over the course of the night and be-gan to decrease in the morning with the onset of photolysis. However, minimum HONO mixing ratios were not reached until the late afternoon and rarely decreased below detection limits (5 pptv). The mean daytime mixing ratio of HONO was 61 pptv (maximum = 473 pptv), while the mean night-time value was 102 pptv, (maximum = 376 pptv). The NO observed was almost always a small fraction of NOx. As noted the molybdenum converter in the chemiluminescence monitor can partially reduce other NOycomponents as well as NO2. The detection limit for NO was 1 ppbv.
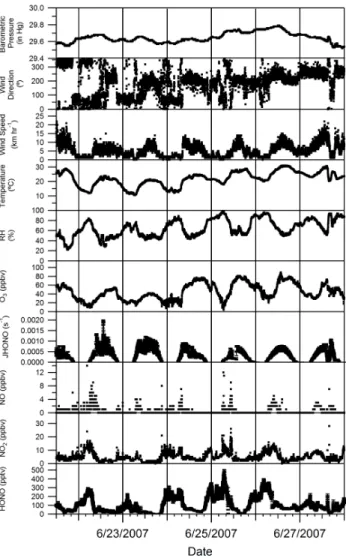
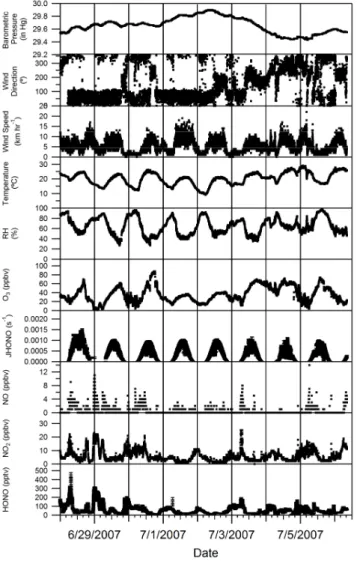
During the period of 21 to 27 June (Fig. 2), HONO mix-ing ratios consistently reached 300 pptv or more durmix-ing the night-time. The increases in HONO during this period were matched by increases in NO2mixing ratio, (as defined). As the sun rose mixing ratios would show an initial sharp de-crease in the early morning continuing more slowly through-out the day until minimum mixing ratios were reached gen-erally late in the afternoon. As the sun set (∼21:00 EST), and wind speeds decreased, HONO and NO2mixing ratio would increase. Nitrous acid mixing ratios were consistently lower between 28 June and 6 July (Fig. 3). Winds during this time were usually from the North East bringing pollution from the Sarnia, Ontario area.
On the night of 23/24 June HONO mixing ratios reached 200 pptv and remained roughly constant for the duration of the night. Since wind speeds were low that night it is not obvious why HONO mixing ratios did not rise for the du-ration of the night until the breakup of the boundary layer and onset of photolysis in the morning hours. Such be-haviour has been observed before (Stutz et al., 2002) and it was shown that NO2mixing ratios greater than 10 ppbv lead to HONO formation (positive HONO gradients) over grass
Fig. 2. Time series of the measurements of HONO, NO2, NO, JHONO, O3, relative humidity, temperature, wind speed, wind di-rection and barometric pressure at the Harrow measurement site from 21–27 June 2007.
in Milan. A compensation point in the HONO/NO2ratio of 3% was determined where HONO would begin to deposit on the grass surface under stable meteorological conditions. It was believed that NO2 was hydrolyzing on the damp grass to produce the measured HONO. This is consistent with our HONO/NO2ratios observed on the night of the 23/24 with HONO/NO2ratios between 2–4%. NO2mixing ratios were near 10 ppbv for much of this night it is likely that deposi-tion was partly controlling of the relatively constant HONO mixing ratios observed.
Table 1.List of Instrumentation at Harrow Supersite.
Species Instrument Affiliation
HONO LOPAP York University
NOx NOxanalyser (Thermo-Scientific) Ontario Ministry of the Environment O3 O3monitor (Thermo-Scientific) Ontario Ministry of the Environment JHONO(estimate) Total UV Radiometer (Eppley Labs) York University
Particle Size Distribution FMPS (TSI) University of Toronto
Figure 3: : Time series of the measurements of HONO, NO ,
Fig. 3. Time series of the measurements of HONO, NO2, NO, JHONO, O3, relative humidity, temperature, wind speed, wind di-rection and barometric pressure at the Harrow measurement site from 28 June–6 July 2007.
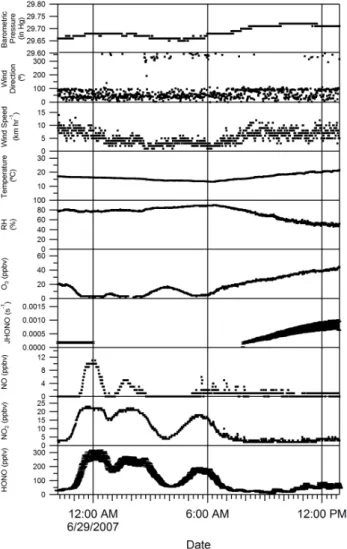
Ratios of HONO/NO2varied between 0.5–2 percent on this night. The increase in O3mixing ratio during both minima in HONO and NOxis likely due to entrainment of air from above the boundary layer diluting the HONO and NOxrich air near the ground and decreasing mixing ratios of both. It is
also possible that small changes in wind direction contributed to the decreases in NOxand HONO mixing ratio. Mixing ra-tios of HONO and NO2began to decrease on the morning of the 29th (∼06:00 local time) as O3mixing ratios increased, prior to the onset of photolysis, again suggesting entrainment from above the boundary layer.
3.1 Variations in HONO/NO2ratio during the
BAQS-Met Study
The ratio of HONO/NO2over the course of the study was ex-amined and varied between 0.06–12% (mean = 1.6%) during the campaign.
The HONO/NO2ratio can be used as an indicator of the extent of HONO production from NO2 (Kleffmann et al., 2003). Using the HONO/NO2 ratio on a night when me-teorological conditions were stable, a conversion efficiency of NO2to HONO could be calculated. On the night of the 23rd/24th the HONO/NO2 ratio increased from 0.5 to 4% over the course of a four hour period (20:00–00:00 local time) (Fig. 5). The corresponding first order conversion rate of NO2into HONO was 2.43×10⁻⁶s−1. This rate of HONO formation is comparable to values calculated from data in polluted urban sites such as Berlin (3.3×10⁻⁶s−1) and Mi-lan (5.8×10⁻⁶s−1) (Alicke et al., 2002, Alicke et al., 2003), and will be used below in our discussions of daytime HONO sources askdark.
On average the ratio of HONO/NO2did not vary greatly from the day (mean = 1.5%), to the night (mean = 1.7%), thus a daytime source converting NO2 to HONO would have to be significantly more rapid than the night-time conversion of NO2since the photolytic lifetime of HONO at midday is only 10–15 min.
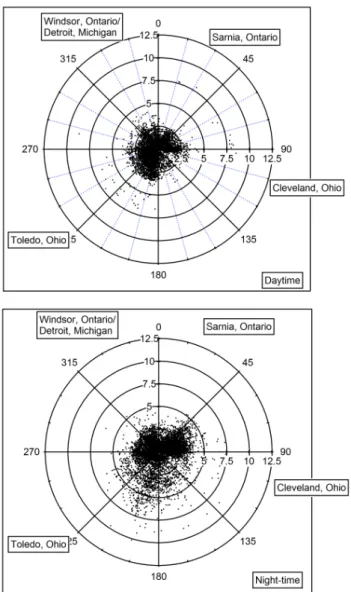
3.2 HONO/NO2ratio as a function of wind direction
Fig. 4. Measurements of HONO, NO2, NO,JHONO, O3, relative humidity, temperature, wind speed, wind direction and barometric pressure at the Harrow measurement site from 28–29 June 2007.
nearest source regions. During the daytime period the highest ratios are observed when winds are from between 180–270◦. In both cases (day and night) air masses would have to travel over Lake Erie in order to reach the Harrow site. Ratios dur-ing the daytime when winds were from either the North East or South East are lower than during the night-time hours. The night-time ratio plot shows HONO/NO2ratios>5% coming from the South and South-west. This was not often observed in the daytime data. Ratios greater than 3% are not often ob-served when winds are from 270–90◦during either the day
or the night. It is possible that increased humidity in air trav-elling over the lake may increase the conversion of NO2 to HONO.
3.3 Daytime production of HONO
Daytime production of HONO was examined closely since HONO mixing ratios remained well above detection limits
Fig. 5. Increase in HONO/NO2over the course of the evening of 23 June 2007.
during the daytime throughout the study. This cannot be ex-plained by the first order conversion rate determined in the previous section (2.43×10⁻⁶s−1), which is roughly two or-ders of magnitude slower than HONO photolysis at midday. It is not believed that there any large direct emission sources of HONO in the area of the Harrow site. There was little vehicle traffic passing the site, and no large NOx emission sources in the immediate vicinity which could account for the high daytime mixing ratios.
In order to determine the amount of HONO present that could not be accounted for by known processes during the daytime hours, a photostationary state (PSS) of HONO was assumed in order to calculate expected HONO mixing ratios. The PSS is calculated with the reaction of NO with OH to form HONO (Reaction R2) and a heterogeneous formation rate equal to the night-time conversion rate
NO+OH+M→HONO (R2)
of NO2to HONO as sources. The destruction of HONO from Reaction (R1) and in the reaction with OH Reaction (R3) are the loss processes.
HONO+OH→NO2+H2O (R3)
Thus
[HONO]PSS=(k2[NO][OH] +kdarkNO2)
J(HONO)+k3[OH]
Fig. 6.Polar plots of HONO/NO2(%) as a function of wind direc-tion. The daytime ratios are in the left plot, the night-time ratios are in the right plot. Points where wind speeds are below 5 km/hr have been removed.
dropped below the detection limit but this was not often a problem. While there are large uncertainties in the OH mix-ing ratio and other parameters, the calculated PSS values are very small in comparison to the measured daytime amount. The uncertainty in the HONO produced by identified sources mostly arises from the heterogeneous HONO formed and in the loss from photolysis, whose uncertainty is taken to be 20%. The calculated [HONO]PSS values were found to be only a few parts per trillion indicating that virtually all of the observed daytime HONO was formed through other sources. Subtracting the [HONO]PSSvalue from the measured day-time mixing ratios provides the amount of observed HONO in excess of that which can be accounted for by known processes. By modifying expression (1) by including an unknown HONO source and by replacing the value of
Table 2.TabulatedR2values for HONO production correlations.
Correlation Parameter R2
NOx 0.12
NO2 0.04
NO 0.32
JHONO 0.62
JHONO[NO2] 0.70 JHONO[NO2][H2O] 0.76
O3 0.16
Particle Surface area Density 0.31 JHONO[NO2](Particle Surface Area Density) 0.61
Relative Humidity 0.14
Wind Speed 0.21
Temperature 0.25
[HONO]PSSwith the observed excess [HONO] and rearrang-ing, a daytime rate for the unknown source could be calcu-lated and the values obtained then examined in relation to other measured parameters.
Correlation coefficients between the calculated HONO production rates and various gas, aerosol and meteoro-logical parameters are shown in Table 2. The highest values of R2 found were with JHONO, JHONO[NO2] and
JHONO[NO2][H2O]. It was anticipated that a correlation with
JHONOwould be present since the unknown source must bal-ance photolysis, however that correlation is strengthened by the inclusion of NO2and H2O mixing ratios.
The surface area density of aerosol particles was deter-mined from the particle size distribution measured with a fast mobility particle sizer using the assumption of a spher-ical particle shape. Particles measured by the instrument were in the range of 5.5 to 560 nm. The correlation between HONO production and particle surface area density alone (R2=0.31) was moderate, and not as strong as either of the correlations withJHONO[NO2] orJHONO[NO2][H2O]. How-ever theR2value againstJHONO[NO2][surface area density] is comparable to the highestR2 in Table 2 (0.61 vs. 0.76) thus, while it is likely that HONO production on aerosol sur-face is important, it is also possible that the majority of pro-duction occurred on the ground (e.g. grass or soil), or con-ceivably that production is occurring homogeneously in the gas phase as has been previously suggested (Li et al., 2008). This latter possibility is discussed in the next section.
4 Comparison with laboratory studies
4.1 Survey of laboratory studies
There have been conflicting reports as to the significance of a photo-enhanced reaction of NO2with water vapour
In a study conducted in 1997 (Crowley and Carl 1997), NO2 was excited using radiation between 430-450 nm as well as at 532 nm. OH generated by the possible reaction of NO∗2with H2O was investigated using resonance fluores-cence to monitor OH. An upper limit for the rate constant of 1.2×10⁻¹⁴cm3molec−1s−1for Reaction (R4) was deter-mined in that work.
A second simlar study performed in 2008 (Li et al., 2008) of the photo-enhancement used radiation at longer wave-lengths, 565, 590 and 612.5 nm and determined a rate con-stant for Reaction (R4) of 1.2×10⁻¹³cm3molec−1s−1.
Li et. al., 2008 used focued laser light as the photoexcita-tion source and attempts to replicate the 2008 results (Carr et al., 2009) using only unfocused laser light failed to observe any OH production. The upper limit from (Carr et al., 2009) was a factor of 17 smaller than that of Li et al.‘s 2008 result and in agreement with the earlier work (Crowley and Carl 1997). The difference in the experimental results is as yet unresolved. In this work Reaction (R4) was examined as a potential source of HONO at the Harrow site.
In order for a comparison with our calculated HONO pro-duction rates to be performed, our estimates ofJHONOwere converted to estimates of JNO∗
2. Firstly, JNO2 can be
de-rived from JHONO using a known relationship (Kraus and Hofzumahaus 1998).
J(HONO)=0.189×JNO2+8.483×10 −2J2
(NO2) (2)
Secondly,JNO∗
2is taken to be 5 times the rate of NO2
pho-tolysis (JNO2) based on the overall NO2 cross section and
the UV/VIS spectrum of sunlight (Crowley and Carl 1997). WhileJNO∗
2 is not a true photolysis rate, (it is the rate for the
excitation of NO2→NO∗2), theJNO∗
2nomenclature is used to
remain consistent with the literature. The product ofJNO∗
2
with [NO2][H2O] can be compared with the daytime HONO production rates for the Harrow data set derived in Sect. 3.3.
4.2 Apparent rate constants derived from BAQS-Met HONO data
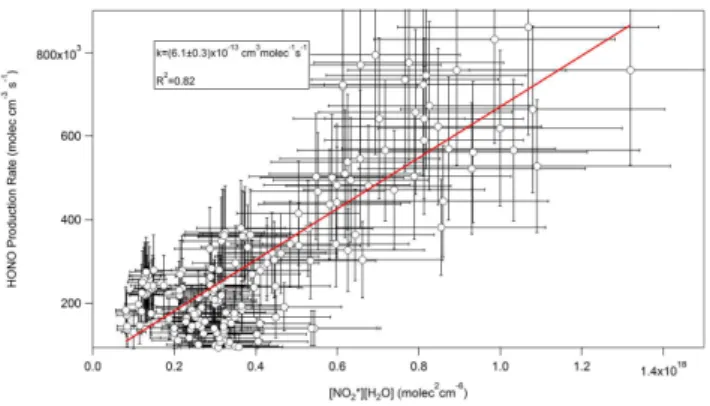
Four time periods were chosen for examination and com-parison with the laboratory rate constants for (Reaction R4) to determine whether or not (Reaction R4) in the gas phase could explain the discrepancy between the measured HONO values and the much lower photostationary state values. The time periods chosen were selected for consistency of air mass during daytime. The apparent rate constants for (Re-action R4) for the chosen periods are shown in Table 3. The rate constant plots are shown in Figs. 7–10. The error value associated with the rate constant represents 1 standard devi-ation of the apparent rate constant value.
In each case studied thekvalue is different, which would not be the case if a gas phase reaction, Reaction (R4), were responsible for the excess HONO production. The dominant wind directions were different each day (Table 3), and there-fore the sources of NO2and “fetch“ varied accordingly.
Air-Fig. 7.Plot of measured HONO production rate with the calculated product of NO∗2and water vapour for the afternoon of 21 June 2007.
Fig. 8.Plot of measured HONO production rate with the calculated product of NO∗2and water vapour for the afternoon of 24 June 2007.
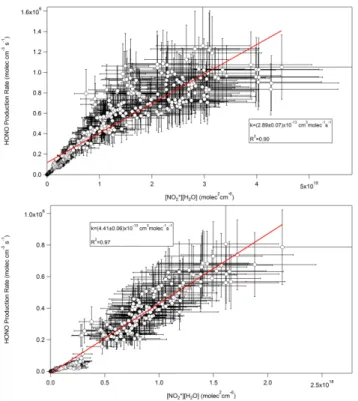
mass origins during the four periods were examined using NOAA’s HYSPLIT model to compute back trajectories (http: //www.arl.noaa.gov/ready/hysplit4.html) and confirm the air-mass origin. During the afternoon of 21 June winds were from the North West, the direction of Detroit/Windsor. A larger apparentk value was calculated for the afternoon of 24 June when winds from the South West brought air from the general direction of Toledo, Ohio. The afternoon of 24 June yielded the largest apparentkvalue. During the morn-ing of 30 June the wind directions were from the North East and gave the smallest apparentk value. Winds were from the South West during the morning of 4 July yielding an ap-parentkvalue of (4.4±0.06)×10−13cm3molec−1s−1. If the highest value of the reported homogeneous rate constants of 1.2×10⁻¹³cm3molec−1s−1is assumed (Reaction R4) could still not account for the excess HONO produced since the calculated production rate is a factor of 2–6 larger.
Table 3.List of apparent rate constants for the daytime production of HONO if assumed to occur in Reaction (R4). Also shown are dominant wind directions during the 4 selected periods of the Harrow study.
Time Period k(cm3molec−1s−1) R2 Dominant Wind Direction
All daytime data (4.5±3.5)×10−13 0.75 –
21 July 2007 (12:00–18:00 EST) (6.1±0.3)×10−13 0.82 North West 24 July 2007 (12:00–18:00 EST)) (7.8±0.3)×10−13 0.80 South West 30 June 2007 (06:00–12:00 EST) (2.9±0.07)×10−13 0.90 North East 4 July 2007 (06:00–12:00 EST) (4.4±0.06)×10−13 0.97 South West
Fig. 9. (a)Plot of measured HONO production rate with calculated product of NO∗2 and water vapour for the morning 30 June 2007 (b) Plot of measured HONO production rate with the calculated product of NO∗2and water vapour for 4 July 2007.
Taken with the highest gas phase rate suggested, our data impliy 50–85% of the HONO is present as a result of surface reactions; if the lower rate for Reaction (R4) is accepted the gas phase process is negligible.
In order to determine whether there was any enhancement over water the case of the afternoon of 24 June was exam-ined. With windspeeds lower than 10 km hr−1HONO could not be brought from the lake to the site within its midday life-time of 10 to 20 min. It is unlikely that a significant fraction of the measured HONO could be produced over the lake near midday whenJHONOis highest. Near midday the HONO ap-pears to be produced between the measurement site and the shoreline on ground surfaces and/or on particles.
5 Summary and conclusions
A custom long path absorption photometer (LOPAP) was successfully deployed to measure HONO in Southern On-tario. The instrument provided excellent sensitivity (3σ de-tection limit=5 pptv) and response time (5 min) for making high quality HONO measurements. The measurements of HONO at the Harrow site during BAQS-Met show high mix-ing ratios of daytime HONO present with a mean value of 61 pptv. These larger than anticipated daytime mixing ra-tios imply that HONO may play a larger role in the midday OH budget than originally thought. A night-time compen-sation point for heterogenous production and deposition of HONO consistent with the work of Stutz et al. (2002) was also observed when stable meterological conditions were present. Since the apparent values of a rate constant describ-ing HONO production in (Reaction R4) are large and vari-able it is likely HONO produced solely through a simple gas phase process is unimportant or negligible. Many laboratory studies have suggested efficient heterogeneous conversion of NO2 on surfaces, enhanced by photo-excitation, which ap-pears to be consistent with the Harrow data.
Acknowledgements. The authors would like to thank Greg Evans
from the University of Toronto and Nick Karellas from the Ontario Ministry of the Environment for providing measurements of parti-cle surface area densities, meteorological data, and measurements of O3and NOxfrom the Harrow site as well as Agriculture and Agri-Food Canada for the use of the site.
Edited by: J. W. Bottenheim
References
Acker, K., M¨oller, D., Wieprecht, W., Meixner, F. X., Bohn, B., Gilge, S., Plass-D¨ulmer, C., and Berresheim, H.: Strong daytime production of OH from HNO2 at a rural mountain site, Geophys. Res. Lett., 33, L02809, doi:10.1029/2005GL024643, 2006. Alicke, B., Geyer, A., Hofzumahaus, A., Holland, F., Konrad, S.,
Alicke, B., Platt, U., and Stutz, J.: Impact of nitrous acid photoly-sis on the total hydroxyl radical budget during the Limitation of Oxidant Production/Pianura Padana Produzione di Ozono study in Milan, J. Geophys. Res., 107, 8196–8213, 2002.
Bejan, I., Abd-el-Aal, Y., Barnes, I., Benter, T., Bohn, B., Wiesen, P., and Kleffmann, J.: The photolysis of ortho-nitrophenols: a new gas phase source of HONO, Phys. Chem. Chem. Phys., 8, 2028–2035, 2006.
Carr, S., Heard, D. E., and Blitz, M. A.: Comment on Atmospheric Hydroxyl Radical Production from Electronically Excited NO2 and H2O, Science, 324, 336b, 2009.
Crowley, J. N. and Carl, S. A.: OH Formation in the Photoexcitation of NO2 beyond the Dissociation Threshold in the Presence of Water Vapor, J Phys. Chem. A, 101, 4178–4184, 1997.
George, C., Strekowski, R. S., Kleffmann, J., Stemmler, K., and Ammann, M.: Photoenhanced uptake of gaseous NO2on solid organic compounds: a photochemical source of HONO?, Fara-day Discuss., 130, 195–210, 2005.
Harris, G. W., Carter, W. P. L., Winer, A. M., Pitts, J. N., Platt, U., and Perner, D.: Observations of nitrous acid in the Los Angeles atmosphere and implications for predictions of ozone-precursor relationships, Environ. Sci. Technol., 16, 414–419, 1982. Heland, J., Kleffmann, J., Kurtenbach, R., and Wiesen, P.: A New
Instrument To Measure Gaseous Nitrous Acid (HONO) in the Atmosphere, Environ. Sci. Technol., 35, 3207–3212, 2001. Kleffmann, J.: Daytime sources of nitrous acid (HONO) in the
atmospheric boundary layer, Chemphyschem, 8, 1137–1144, 2007.
Kleffmann, J., Gavriloaiei, T., Hofzumahaus, A., Holland, F., Koppmann, R., Rupp, L., Schlosser, E., Siese, M. and Wah-ner, A.: Daytime formation of nitrous acid: A major source of OH radicals in A forest, Geophys. Res. Lett., 32, L05818, doi:10.1029/2005GL022524, 2005.
Kleffmann, J., Heland, J., Kurtenbach, R., L¨orzer, J., and Wiesen, P.: A New Instrument (LOPAP) for the Measurement of Nitrous Acid (HONO), Environ. Sci. Pollut. Res., 48–54, 2002. Kleffmann, J., Kurtenbach, R., L¨orzer, J., Wiesen, P., Kalthoff, N.,
Vogel, B., and Vogel, H.: Measured and simulated vertical pro-files of nitrous acid-Part I: Field Measurements, Atmos. Environ., 37, 2949–2955, 2003.
Kraus, A. and Hofzumahaus, A.: Field Measurements of Atmo-spheric Photolysis Frequencies for O3, NO2, HCHO, CH3CHO, H2O2, and HONO by UV Spectroradiometry, J. Atmos. Chem., 31, 161–180, 1998.
Li, S., Matthews, J., and Sinha, A.: Atmospheric Hydroxyl Radical Production from Electronically Excited NO2and H2O, Science, 319, 1657–1660, 2008.
Ndour, M., D’Anna, B., George, C., Ka, O., Balkanski, Y., Kleffmann, J., Stemmler, K. and Ammann, M.: Photoen-hanced uptake of NO2 on mineral dust: Laboratory experi-ments and model simulations, Geophys. Res. Lett., 35, L05812, doi:10.1029/2007GL032006, 2008.
Platt, U., Perner, D., Harris, G. W., Winer, A. M. and Pitts, J. N.: Observations of nitrous acid in an urban atmosphere by differen-tial optical absorption, Nature, 285, 312–314, 1980.
Rohrer, F. and Berresheim, H.: Strong correlation between lev-els of tropospheric hydroxyl radicals and solar ultraviolet ra-diation, Nature, 442, 184–187, 2006.
Stemmler, K., Ammann, M., Donders, C., Kleffmann, J., and George, C.: Photosensitized reduction of nitrogen dioxide on hu-mic acid as a source of nitrous acid, Nature, 440, 195–198, 2006. Stemmler, K., Ndour, M., Elshorbany, Y., Kleffmann, J., D’Anna, B., George, C., Bohn, B., and Ammann, M.: Light induced conversion of nitrogen dioxide into nitrous acid on submi-cron humic acid aerosol, Atmos. Chem. Phys., 7, 4237–4248, doi:10.5194/acp-7-4237-2007, 2007.
Stutz, J., Alicke, B., and Neftel, A.: Nitrous acid formation in the urban atmosphere: Gradient measurements of NO2and HONO over grass in Milan, Italy, J. Geophys. Res., 107, 8192–8208, 2002.