DANIELE BOTELHO DINIZ
GENOME-WIDE ASSOCIATION STUDY FOR SPERM MOTILITY IN PIGS
Dissertation presented to the Genetics and Breeding Graduate Program of the Universidade Federal de Viçosa, in partial fulfillment of the requirements for degree of Magister Scientiae.
VIÇOSA
ii ACKNOWLEDGEMENTS
First of all I would like to thank God for all protection, force and illumination that allowed me write this dissertation and finish the studies.
I am very thankful to my parents Vera Lúcia and José Carlos that stayed with me every moment I needed, giving me all support during my masters.
Renato, my boyfriend, for all his care, love, attention and help since my under graduation.
My brothers-in-law Adriano and Mário for all worry and help with the computer analysis.
My family and friends, in special Ana Paula, Juliana and Stéphane for the affection and friendship.
My friends of Granja de Melhoramento de Suinos of UFV for all good moments, support and friendship.
Everyone, in special Renata, that directly or indirectly contributed to this dissertation with help, tips and lessons.
Universidade Federal de Viçosa for giving me the opportunity to take the course.
Genetics and Breeding Graduate Program for giving me the opportunity to do the masters and for the lessons received from the professors and courses offered. Coordenação de Aperfeiçoamento de Pessoal de Nível Superior (CAPES) for the financial support.
Professor Paulo Sávio Lopes, my advisor, for all attention, knowledge and patience since my under graduation.
Professor Fabyano Fonseca e Silva for patience, advices and help with the analysis.
Professor Simone Eliza Facioni Guimarães for the help and confidence in my work.
iii Family De Haardt for the great hospitality and Thais for the good moments during my training time in the Netherlands.
iv SUMMARY
ABBREVIATION LIST………v RESUMO………..vi ABSTRACT………..……… .viii CHAPTER 1
GENERAL INTRODUCTION……….……….2 REFERENCES………...9 CHAPTER 2
v ABBREVIATION LIST
AI Artificial Insemination
GWAS Genome Wide Association Study EBV Estimated Breeding Value FDR False Discovery Rate LD Linkage Disequilibrium MAS Marker Assisted Selection QTL Quantitative Trait Locus
vi RESUMO
DINIZ, Daniele Botelho, M.Sc., Universidade Federal de Viçosa, julho de 2013. Estudo de associação genômica ampla para motilidade espermática em suínos. Orientador: Paulo Sávio Lopes. Coorientadores: Simone Eliza Facioni Guimarães e Fabyano Fonseca e Silva.
viii ABSTRACT
DINIZ, Daniele Botelho, M.Sc., Universidade Federal de Viçosa, july, 2013. Genome-wide association study for sperm motility in pigs. Adviser: Paulo Sávio Lopes. Co-advisers: Simone Eliza Facioni Guimarães and Fabyano Fonseca e Silva.
2 GENERAL INTRODUCTION
Sperm motility
The implementation of artificial insemination (AI) in swine production was remarkably important, allowing for improved selection on boars and increasing the potential impact and importance of boar reproductive performance (Wimmers et al., 2005).
The semen quality can be evaluated according to several parameters. In general, four basic parameters are measured to evaluate boar semen quality: concentration, motility, morphology and acrosome integrity. Sperm motility, essential for fertility, is the proportion of sperm cells with a straightforward movement and is one of the most widely used tests to evaluate semen quality (Lin, 2005).
Despite the importance of boar semen quality traits, selection of boars has traditionally been done with the objective of producing the most valuable offspring, with little attention given to the reproductive fitness of the individual boar (Safranski, 2008). These boars are selected almost exclusively for growth and carcass characteristics, with minimum emphasis on semen quantity, quality or fertility (Flowers, 2008). According to Robinson and Buhr (2005), commercially important traits should not be the sole criteria for selection, because this strategy could ignore and possibly select for reduced semen quality due to the negative correlations between these traits. Therefore, semen traits, important to AI centers, should be scientifically investigated to determine heritabilities and permit their inclusion in selection methods (Wolf, 2010).
3 Reproductive traits and sperm quality traits can only be measured on boars after puberty, so marker-assisted selection could be tool of choice to improve boar fertility (Kaewmala, 2011). With the advancement in molecular techniques it is possible to increase the rate of response to selection. The possibility of realizing selection criteria on a molecular genetic level at a young age increases the accuracy and shortens the generation interval. Particularly for fertility traits, this is of greatest interest. Genotyping can be performed by using blood or tissue samples of new-born piglets; it is not necessary to wait for the puberty of candidate boars or the results obtained by their offspring (Lin, 2005).
The sperm motility can be evaluated microscopically by a technician or by objective methods, for instance the method CASA (computer assisted sperm analysis). Visual estimation of semen motility is a common laboratory test, but can generate discussion about the predictive value of fertility, its subjective nature and the human bias (Broekhuijse, 2012). Because of the need to obtain objective data for sperm motility (without the human bias), CASA was first proposed in 1979 (Dott and Foster, 1979). CASA refers to an automated system (hardware and software) to visualize and digitize successive images of sperm, process and analyze the information to provide accurate, precise, and meaningful information on the movement of individual cells or mean values of a population of sperm cells (Amann and Katz, 2004).
Some studies have been done with the objective of finding markers and genes related to boars’ sperm and fertility traits. Lin et al. (2006) investigated some candidate genes, as gonadotropin releasing hormone receptor (GNRHR), located on pig chromosome 8, for their association with sperm quality traits, including sperm motility. In total, 356 boars were included in the study. The boar population was composed of purebred Pietrain and crossbred Pietrain × Hampshire. Analysis of variance revealed significant association of GNRHR with motility.
4 genome-wide scan and QTL analysis were performed. As a result, 18 QTL were detected for the traits and one suggestive QTL on pig chromosome 1 (SSC1) was associated to sperm motility.
Kaewmala et al. (2011) selected the cluster-of-differentiation antigen 9 (CD9) gene (located on SSC5) as candidate gene for boar semen quality. This gene is expressed in the male germ line stem cells and is crucial for sperm–egg fusion. A total of 340 boars from purebred Pietrain and Pietrain × Hampshire crosses were used in this study. More than 46,000 ejaculates from these boars were obtained, including repeated measures of sperm concentration, semen volume per ejaculate, sperm motility, plasma droplets rate and abnormal spermatozoa rate. As one of the results of the study, a single nucleotide polymorphism in intron 6 of the gene was significantly associated with sperm motility.
Gunawanet al. (2011) investigated the association of estrogen receptor 1 (ESR1) gene polymorphisms with sperm quality and boar fertility traits (including sperm motility) in a total of 300 boars from purebred Pietrain and Pietrain × Hampshire crosses. A SNP in coding region of ESR1 was associated with sperm motility. This gene is located on SSC1.
Gunawan et al. (2012) studied the association of estrogen receptor 2 (ESR2) gene (located on SSC1) with boar sperm quality and fertility traits and investigated the ESR2 mRNA and protein expressions in sperm and reproductive tissues from boars with divergent phenotype. For this, they collected semen samples from Pietrain (n = 203) and Pietrain x Hampshire crossbred (n = 100) boars and used them for association analysis in this study. In brief, sperm samples of more than 31,000 ejaculates were repeatedly collected from these boars. As a result, association analysis of g.35547A>G with sperm quality and fertility traits revealed significant association with sperm motility.
Single Nucleotide Polymorphisms (SNPs)
5 nucleotide polymorphisms (SNPs). According to Brookes (1999) SNPs are single base pair positions in genomic DNA at which different sequence alternatives (alleles) exist in normal individuals in some population(s), wherein the least frequent allele has an abundance of 1% or greater. In principle, SNPs could be bi-, tri-, or tetra-allelic polymorphisms (Brookes, 1999). Although in principle, at each position of a sequence stretch, any of the four possible nucleotide bases can be present, SNPs are usually bi- allelic in practice (Vignalet al., 2002).
There are many kinds of commercial SNP chips available for domestic animals, as dogs (Illumina CanineSNP20 BeadChip and CanineHD BeadChip), cattle (Illumina BovineSNP50 BeadChip and Illumina BovineHD BeadChip), horses (Illumina EquineSNP50 BeadChip), pigs (Illumina PorcineSNP60 BeadChip - Ramos e al., 2009) and sheep (Illumina OvineSNP50 BeadChip).
Genome Wide Association Study
The first Genome Wide Association Studies were performed to study complex diseases in humans. According to Visscheret al. (2012), although the first results from a GWAS were reported in 2005and 2006,the 2007 Wellcome Trust Case Control Consortium (WTCCC) paper in Nature is taken as a starting point for these studies. The reason for this is that the WTCCC study was the first large, well-designed GWAS for complex diseases using a SNP chip that had good coverage of the genome.
According to Pearson and Manolio (2008) genome wide association studies use high-throughput genotyping technologies to assay hundreds of thousands of the most common form of the genetic variant, the single-nucleotide polymorphisms (SNPs) and relate them to measurable traits. These studies became possible to be performed in domestic animals because the development of the SNP chips and, according to Zhang et al (2012), the development of cost-effective methods for large-scale SNP analysis.
6 association studies test many SNPs covering the entire genome without mention any particular gene (Benyamin et al., 2009). Candidate gene and QTL mapping strategies have been extensively used in domestic animals for the discovery of genetic markers suitable for marker assisted selection (MAS) (Fan et al., 2010). However, these approaches have limitations. The biological mechanisms of quantitative traits are complicated. The determination of candidate genes according to their putative physiological roles is often difficult, and candidate gene approach may miss the identification of novel genes and pathways associated with some traits. The regions with identified QTL are generally large and further fine mapping is necessary, and often the consistency of results from QTL mapping is limited among different resource families (Rothschild et al., 2007).
GWAS can overcome these limitations. Because of the fact that the SNPs are spread in whole genome, in a little distance from the causative mutations, it is not necessary to work with families to follow the marker alleles through the generations. It is possible to work with any population because the possibility to occur a recombination between the marker and the causative mutation is small, so it is less probable to lose the marker.
The typical GWA study can be performed in four parts, according to Pearson and Manolo (2008): 1) selection of a large number of individuals with the trait of interest and a suitable comparison group; 2) DNA isolation, genotyping, and data review to ensure high genotyping quality; 3) statistical tests for associations between the SNPs passing quality thresholds and the trait; and 4) replication of identified associations in an independent population sample or examination of functional implications experimentally.
The GWAS assumes that significant association between a SNP and a trait can be detected because the SNPs are in linkage disequilibrium (LD) with the causative mutations for the traits of interest at the population level (Zhang et al., 2012). The LD is a non-random association between alleles at different loci. The high density of SNP markers in the chip used in GWAS was sufficient to identify the LD between SNP markers and causative mutations (Zhang et al., 2012).
7 powerful than linkage analysis. According to these authors, the detection of a QTL by linkage analysis is only feasible when the proportion of phenotypic variance accounted for by the QTL is 10% or more. On the other hand, association analysis can feasibly detect a QTL accounting for as little as 1% of the phenotypic variance, provided that the degree of linkage disequilibrium between QTL and marker is strong (r2 > 0.5). r2 is a measure for linkage disequilibrium.
Before a Genome Wide Association Analysis is performed, it is important to do the quality control in the genotypic data in order to: 1) eliminate SNPs and animals that had high density of genotyping errors during the genotyping process; 2) eliminate monomorphic SNPs and that one with low minor allele frequency (MAF), an important criterion, because rare SNP alleles are not estimated with good accuracy, they are low informative and they do not have genetic relevance in population; 3) eliminate SNPs that deviate from Hardy Weinberg Equilibrium (HWE). This last criterion is important because if some loci are not segregating according to HWE could be problematic to do a selection due to the fact that these loci can be highly influenced by population size, mutation, migration and selection (Silva, 2012).
8 smallest to largest and plotted against the expected p-values (if there were no association between marker and phenotype).
The multiple-testing problem, that appears due to a lot of tests are performed at the same time, can be solved by the use of the False Discovery Rate (FDR), which is the expected proportion of false positive results among the significant ones and is the best measure when multiple tests are performed, as mentioned above.
The results of a GWAS can be seen on the “Manhattan plots”. These graphics show every SNP represented by one dot. On the x-axis are the physical positions of the SNPs by chromosome and on the y-axis are –log10(p-values). Therefore, it is possible to identify which SNPs were significantly related to the trait studied through the GWAS, as well as their location (in which chromosome or in what position within each chromosome).
Deregressed breeding values
9 contribute to genomic prediction. Second, if any parents are segregating a major effect, about half the offspring will inherit the favorable allele and the others will inherit the unfavorable allele. However, the EBV of both kinds of offspring will be shrunk towards the parent average. When deregressed breeding values are used is important to consider the weighting factor, because, as described by Garrick et al. (2009), deregressed breeding values have heterogeneous variance when reliabilities (r2)varies between individuals.
Objective
This study was conducted with the main objective of finding markers and candidate genes in the pig genome associated with sperm motility through a GWAS in two different pig lines.
REFERENCES
AMANN, R.P.; KATZ, D.F. Reflections on CASA after 25 years. Journal of Andrology, v. 25, n. 3, p. 317-325, 2004.
BENYAMIN, B.; VISSCHER, P.M.; MCRAE, A.F. Family-based genome-wide association studies. Pharmacogenomics, v. 10, n. 2, p. 181-190, 2009.
BOLORMAA, S.; HAYES, B.J.; SAVIN, K. et al. Genome-wide association studies for feedlot and growth traits in cattle. Journal of Animal Science, v. 89, p. 1684–1697, 2011.
10 DOTT, H.M.; FOSTER, G.C. The estimation of sperm motility in semen, on a membrane slide, by measuring the area change frequency with an image analysing computer. Journal of Reproduction and Fertility, v. 55, n. 1, p. 161-166, 1979. FAN, B.; DU, Z-Q.; GORBACH, D.M. et al. Development and application of high-density SNP arrays in genomic studies of domestic animals. Asian-Australian Journal of Animal Science, v. 23, n. 7, p. 833-847, 2010.
FLOWERS, W.L. Genetic and phenotypic variation in reproductive traits of AI boars. Theriogenology, v. 70, n. 8, p. 1297-1303, 2008.
GARRICK, D.J.; TAYLOR, J.F.; FERNANDO, R.L. Deregressing estimated breeding values and weighting information for genomic regression analyses. Genetics Selection Evolution, v. 41, p. 55, 2009.
GUNAWAN, A.; KAEWMALA, K.; UDDIN, M.J. et al. Association study and expression analysis of porcine ESR1 as a candidate gene for boar fertility and sperm quality. Animal Reproduction Science, v. 128, n. 1-4, p. 11-21, 2011.
GUNAWAN, A.; CINAR, M.U.; UDDIN, M.J. et al. Investigation on association and expression of ESR2 as a candidate gene for boar sperm quality and fertility. Reproduction in Domestic Animals, v. 47, n. 5, p. 782-790, 2012.
KAEWMALA, K. Association and expression study of CD9, PLCz and COX-2 as candidate genes to improve boar sperm quality and fertility traits. 2011. 135p. Dissertation – University of Bonn, Germany.
KAEWMALA, K.; UDDIN, M.J.; CINAR, M.U. et al. Association study and expression analysis of CD9 as candidate gene for boar sperm quality and fertility traits. Animal Reproduction Science, v. 125, n. 1, p. 170-179, 2011.
LIN, C. Candidate gene analysis for loci affecting sperm quality and fertility of boar. 2005. 218p. Dissertation – University of Bonn, Germany.
LIN, C.L.; PONSUKSILI, S.; THOLEN E. et al. Candidate gene markers for sperm quality and fertility of boar. Animal Reproduction Science, v. 92, n. 3-4, p. 349-363, 2006.
MACLEOD, I.M.; HAYES, B.J.; SAVIN, K.W. et al. Power of a genome scan to detect and locate quantitative trait loci in cattle using dense single nucleotide polymorphisms. Journal of Animal Breeding and Genetics, v. 127, n. 2, p. 133-142, 2010
11 PEARSON, T.A.; MANOLIO, T.A. How to interpret a genome-wide association study. JAMA: the Journal of the American Medical Association, v. 299, n. 11, p. 1335-1344, 2008.
RAMOS, A.M.; CROOIJMANS, R.P.M.A.; AFFARA, N.A. et al. Design of a high density SNP genotyping assay in the pig using SNPs identified and characterized by next generation sequencing technology. PLoS One, v. 4, n. 8, p. e6524, 2009. ROBINSON, J.A.B.; BUHR, M.M. Impact of genetic selection on management of boar replacement. Theriogenology, v. 63, n. 2, p. 668-678, 2005.
ROTHSCHILD, M.F.; HU, Z.-L.; JIANG, Z. Advances in QTL mapping in pigs. International Journal of Biological Sciences, v. 3, n. 3, p. 192-197, 2007. SAFRANSKI, T.J. Genetic selection of boars. Theriogenology, v. 70, n. 8, p. 1310-1316, 2008.
SAHANA, G.; KADLECOVÁ, V.; HORNSHoJ, H. et al. A genome-wide association scan in pig identifies novel regions associated with feed efficiency trait. Journal of Animal Science, v. 91, p. 1041–1050, 2013.
SHAM, P.C.; CHERNY, S.S.; PURCELL, S. et al. Power of linkage versus association analysis of quantitative traits, by use of variance-components models, for sibship data. The American Journal of Human Genetics, v. 66, n. 5, p. 1616-1630, 2000.
SILVA, F. F. Seleção genômica no software R. Apostila do curso de seleção genômica no software R – Genmelhor – UFV – 19 a 23/11/2012. 23p.
VIGNAL, A.; MILAN, D.; SANCRISTOBAL, M. et al. A review on SNP and other types of molecular markers and their use in animal genetics. Genetics Selection Evolution, v. 34, n. 3, p. 275-305, 2002.
VISSCHER, P.M.; BROWN, M.A.; McCARTHY, M.I. et al. Five years of GWAS discovery. The American Journal of Human Genetics, v. 90, n. 1, p. 7-24, 2012. WIMMERS, K.; LIN, C.L.; THOLEN, E. et al. Polymorphisms in candidate genes as markers for sperm quality and boar fertility. Animal Genetics, v. 36, n. 2, p. 152-155, 2005.
WOLF, J. Heritabilities and genetic correlations for litter size and semen traits in Czech Large White and Landrace pigs. Journal of Animal Science, v. 88, n. 9, p. 2893-2903, 2010.
14 Genome-wide association study for sperm motility in pigs 1
Abstract
Sperm motility is the proportion of sperm cells with a straightforward movement and is one of the most widely used tests in order to evaluate boar semen quality. In this study the PorcineSNP60 BeadChip (Illumina, San Diego, CA, USA) was used to help identifying the association between SNP markers and sperm motility in two different pig lines, through a Genome Wide Association Study (GWAS). After quality control, a total of 42,551 SNPs (line 1) and 40,890 SNPs (line 2) were used in GWAS. A total of 602 and 525 genotyped animals for lines 1 and 2 respectively were used to perform the GWAS, that included the polygenic effect and considered the deregressed breeding values as dependent variable in the model. A False Discovery Rate based q-value ≤ 0.05 was used as threshold for significant association. Six SNPs on pig chromosome 1 (SSC1 - position 117,260,234- 119,556,999 bp) were significantly associated with the trait in line 2 and no SNPs were considered significantly associated with the trait in line 1, which can be explained by differences in linkage disequilibrium measurements between the lines. To our knowledge, this is the first time that SNP markers associated with sperm motility in pigs have been reported in this region on SSC1. The mitochondrial methionyl-tRNA formyltransferase (MTFMT) is a possible candidate gene affecting the trait on the region. This study provides SNP markers and a candidate gene associated with the trait of interest. Therefore, replication, validation in another population and confirmation of published QTL or candidate genes related to boar sperm motility in the same region where we found in this study is necessary before using such information in selection.
Keywords
Artificial insemination, semen, single nucleotide polymorphism, association analyses.
______________
15 1. Introduction
The implementation of artificial insemination (AI) in pig production was remarkably important, increasing the potential impact and importance of the boar reproductive performance.
The semen quality can be evaluated according to several parameters. Sperm motility, essential for fertility, is measured as the proportion of sperm cells with a straightforward movement and is the most widely used and important test.
Traditionally, selection and computation of estimated breeding values (EBVs) of boars have been done based on grown rate and carcass traits with the objective of producing the best offspring. Although boars’ semen quantity and quality have been evaluated on AI centers, EBVs for these traits have not been considered on selection programs. According to Robinson and Buhr (2005), commercially important traits should not be the unique criteria for selection, because this approach could ignore and select for reduced semen productions due to the negative correlations between these traits. Therefore, semen traits, important to AI centers, should be scientifically investigated to determine heritabilities and permit their inclusion in selection indices (Wolf, 2010).
The major limitation about including fertility and sperm quality traits in a breeding program is that these traits can only be measured on boars after puberty, so molecular techniques and animal genotyping using chips with high density of single nucleotide polymorphisms (SNPs) markers could be used to evaluate and improve selection on these boar traits at a young age, shortening the generation interval.
16 of estrogen receptor 1 (ESR1) gene polymorphisms with sperm quality and boar fertility traits (including sperm motility) and found a SNP in coding region of ESR1 associated with sperm motility. Gunawanet al. (2012) studied the association of estrogen receptor 2 (ESR2) gene with boar sperm motility and found a SNP in this gene significantly associated with sperm motility.
QTL linkage mapping using microsatellite markers and candidate gene approach are limited because most of the traits studied in domestic animals are complex, with many biological mechanisms involved, making difficult the determination of candidate genes according to their physiological roles, therefore missing the identification of novel genes and pathways associated with some traits. In addition, the regions with described QTL are normally large, requiring fine mapping and frequently consistency of results from QTL mapping is limited among different resource families (Rothschildet al., 2007).
Genome-wide association studies (GWAS), which can overcome these limitations, use high-throughput genotyping technologies to assay the most common form of genetic variation, the SNPs, and relate them to phenotypic traits (Pearson and Manolio, 2008). The GWAS is valuable to identify significant association between SNP markers and causative mutations and detect QTLs and candidate genes related to the traits of interest because the SNPs are in linkage disequilibrium (LD) with these causative mutations at the population level. The high density of SNP markers in the chip used in GWAS was sufficient to identify this LD (Zhang et al., 2012). The sequencing of the pig genome and the development of the pig SNP chip allowed the improvement of molecular and association studies on these animals.
17 objective of finding markers and candidate genes in the pig genome associated with sperm motility through a GWAS in two different pig lines.
2. Material and Methods
2.1 Animals and Phenotypes
The phenotypic data consisted of repeated evaluations of fresh sperm motility (sperm motility evaluated just after the semen collection) in per cent, obtained from two pure dam lines: a Landrace based line (line 1), n=760 animals and a Large White based line (line 2), n=645. The data were collected from October 2006 to December 2012, corresponding to repeated evaluations of sperm motility using the method CASA (Computer Assisted Sperm Analysis). The phenotypic database had in total 32,884 observations for line 1 and 32,576 observations for line 2, with 43.27 ± 36.81 observations per animal for line 1 and 50.51 ± 39.15 observations for line 2. Table 1 shows the descriptive statistics for semen motility measurements used to construct the phenotypic database. The pedigree file contained a total of 38,425 animals for line 1 and 38,994 for line 2, with their respective sire and dam.
Table 1
Descriptive statistics for sperm motility (%).
Line Number of observations Number of animals mean (%) SD min (%) max (%)
1 32884 760 58.3625 25.0044 10 99
2 32576 645 57.7284 25.2522 10 99
Number of observations, number of animals, mean, standard deviation (SD), minimum (min) and maximum (max) values of phenotypic database.
2.2 Genotyping and quality control
18 (Illumina, San Diego, CA, USA, Ramos et al., 2009). Among these animals, 346 from line 1 and 233 from line 2 had their own performance of fresh sperm motility. Some criteria were used to maintain the quality of the data. Related to markers, were included on the analysis only the SNPs which met the following criteria: 1) percentage of missing genotypes less than 5%, removing from the data the SNPs with high quantity of lost information; 2) minor allele frequency (MAF) greater or equal to 5%, an important criterion, because rare SNP alleles are not estimated with good accuracy, they are low informative and they do not have genetic relevance in the population; 3) deviation of observed genotype frequencies from expected frequencies according to Hardy Weinberg Equilibrium (HWE) – only SNPs that had values of calculated X2 less than 600 were included in the analysis (according to Hayes et al., 2009). High deviation from HWE can represents genotyping errors. For animals, those with a proportion of missing genotypes greater or equal to 5% were removed from the analysis. After quality control 42,551 SNPs and 1,886 genotyped animals (line 1) and 40,890 SNPs and 1,972 genotyped animals (line 2) remained for further analysis.
2.3 Statistical analysis of phenotypes
Variance components and heritabilities for both lines were estimated using a repeatability animal model in ASReml 3.0 software (Gilmouret al., 2009):
yijkl = μ + AI*yyyymmi + labj + b1 * concijkl + b2 * intijkl + b3 * ageijkl + pk + ak + eijkl
Where:
19 collected as covariate; pk is the permanent environmental effect of the kth boar; akis the additive genetic effect of the kth boar and eijkl is the residual effect.
It is assumed that p~N 0, Iσ ; a~N(0, Aσ ); ~N(0, Iσ ) where σ is the permanent environmental variance, σ is the additive genetic variance, σ is the residual variance, I is an identity matrix and A is the pedigree based relationship matrix.
The analyses were performed with the two lines separately because they are pure lines and there is no genetic connectedness between the animals. In addition, the significance of GWA analysis depends on the linkage disequilibrium between markers and causative mutations in the population level and the lines can be different regarding to LD measurements, resulting in different significant associations.
Using ASREML the breeding values (EBVs) were estimated and with R software (version 2.15.3) the deregressed breeding values were calculated for genotyped animals and used in a weighted analysis (according to the methodology described by Garrick, et al. 2009). In the literature there are some studies that have also used the deregressed breeding values as response variable in a GWAS model (Bolormaa et al., 2011; Do et al., 2013; Sahana et al., 2013).
2.4 Genome-wide association analysis
20 The analysis of variance (ANOVA) was performed to statistically analyze each marker in the association study. The “genomic inflation factor” – lambda – was calculated using the results of ANOVA and the R package GenABEL (Aulchenko et al., 2007). The lambda is the regression coefficient of observed statistic onto expected statistic. It is desirable that the lambda value will be around 1.0 to evidence that there are not confounding factors, as population structure, leading to false associations.
The False Discovery Rate (FDR) was used to correct for multiple-testing when GWAS was performed. Using the R package “qvalue” (Storey and Tibshirani, 2003), FDR-based q-values were calculated to measure the statistical significance for the association study. Q-values ≤ 0.05 were set as threshold for significant association.
The Quantile-Quantile graphics (Q-Q plots) were generated in R software. These graphics are important to help observing if there are some confounders leading to false associations between the markers and the trait.
Using the results of ANOVA, the “Manhattan plots” were generated, where was possible to identify which SNPs were significantly related to the trait studied, as well as their location (in which chromosome or in what position within each chromosome).
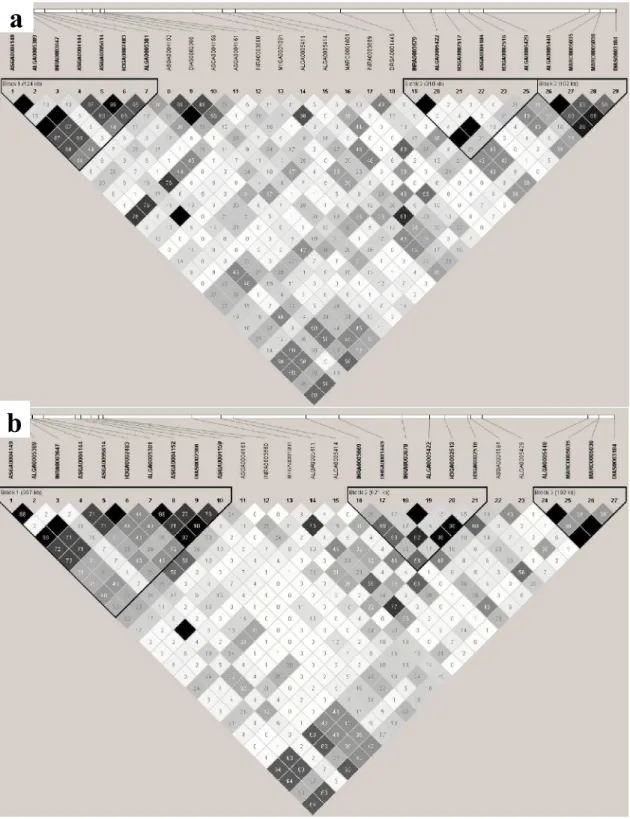
The Haploview software version 4.2 (Barret et al., 2005) was used to calculate the linkage disequilibrium (r2) between SNPs and create the LD plot for both lines, considering all the animals used in GWA analysis. The LD block was defined by the criteria of Gabriel et al. (2002). The analysis of the LD values between significant SNPs are important to help us see if significant SNPs are linked to one or more QTL. In order to evaluate the differences in LD among the lines, we compared the LD measures (r2) between the markers presented in the region among 117,260,234 and 119,556,999 bp on SSC1 for the two lines and then we calculated in R software the correlation between these LD measurements.
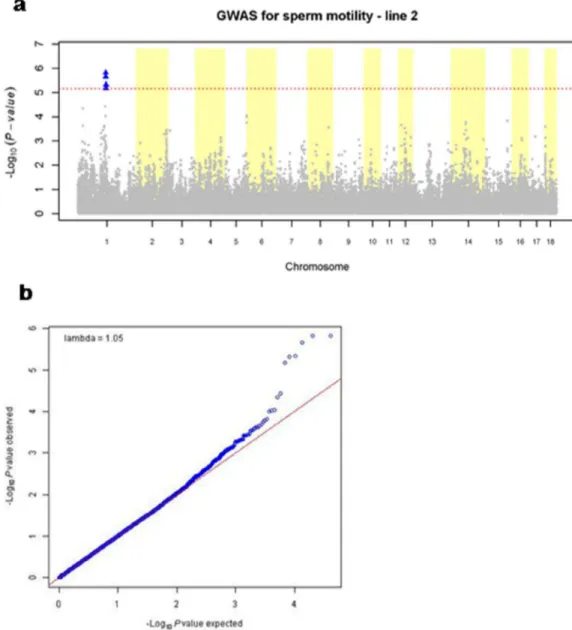
21 In the current study we performed a GWAS in order to find SNPs significantly associated with sperm motility in two different pig lines. For line 2 the calculated heritability of the trait was 0.14. The GWA analysis for this line, using the threshold for FDR-based q-value ≤ 0.05, showed that six SNPs were significantly associated with boar sperm motility. Table 2 lists these SNPs.
Table 2
Single nucleotide polymorphism that showed genome-wide significant association with boar sperm motility in line 2.
SNP Chr1 Pos2 -log10(p-value) q-value3
ALGA0005389 1 117260234 5.818307298 0.02795 ASGA0004144 1 117301395 5.818307298 0.02795 ASGA0004149 1 117234927 5.657473298 0.02795 ALGA0005448 1 119454475 5.331475895 0.036815 DIAS0003184 1 119556999 5.31598355 0.036815 MARC0005035 1 119497046 5.169731429 0.042963 Chr1= chromosome; Pos2= position on the chromosome (in base pairs); q-value3 = FDR-based q-value
22 Figure 1 (b) shows the Q-Q plot for this line. In y-axis, –log10(p-values) observed (blue dots) are plotted against –log10(p-values) expected under the null hypothesis of no association between the markers and the trait (red line).
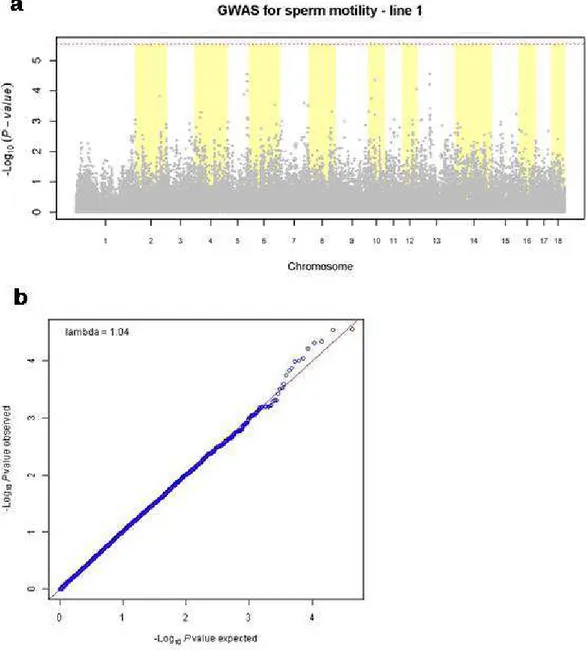
23 For line 1 the calculated heritability for the trait was 0.11. No significant SNPs were found when GWAS was performed for this line, as we can see in the Manhattan plot on Figure 2 (a). Figure 2 (b) represents the Q-Q plot for this line.
27
a
b
28 The value of the correlation between the LD measures (r2) calculated for all common SNPs presented in the region between 117,260,234 and 119,556,999 bp for both lines was 0.0926.
The average value of linkage disequilibrium (r2) between significant markers for line 2 was 0.7275, a high value, indicating that these SNPs are linked to the same QTL.
The proportion of the variance of the deregressed breeding value explained by the QTL was calculated based on allele frequencies and SNP effect of the most significant SNP of the QTL region. The result was expressed as a percentage of total deregressed breeding value variance resulted from the model used to perform the GWAS. This proportion was 4.35% for line 2.
In summary, these results demonstrate that the GWAS was powerful to detect significant SNPs associated with sperm motility for one of the pig lines studied.
4. Discussion
In this study we aimed to find SNPs associated with boar sperm motility through a GWAS in two different pig lines. SNPs located in one region on pig chromosome 1 showed significant association with sperm motility in line 2. To our knowledge, this is the first time that markers associated with sperm motility in pigs have been reported in this region (117,260,234-119,556,999 bp) on SSC1. Studies using QTL linkage mapping and candidate gene approach have described genes associated with boar sperm motility in the same chromosome (Xing et al., 2009; Gunawan et al., 2011; Gunawan et al., 2012), but in different and far away regions. Therefore, the QTL identified on SSC1 in this study may be a novel one.
29 of the pedigree information on GWAS model was robust against population stratification, but the deviation from the expected line that can be seen in figure 2 (b) was low and did not represent a significant association.
Another objective of our study was identify candidate genes related to boar sperm motility. Thus, we have examined the genes located close to the significant associated SNPs on SSC1. Several genes are presented in the region of these SNPs, but genes related to boar sperm motility trait in this region have not been reported yet in the literature. Nevertheless, some studies have been reported in humans that can help us to find new candidate genes for boar sperm motility in the region of interest. The mitochondrial methionyl-tRNA formyltransferase (MTFMT) gene is located on SSC1, position 117,634,619-117,665,093 bp. For humans, this gene has been reported as critical for efficient mitochondrial translation (Tucker et al., 2011). Gur and Breitbart (2006) using mitochondrial translation inhibitors demonstrated that protein translation in mammalian sperm involves mitochondrial but not cytoplasmatic ribosomes. The authors, in order to evaluate the physiological importance of protein synthesis in sperm, tested some semen quality traits, as sperm motility. All the traits were affected by the mitochondrial translation inhibitors and they concluded that inhibition of protein translation significantly reduced sperm motility. Making a link between these two studies, we can conclude that the normal function of mitochondrial translation is essential for normal sperm motility and if the MTFMT gene is critical for mitochondrial translation, this gene can be considered a candidate gene related to sperm motility in pigs. We could not find an association between the other genes located in the region with the trait.
30 level; 5) minor allele frequency (MAF). Regarding the number of evaluated animals, we showed that it was almost the same for both lines and the significance level used in the association test was equal for the lines. We have checked the MAF of the significant SNPs for line 2 and compared with the MAF of the same SNPs for line 1. All of them had a MAF greater or equal to 0.05 (the threshold used in this study) and there was not big differences between them (r=0.9783). We have calculated the proportion of phenotypic variance explained by the QTL just for line 2, for which we found a QTL. The correlation value (r=0.0926) between calculated LD (r2) among SNPs in the same region for both lines was low, indicating that the differences in LD among the lines could be responsible for the fact why we found six significant SNPs for one line and none for another.
31
Figure 5: SNP effects for line 1 plotted against SNP effects for line 2. The correlation
coefficient is represented as “r”.
32 The linkage disequilibrium (r2) observed for line 2 was quite high (average r2 = 0.7275) between significant markers, indicating that they may be all linked to the same QTL.
Three haplotype blocks were observed in the region among 117,260,234 and 119,556,999 bp on SSC1 for both lines in this study. Blocks 1 and 2 were different in their extension between the lines. Differences in haplotype block size can be explained by several factors, mainly differences in recombination rates in the ancestors of the population (Gabriel et al., 2002). These differences in haplotype block sizes between the lines, together with the dissimilarities in LD can help us to understand the variation in our GWAS findings among the lines.
In humans, Sham et al. (2000) showed that association analysis of very dense SNPs with phenotypes are expected to be more powerful than linkage analysis. According to these authors, the detection of a QTL by linkage analysis is only appropriate when the proportion of phenotypic variance accounted for by the QTL is 10% or more. On the other hand, GWAS can detect a QTL accounting for as little as 1% of the phenotypic variance, considering that the degree of linkage disequilibrium between QTL and marker is strong (r2 > 0.5). In this study the proportion of the variance of the deregressed breeding value (phenotypic) explained by the QTL was 4.35%, showing that the association analysis is an appropriate method for detecting QTLs.
5. Conclusion
33 trait such sperm motility, the mechanisms involved in the control of the trait and differences in animals phenotypes could be better understood.
This is the first time that SNPs associated with boar sperm motility were found in the region between 117,260,234 and 119,556,999 bp on SSC1. Therefore, replication, validation in another population and confirmation of published QTL or candidate genes related to boar sperm motility in the same region where we found in this study is necessary before using such information in selection.
Acknowledgments
The authors thank TOPIGS Research Center IPG (Beuningen, the Netherlands) for providing the data and helping with the analysis.
References
AULCHENKO, Y.S.; RIPKE, S.; ISAACS, A. et al. GenABEL: an R library for genome-wide association analysis. Bioinformatics, v. 23, n. 10, p. 1294-1296, 2007.
BARRET, J.; FRY, J.; MALLER, J. et al. Haploview: analysis and visualization of LD and haplotype maps. Bioinformatics, v. 21, p. 263-265, 2005.
BOLORMAA, S.; HAYES, B.J.; SAVIN, K. et al. Genome-wide association studies for feedlot and growth traits in cattle. Journal of Animal Science, v. 89, p. 1684–1697, 2011.
DO, D.N.; STRATHE, A.B.; OSTERSEN, T. et al. Genome-wide association study reveals genetic architecture of eating behavior in pigs and its implications for humans obesity by comparative mapping. PLoS ONE, v. 8, n. 8, p. e71509, 2013. DUIJVESTEIJN, N.; KNOL, E.F.; MERKS, J.W.M. et al. A genome-wide association study on androstenone levels in pigs reveals a cluster of candidate genes on chromosome 6. BMC Genetics, v. 11:42, p. 1:11, 2010.
34 GABRIEL, S.B., SCHAFFNER, S.F. NGUYEN, H. et al. The structure of haplotype blocks in the human genome. Science, v. 296, n. 5576, p. 2225–2229, 2002.
GARRICK, D.J.; TAYLOR, J.F.; FERNANDO, R.L. Deregressing estimated breeding values and weighting information for genomic regression analyses. Genetics Selection Evolution, v. 41, p. 55, 2009.
GILMOUR, A.R.; GOGEL, B.; CULLIS, B. et al. ASReml user guide release 3.0. VSN International Ltd, Hemel Hempstead, UK, 2009.
GUNAWAN, A.; KAEWMALA, K.; UDDIN, M.J. et al. Association study and expression analysis of porcine ESR1 as a candidate gene for boar fertility and sperm quality. Animal Reproduction Science, v. 128, n. 1-4, p. 11-21, 2011.
GUNAWAN, A.; CINAR, M.U.; UDDIN, M.J. et al. Investigation on association and expression of ESR2 as a candidate gene for boar sperm quality and fertility. Reproduction in Domestic Animals, v. 47, n. 5, p. 782-790, 2012.
GUR, Y.; BREITBART, H. Mammalian sperm translate nuclear-encoded proteins by mitochondrial-type ribosomes. Genes & Development, v. 20, n. 4, p. 411-416, 2006.
HAYES, B.J.; BOWMAN, P.J.; CHAMBERLAIN, A.J. et al. Invited review: Genomic selection in dairy cattle: progress and challenges. Journal of Dairy Science, v. 92, n. 2, p. 433-443, 2009.
KAEWMALA, K.; UDDIN, M.J.; CINAR, M.U. et al. Association study and expression analysis of CD9 as candidate gene for boar sperm quality and fertility traits. Animal Reproduction Science, v. 125, n. 1, p. 170-179, 2011.
LIN, C.L.; PONSUKSILI, S.; THOLEN E. et al. Candidate gene markers for sperm quality and fertility of boar. Animal Reproduction Science, v. 92, n. 3-4, p. 349-363, 2006.
ONTERU, S.K.; FAN, B.;DU, Z-Q. et al. A whole-genome association study for pig reproductive traits. Animal Genetics, v.43, p. 18-26, 2012.
35 RAMOS, A.M.; CROOIJMANS, R.P.M.A.; AFFARA, N.A. et al. Design of a high density SNP genotyping assay in the pig using SNPs identified and characterized by next generation sequencing technology. PLoS One, v. 4, n. 8, p. e6524, 2009. R Core Team (2012). R: A language and environment for statistical computing. R Foundation for Statistical Computing, Vienna, Austria. URL http://www.R-project.org/.
RESENDE, M.D.V. SILVA, F.F.; LOPES, P.S. et al. Seleção Genômica Ampla (GWS) via Modelos Mistos (REML/BLUP), Inferência Bayesiana (MCMC), Regressão Aleatória Multivariada e Estatística Espacial. Viçosa: Universidade Federal de Viçosa/Departamento de Estatística. 291 p. 2012.
ROBINSON, J.A.B.; BUHR, M.M. Impact of genetic selection on management of boar replacement. Theriogenology, v. 63, n. 2, p. 668-678, 2005.
ROTHSCHILD, M.F.; HU, Z.-L.; JIANG, Z. Advances in QTL mapping in pigs. International Journal of Biological Sciences, v. 3, n. 3, p. 192-197, 2007. SAHANA, G.; KADLECOVÁ, V.; HORNSHØJ, H. et al. A genome-wide association scan in pig identifies novel regions associated with feed efficiency trait. Journal of Animal Science, v. 91, n. 3, p. 1041-1050, 2013.
SHAM, P.C.; CHERNY, S.S.; PURCELL, S. et al. Power of linkage versus association analysis of quantitative traits, by use of variance-components models, for sibship data. The American Journal of Human Genetics, v. 66, n. 5, p. 1616-1630, 2000.
STOREY, J.D.; TIBSHIRANI, R. Statistical significance for genomewide studies. Proceedings of the National Academy of Sciences, v. 100, n. 16, p. 9440-9445, 2003.
TUCKER, E.J.; HERSHMAN, S.G.; KOHRER, C. et al. Mutations in MTFMT underlie a human disorder of formylation causing impaired mitochondrial translation. Cell Metabolism, v. 14, n. 3, p. 428-434, 2011.
WOLF, J. Heritabilities and genetic correlations for litter size and semen traits in Czech Large White and Landrace pigs. Journal of Animal Science, v. 88, n. 9, p. 2893-2903, 2010.
XING, Y.; REN, J.; REN, D. et al. A whole genome scanning for quantitative trait loci on traits related to sperm quality and ejaculation in pigs. Animal Reproduction Science, v. 114, n. 1, p. 210-218, 2009.