ACPD
9, 18727–18743, 2009Decadal trends in aerosol chemical composition at
Barrow, AK
P. K. Quinn et al.
Title Page
Abstract Introduction
Conclusions References
Tables Figures
◭ ◮
◭ ◮
Back Close
Full Screen / Esc
Printer-friendly Version
Interactive Discussion Atmos. Chem. Phys. Discuss., 9, 18727–18743, 2009
www.atmos-chem-phys-discuss.net/9/18727/2009/ © Author(s) 2009. This work is distributed under the Creative Commons Attribution 3.0 License.
Atmospheric Chemistry and Physics Discussions
This discussion paper is/has been under review for the journalAtmospheric Chemistry and Physics (ACP). Please refer to the corresponding final paper inACPif available.
Decadal trends in aerosol chemical
composition at Barrow, AK: 1976–2008
P. K. Quinn1, T. S. Bates1, K. Schulz1, and G. E. Shaw2
1
NOAA PMEL, 7600 Sand Point Way NE, Seattle, WA 98115, USA
2
University of Alaska, 903 Koyukuk Dr., Fairbanks, AK, 99775, USA
Received: 26 August 2009 – Accepted: 28 August 2009 – Published: 10 September 2009
Correspondence to: P. K. Quinn ([email protected])
ACPD
9, 18727–18743, 2009Decadal trends in aerosol chemical composition at
Barrow, AK
P. K. Quinn et al.
Title Page
Abstract Introduction
Conclusions References
Tables Figures
◭ ◮
◭ ◮
Back Close
Full Screen / Esc
Printer-friendly Version
Interactive Discussion
Abstract
Aerosol measurements at Barrow, AK during the past 30 years have identified the long range transport of pollution associated with Arctic Haze as well as ocean-derived aerosols of more local origin. Here, we focus on measurements of aerosol chemical composition to assess 1) trends in Arctic Haze aerosol and implications for source re-5
gions, 2) the interaction between pollution-derived and ocean-derived aerosols and the resulting impacts on the chemistry of the Arctic boundary layer, and 3) the response of aerosols to a changing climate. Aerosol chemical composition measured at Barrow, AK during the Arctic haze season is compared for the years 1976–1977 and 1997–2008. Based on these two data sets, concentrations of non-sea salt (nss) sulfate (SO=4) and 10
non-crustal (nc) vanadium (V) have decreased by about 60% over this 30 year period. Consistency in the ratios of nss SO=4/ncV and nc manganese (Mn)/ncV between the two data sets indicates that, although emissions have decreased in the source regions, the source regions have remained the same over this time period. The measurements from 1997–2008 indicate that, during the haze season, the nss SO=4 aerosol at Barrow is be-15
coming less neutralized by ammonium (NH+4) yielding an increasing sea salt aerosol chloride (Cl−) deficit. The expected consequence is an increase in the release of Cl
atoms to the atmosphere and a change in the lifetime of volatile organic compounds (VOCs) including methane. In addition, summertime concentrations of biogenically-derived methanesulfonate (MSA−) and nss SO=
4 are increasing at a rate of 12 and 8%
20
per year, respectively. Further research is required to assess the environmental factors behind the increasing concentrations of biogenic aerosol.
1 Introduction
Arctic haze, defined here as the occurrence each winter and spring of increased aerosol concentrations and decreased visibility, was reported as early as the late 1800s 25
how-ACPD
9, 18727–18743, 2009Decadal trends in aerosol chemical composition at
Barrow, AK
P. K. Quinn et al.
Title Page
Abstract Introduction
Conclusions References
Tables Figures
◭ ◮
◭ ◮
Back Close
Full Screen / Esc
Printer-friendly Version
Interactive Discussion ever, that it became possible to determine through chemical analyses that the haze
was anthropogenic in origin and was a result of long range transport from the Northern Hemisphere mid-latitudes. These early studies used ratios of tracer species to identify likely source regions with the assumption that there are regional differences in pollu-tion aerosol resulting from differences in combusted fuel, transportation, and industrial 5
activities (e.g., Rahn and Shaw, 1980; Rahn and McCaffrey, 1980). The ratio of non-crustal (nc) manganese (Mn) to nc vanadium (V) was shown to be a useful tracer of regional sources.
NcV is a tracer of mid-latitude anthropogenic activity; its most significant pollution source is combustion of heavy residual oil (Zoller et al., 1973) which is too viscous to 10
be used at cold temperatures. NcMn in the atmosphere results from a wider variety of anthropogenic activities including iron, steel, and ferro-alloy manufacturing; coal com-bustion; oil comcom-bustion; and mining (Pacyna et al., 1984). Rahn (1981) reported that the wintertime ncMn to ncV ratio was a factor of 5 higher in aerosol originating from Eu-rope than from the northeast US. The higher ratios measured in EuEu-rope were attributed 15
to the abundance of ferrous and nonferrous industries and the lower ratios in the NE US were attributed to the residual oil burned for residential heating in the winter. Based on these regional values and taking into account the expected decrease in the ratio with transport due to the different size distributions of Mn and V, Rahn (1981) concluded that Europe was a more significant source region for Arctic aerosol than the NE US. 20
Furthermore, compared to Norwegian Arctic aerosol, N. American Arctic aerosol was more influenced by a source in addition to Europe. It was suggested that the additional source was the central former Soviet Union. Raatz and Shaw (1984) confirmed that central Eurasian sources dominated the aerosol at Barrow during the winter in a fol-low up analysis that combined the 1976 to 1980 Barrow time series of ncMn and ncV 25
ACPD
9, 18727–18743, 2009Decadal trends in aerosol chemical composition at
Barrow, AK
P. K. Quinn et al.
Title Page
Abstract Introduction
Conclusions References
Tables Figures
◭ ◮
◭ ◮
Back Close
Full Screen / Esc
Printer-friendly Version
Interactive Discussion Non-seasalt (nss) sulfate (SO=4) makes up a large but variable fraction of Arctic Haze
aerosol (Quinn et al., 2007). During the winter and early spring, fossil fuel combustion in distant source regions is the primary source of nss SO=4 since biological activity is at a minimum (e.g., Ferek et al., 1995). Rahn and McCaffrey (1980) compared wintertime nss SO=4 to ncV ratios at Arctic and non-Arctic sites and found that ratios within the 5
Arctic were over an order of magnitude larger than those measured in mid-latitude source regions. They attributed the higher Arctic ratios to oxidation of mid-latitude SO2
whileenroute to Barrow resulting in an aged version of mid-latitude aerosol.
During the summer, the oxidation of biogenically-produced dimethylsulfide yields aerosol nss SO=4 and methanesulfonate (MSA−). Concentrations of MSA− due to local
10
production peak from May to September as the ice recedes and phytoplankton produc-tivity in surface waters begins (e.g., Li et al., 1993; Quinn et al., 2002). In addition, there is a rapid release of DMS from the ice into surface waters and from under the ice into the atmosphere following the ice break up (Levasseur et al., 1994; Ferek et al., 1995).
15
In this paper we compare concentrations of ncMn, ncV, nss SO=4, and ratios of tracer species measured at Barrow over the past decade to those measured during the late 1970s to assess changes in the concentrations and sources of Arctic Haze aerosol over the past 30 years. In addition, we present trends in summertime nss SO=4 and MSA− and changes in the composition of the inorganic fraction of the aerosol that
20
have occurred at Barrow over the past decade and the implications associated with this changing aerosol composition.
2 Measurements
The 1976–1977 measurements were based on High-Volume samples collected over 3 to 7 days with subsequent analysis by instrumental neutron activation (Rahn and 25
ACPD
9, 18727–18743, 2009Decadal trends in aerosol chemical composition at
Barrow, AK
P. K. Quinn et al.
Title Page
Abstract Introduction
Conclusions References
Tables Figures
◭ ◮
◭ ◮
Back Close
Full Screen / Esc
Printer-friendly Version
Interactive Discussion 1µm. Samples collected between 1997 and 2008 were analyzed for inorganic ions
(Na+, NH+4, Cl−
, SO=4, and MSA−
) by ion chromatography (Quinn et al., 1998). Sam-ples collected between 2003 and 2008 were analyzed for trace elements (including Al, V, and Mn) by thin-film X-ray primary and secondary emission spectrometry (Bates et al., 2004). Sampling during the 1997–2008 period was sector controlled such that 5
real-time wind speed and direction were used to exclude data from the locally polluted sector (130 to 360◦). More details of the sample inlet, sampling procedures, and
chem-ical analyses can be found in Delene and Ogren (2002) and Quinn et al. (2002). Given that the species considered here occur primarily in the submicrometer size range, the sampling methods used for the two different data sets should not affect the results. 10
Sea salt SO=4 concentrations were calculated from measured Na+ concentrations and the mass ratio of sulfate to sodium in seawater of 0.252 (Holland, 1978). Nss SO=4 was calculated from the difference between the total and sea salt components. Crustal V and Mn concentrations were calculated from the mass ratio of the element to Al in crustal material using the values of Mason (1966) (0.00166 for V and 0.0117 for Mn). 15
NcV and ncMn were calculated from the difference of the total and crustal V and Mn concentrations.
The existence of a monotonic increasing or decreasing trend in the time series was tested with the nonparametric Mann-Kendall test (Gilbert, 1987). The estimate for the slope of a linear trend was calculated with the nonparametric Sen’s method (Sen, 20
1968). Trends are reported for significance levels,α, of 0.01, 0.05, and 0.1 where a significance level of<0.1 indicates that the probability of no trend is 10% or less. No α is reported if the significance level is>0.1. The haze season is defined throughout as January to April and is based on the months during which Arctic haze is most pro-nounced. Summer is defined here as July to September as these are the months with 25
ACPD
9, 18727–18743, 2009Decadal trends in aerosol chemical composition at
Barrow, AK
P. K. Quinn et al.
Title Page
Abstract Introduction
Conclusions References
Tables Figures
◭ ◮
◭ ◮
Back Close
Full Screen / Esc
Printer-friendly Version
Interactive Discussion
3 Results and discussion
3.1 Non-seasalt SO=4 and non-crustal V at Barrow
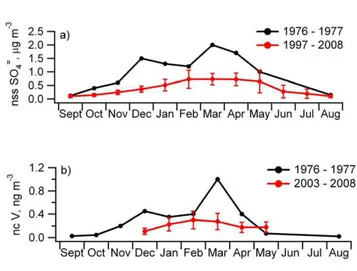
Rahn and McCaffrey (1980) published the first year-round measurements of nss SO=4 and ncV at Barrow, AK covering the period of September 1976 to September 1977. These measurements revealed the seasonality of Arctic Haze with an increase in the 5
concentration of both species in the fall, a maximum in the winter and early spring, and a decrease in late spring. More recent measurements of nss SO=4 (October 1997 to April 2008) and ncV (January 2005 to April 2008) reveal a similar seasonal cycle but overall lower concentrations (Fig. 1). The broad winter to early spring maximum in nss SO=4 has been attributed to an initial transport of anthropogenic nss SO=4 produced 10
in mid-latitude source regions and the transport and subsequent oxidation of SO2 to
SO=4 as light levels increase enroute to and within the Arctic itself (Barrie and Hoff, 1984). The nss SO=4 December maximum apparent in the earlier data set but not in the latter may be due to inter-annual variability or to a change in emissions and/or the SO2oxidation efficiency in the source regions.
15
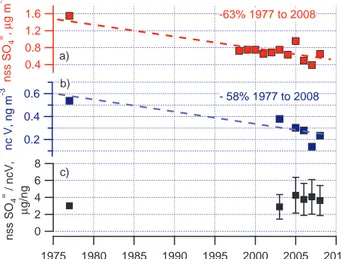
Combining the 1976-1977 and 1997–2008 data sets and performing a linear regres-sion of concentrations averaged over the haze season versus year reveals a decrease of about 60% over the past 30 years for both nss SO=4 and ncV (Fig. 2a and b). This change corresponds to a 2% decrease per year. The similarity in the haze season nss SO=4/ncV ratio for the two data sets is shown in Fig. 2c. The reported value for 1976– 20
1977 was 3 while haze season values between 2003 and 2008 ranged from 2.9 to 4.2. For comparison, wintertime values reported for the NE US and Europe are much lower at 0.28 and 0.26, respectively (Rahn and McCaffrey, 1980). The stability in the nss SO=4/ncV ratio indicates that the same source regions are being measured today as 30 years ago and that the decrease in the concentrations of nss SO=4 and ncV is, in 25
ACPD
9, 18727–18743, 2009Decadal trends in aerosol chemical composition at
Barrow, AK
P. K. Quinn et al.
Title Page
Abstract Introduction
Conclusions References
Tables Figures
◭ ◮
◭ ◮
Back Close
Full Screen / Esc
Printer-friendly Version
Interactive Discussion through 2000 (e.g., Berge et al., 1999; Erisman et al., 2003; Stern, 2005).
Changes in the frequency of transport of pollution to the Arctic and removal during transport may also have influenced measured concentrations at Barrow. Strong trans-port into the Arctic from Eurasia during winter is due, in part, to the persistence of the Siberian high (Barrie, 1986; Christensen, 1997). Weakening of the Siberian High 5
over the past quarter century (Gong and Ho, 2002) may be contributing to less pollu-tion reaching the Arctic from Eurasia. Determining the relative importance of transport frequency and removal processes will require further studies that combine modeled transport and removal with measured concentrations and known changes in emissions.
3.2 Non-crustal Mn and V at Barrow
10
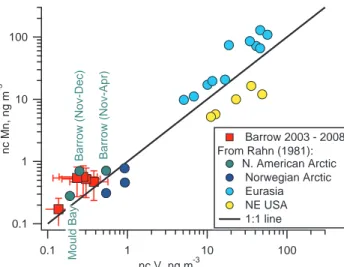
Rahn (1981) reported ncMn/ncV ratios greater than 1 for the N. American Arctic based on measurements made during the winter and spring of 1976–1978. Values reported for Barrow and Mould Bay, NWT averaged around 2 and 1.5, respectively. The ncMn/ncV ratio averaged over the haze season at Barrow between 2003 and 2008 ranged from 1.3 to 2.3. Recreating the ncV vs. ncMn scatter plot of Rahn (1981) and 15
adding the 2003–2008 data show that the recent Barrow measurements agree with the unique N. American Arctic data from 30 years ago (Fig. 3). The ncMn/ncV ratio measured at Barrow has remained in the same range and distinct from the Norwegian Arctic and the N.E. US. Again, these results indicate that emissions in the source re-gions to the Arctic have decreased over the past 3 decades but the source rere-gions 20
themselves have not changed.
3.3 Cl− deficit at Barrow
Measurements of the concentration of inorganic ions in submicrometer aerosol par-ticles have been made continuously at Barrow since the fall of 1997 allowing for the observation of changes in aerosol composition during both the haze season and dur-25
ACPD
9, 18727–18743, 2009Decadal trends in aerosol chemical composition at
Barrow, AK
P. K. Quinn et al.
Title Page
Abstract Introduction
Conclusions References
Tables Figures
◭ ◮
◭ ◮
Back Close
Full Screen / Esc
Printer-friendly Version
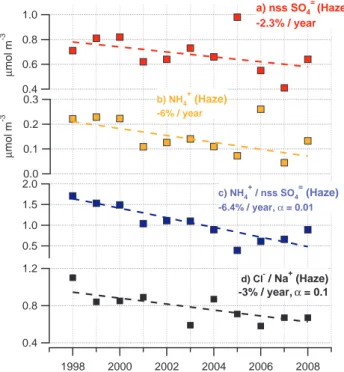
Interactive Discussion decreased by about 2% per year (Fig. 4a) and NH+4 concentrations have decreased
at a rate of 6% per year. As a result, the NH+4/nss SO=4 molar ratio has decreased by 6.4% per year (α=0.01) (Fig. 4c). Reasons for the different rates of decrease in the observed concentrations for the two species are not clear. There is observational evidence that emissions of NH3and SO2are decreasing in source regions to the Arctic
5
(e.g., Erisman et al., 1999; Berge et al., 1999). However, emissions for the Russian Federation and European Communities as used in EMEP Models indicate that SOx
emissions decreased at a higher rate between 1997 and 2008 than NH3 emissions
(Gauss et al., 2008a, b). Assessing the concentration decreases observed at Barrow will require not only accurate emission data for NH3and SOx but also quantification of
10
the reaction rate of gas phase NH3with acidic sulfate aerosol and removal of NH+4 and
SO=4 near the source region andenrouteto Barrow.
The decreasing NH+4/nss SO=4 molar ratio results in an increasingly acidic anthro-pogenic aerosol that is available to react with sea salt aerosol in the Barrow boundary layer. Figure 4d shows a decrease in the Cl− to Na+ ratio, or an increase in Cl−
deple-15
tion from the sea salt aerosol, of 3% per year (α=0.1). The correspondence of these two trends suggests that the less neutralized nss SO=4 aerosol yields an increase in the HCl displacement from the sea salt aerosol. The consequent increase in concentra-tion of Cl atoms, even at low concentraconcentra-tions, can reduce the lifetime of volatile organic compounds (VOCs) including CH4 (Platt et al., 2004), a potent greenhouse gas, and
20
impact reactions that destroy or produce O3(Knipping et al., 2003). In addition to HCl,
there is evidence that highly reactive gases such as Cl2, HOCl, and ClNO2may also volatilize from sea salt aerosol (e.g., Pszenny et al., 1993). Hence, this result has po-tentially important implications for the Cl photochemistry occurring in the near-surface Arctic atmosphere (Keene et al., 1998).
25
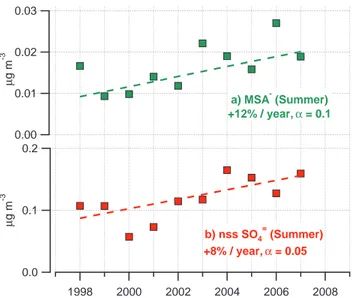
In contrast to the haze season, the summertime aerosol at Barrow is much less impacted by industrial pollutants from long range transport and more influenced by biogenic sources (e.g., Quinn et al., 2002). Concentrations of MSA−, which is derived
ACPD
9, 18727–18743, 2009Decadal trends in aerosol chemical composition at
Barrow, AK
P. K. Quinn et al.
Title Page
Abstract Introduction
Conclusions References
Tables Figures
◭ ◮
◭ ◮
Back Close
Full Screen / Esc
Printer-friendly Version
Interactive Discussion in May through September, and decrease dramatically in October. The elevated
con-centrations of MSA−
in late spring may be due to long range transport from source regions in the North Pacific (Li et al., 1993). By late June, local biogenic production of MSA− and nss SO=
4 becomes important as the ice melt begins and phytoplankton
productivity in surface waters increases. O’Dwyer et al. (2000) compared MSA−
pre-5
served in a Svalbard ice core with sea surface temperature (SST) and sea-ice extent over the period between 1920 and 1996. They found high MSA− concentrations were
associated with warm SST and reduced sea-ice extent and suggested that MSA−
con-centrations in ice cores may be useful as a proxy for past climate.
The correspondence between MSA− and past climate may also be relevant for
cur-10
rent and future changes in the Arctic. Over the past decade, there has been an increase in summertime concentrations of MSA− of 12% per year (α
=0.1) and of nss SO=4 of 8% per year (α=0.05) (Fig. 5a and b). Although it is beyond the scope of this paper to attribute these increasing trends to particular factors, the ice core results suggest that they may be due to recent decreases in sea-ice cover and increases in mean sea 15
surface temperature (SST). Further work is required to link the observed trends at Bar-row to changing environmental factors. Particle number concentrations are highest at Barrow and other surface Arctic sites during the summer (Quinn et al., 2002; Engvall et al., 2008) suggesting a link between biogenic activity and enhanced particle produc-tion. The climatic importance of the biogenically produced particles at Barrow, in terms 20
of their ability to act as cloud condensation nuclei, is yet to be determined.
4 Conclusions
A comparison of the aerosol chemical composition at Barrow, AK measured during the winter and spring of 1976–1977 and 1997–2008 indicates that the mass concentrations of species contributing to Arctic haze have decreased markedly over the past 30 years. 25
ACPD
9, 18727–18743, 2009Decadal trends in aerosol chemical composition at
Barrow, AK
P. K. Quinn et al.
Title Page
Abstract Introduction
Conclusions References
Tables Figures
◭ ◮
◭ ◮
Back Close
Full Screen / Esc
Printer-friendly Version
Interactive Discussion Measurements of concentrations of aerosol inorganic ions at Barrow over the past
decade reveal an increase in the Cl− deficit associated with sea salt aerosol. This
increased release of HCl and perhaps other additional reactive Cl-containing gases has implications for halogen chemistry in near surface air at Barrow including changes in the lifetimes of ozone, methane, DMS, and other species. In addition, summer-5
time concentrations of MSA− and nss SO=
4 at Barrow have increased over the past
decade. These increasing trends may be a result of a changing climate in the Arc-tic (e.g., warmer SST and reduced sea ice extent) and, if maintained, may affect the radiative balance within the Arctic through enhanced particle production.
Acknowledgements. We thank Dan Endres and other members of the support staffat Barrow 10
for their help in collecting samples and the Aerosols Group at NOAA’s Global Monitoring Di-vision for maintaining the sampling system. This work was supported by the NOAA Climate Program Office. This is PMEL paper contribution 3437.
References
Barrie, L. A.: Arctic air pollution: An overview of current knowledge, Atm. Env., 20, 643–663, 15
1986.
Barrie, L. A. and Hoff, R. M.: The oxidation rate and residence time of sulphur dioxide in the Arctic atmosphere, Atmos. Env., 18, 2711–2722, 1984.
Bates, T. S., Quinn, P. K., Coffman, D. J., Covert, D. S., Miller, T. L., and Johnson, J. E.: Marine boundary layer dust and pollutant transport associated with the passage of a frontal system 20
over eastern Asia, J. Geophys. Res., 109, D19S19, doi:10.1029/2003JD004094, 2004. Berge, E., J. Bartnicki, K. Olendrzynski, and S.G. Tsyro, Long-term trends in emissions and
transboundary transport of acidifying air pollution in Europe, J. Env. Man., 57, 31–50, 1999. Christensen, J. H.: The Danish eulerian hemispheric model-a three dimensional air pollution
model used for the Arctic, Atmos. Env., 31, 4169–4191, 1997. 25
Delene, D. J. and Ogren, J. A.: Variability of aerosol optical properties at four North American surface monitoring sites, J. Atmos. Sci., 59(6), 1135–1150, 2002.
ACPD
9, 18727–18743, 2009Decadal trends in aerosol chemical composition at
Barrow, AK
P. K. Quinn et al.
Title Page
Abstract Introduction
Conclusions References
Tables Figures
◭ ◮
◭ ◮
Back Close
Full Screen / Esc
Printer-friendly Version
Interactive Discussion Atmos. Chem. Phys., 8, 445–462, 2008,
http://www.atmos-chem-phys.net/8/445/2008/.
Erisman, J. W., Grennfelt, P., and Sutton, M.: The European perspective on nitrogen emission and deposition, Env. Int., 29, 311–325, 2003.
Ferek, R. J., Hobbs, P. V., Radke, L. F., Herring, J. A., Sturges, W. T., and Cota, G. F.: Dimethyl 5
sulfide in the arctic atmosphere, J. Geophys. Res., 100, 26093–26104, 1995.
Garrett, T. J. and Verzella, L. L.: An evolving history of Arctic aerosols, B. Am. Meteor. Soc., 89, 299–302, 2008.
Gauss, M., A. Nyiri, and H. Klein, Transboundary air pollution by main pollutants (S, N, O3) and PM: The Russian Federation, MSC-W Data Note 1, 2008a.
10
Gauss, M., Nyiri, A., and Klein, H.: Transboundary air pollution by main pollutants (S, N, O3) and PM: The European Community, MSC-W Data Note 1, 2008b.
Gilbert, R.O., Statistical Methods for Environmental Pollution Monitoring, Van Nostrand Rein-hold, New York, 1987.
Gong, D. Y. and Ho, C. H.: The Siberian High and climate change over middle to high latitude 15
Asia, Theo. Appl. Clim., 72 1434–4483, 2002.
Holland, J. D.: The Chemistry of the Atmosphere and Oceans, John Wiley, Hoboken, NJ, USA, p. 154, 1978.
Keene, W. C., Sander, R., Pszenny, A. A. P., Vogt, R., Crutzen, P. J., and Galloway, J. N.: Aerosol pH in the marine boundary layer: A review and model evaluation, J. Aer. Sci., 29, 20
339–356, 1998.
Knipping, E. M. and Dabdub, D.: Impact of chlorine emissions from sea-salt aerosol on coastal urban ozone, Environ. Sci. Technol., 37, 275–284, 2003.
Levasseur, M., Gosselin, M., and Michaud, S.: A new source of dimethylsulfide (DMS) for the Arctic atmosphere: Ice diatoms, Mar. Biol., 121, 381–387, 1994.
25
Li, S. M., Barrie, L. A., and Sirois, A.: Biogenic sulfate aerosol in the Arctic troposphere, 2, Trends and seasonal variation, J. Geophys. Res., 98, 20623–20631, 1993.
Lowenthal, D. H. and Rahn, K. A.: Regional sources of pollution aerosol at Barrow, Alaska during winter 1979–1980 as deduced from elemental tracers, Atmos. Environ., 19, 2011– 2024, 1985.
30
Mason, B.: Principles of Geochemistry, Wiley & Sons, New York, USA, 1966.
ACPD
9, 18727–18743, 2009Decadal trends in aerosol chemical composition at
Barrow, AK
P. K. Quinn et al.
Title Page
Abstract Introduction
Conclusions References
Tables Figures
◭ ◮
◭ ◮
Back Close
Full Screen / Esc
Printer-friendly Version
Interactive Discussion van de Wal, R. S. W.: Methanesulfonic acid in a Svalbard ice core as an indicator of ocean
climate, Geophys. Res. Lett., 27, 1159–1162, 2000.
Pacyna, J. M., Semb, A., and Hanssen, J. E.: Emission and long-range transport of trace elements in Europe, Tellus, 36B, 163–178, 1984.
Platt, U., Allan, W., and Lowe, D.: Hemispheric average Cl atom concentration from C13/C12 5
ratios in atmospheric methane, Atmos. Chem. Phys., 4, 2393–2399, 2004, http://www.atmos-chem-phys.net/4/2393/2004/.
Pszenny, A. A. P., Keene, W. C., Jacob, D. J., Fan, S., Maben, J. R., and Zetwo, M. P.: Evidence of inorganic Cl gases other than hydrogen chloride in marine surface air, Geophys. Res. Lett., 20, 699–702, 1993.
10
Quinn, P. K., Miller, T. L., Bates, T. S., Ogren, J. A., Andrews, E., and Shaw, G. E.: A 3-year record of simultaneously measured aerosol chemical and optical properties at Barrow, Alaska, J. Geophys. Res., 107(D11), 4130, doi:10.1029/2001JD001248, 2002.
Quinn, P. K., Coffman, D. J., Kapustin, V. N., Bates, T. S., and Covert, D. S.: Aerosol optical properties in the marine boundary layer during ACE 1 and the underlying chemical and 15
physical aerosol properties, J. Geophys. Res., 103, 16547–16563, 1998.
Quinn, P. K., Shaw, G., Andrews, E., Dutton, E. G., Ruoho-Airola, T., and Gong, S. L.: Arctic haze: Current trends and knowledge gaps, Tellus, 59B, 99–114, 2007.
Raatz, W. E. and Shaw, G. E.: Long-range tropospheric transport of pollution aerosols into the Alaskan Arctic, J. Clim. App. Met., 23, 1052–1064, 1984.
20
Rahn, K. A.: The Mn/V ratio as a tracer of large-scale sources of pollution aerosol for the Arctic, Atmos. Env., 15, 1457–1464, 1981.
Rahn, K. A. and R. J.: McCaffrey, On the origin and transport of the winter Arctic Aerosol, Ann. N. Y. Acad. Sci., 338, 486–503, 1980.
Rahn, K. A. and Shaw, G. E.: Sources and transport of Arctic pollution aerosol: A chronicle of 25
Six years of ONR research, Naval Res. Rev., 4–26, 1980.
Sen, P. K.: Estimates of the regression coefficient based on Kendall’s tau, J. Am. Stat. Assoc., 63, 1379–1389, 1968.
Stern, D. I.: Global sulfur emissions from 1850 to 2000, Chemo., 58, 163–175, 2005.
Zoller, W. H., Gordon, G. E., Gladney, E. S., and Jones, A. G.: The sources and distribution 30
ACPD
9, 18727–18743, 2009Decadal trends in aerosol chemical composition at
Barrow, AK
P. K. Quinn et al.
Title Page
Abstract Introduction
Conclusions References
Tables Figures
◭ ◮
◭ ◮
Back Close
Full Screen / Esc
Printer-friendly Version
Interactive Discussion
ACPD
9, 18727–18743, 2009Decadal trends in aerosol chemical composition at
Barrow, AK
P. K. Quinn et al.
Title Page
Abstract Introduction
Conclusions References
Tables Figures
◭ ◮
◭ ◮
Back Close
Full Screen / Esc
Printer-friendly Version
Interactive Discussion
1.6 1.2 0.8 0.4
nss SO
4
= ,
µ
g m
-3
2010 2005 2000 1995 1990 1985 1980 1975
0.6
0.4
0.2
nc V, ng m
-3
8 6 4 2 0
nss SO
4
= / ncV,
-63% 1977 to 2008
- 58% 1977 to 2008
a)
b)
c)
µ
g
/ng
ACPD
9, 18727–18743, 2009Decadal trends in aerosol chemical composition at
Barrow, AK
P. K. Quinn et al.
Title Page
Abstract Introduction
Conclusions References
Tables Figures
◭ ◮
◭ ◮
Back Close
Full Screen / Esc
Printer-friendly Version
Interactive Discussion 0.1
1 10 100
nc Mn, ng m
-3
0.1 1 10 100
nc V, ng m-3
Barrow 2003 - 2008 From Rahn (1981):
N. American Arctic Norwegian Arctic Eurasia NE USA 1:1 line
Mould Bay
Barrow (Nov-Apr)
Barrow (Nov-Dec)
ACPD
9, 18727–18743, 2009Decadal trends in aerosol chemical composition at
Barrow, AK
P. K. Quinn et al.
Title Page
Abstract Introduction
Conclusions References
Tables Figures
◭ ◮
◭ ◮
Back Close
Full Screen / Esc
Printer-friendly Version
Interactive Discussion
2.0
1.5
1.0
0.5
2008 2006 2004 2002 2000 1998 0.3
0.2
0.1
0.0
µ
mol m
-3
1.0
0.8
0.6
0.4
µ
mol m
-3
1.2
0.8
0.4
c) NH4+/ nss SO4= (Haze) -6.4% / year, α = 0.01
b) NH4
+ (Haze)
-6% / year
a) nss SO4= (Haze) -2.3% / year
d) Cl- / Na+ (Haze) -3% / year, α = 0.1
Fig. 4. Values of(a)nss SO=4,(b)NH+4, (c), NH+4/nss SO=4 molar ratio and(d)Cl−/Na+ molar
ACPD
9, 18727–18743, 2009Decadal trends in aerosol chemical composition at
Barrow, AK
P. K. Quinn et al.
Title Page
Abstract Introduction
Conclusions References
Tables Figures
◭ ◮
◭ ◮
Back Close
Full Screen / Esc
Printer-friendly Version
Interactive Discussion 0.03
0.02
0.01
0.00
µ
g m
-3
2008 2006 2004 2002 2000 1998 0.2
0.1
0.0
µ
g m
-3
a) MSA- (Summer) +12% / year, α = 0.1
0 b) nss SO
4 =
(Summer) +8% / year, α = 0.05
Fig. 5. Values of (a) MSA− and (b) nss SO=
4 averaged over the summertime (Jul–Sep) at