www.adv-geosci.net/31/49/2012/ doi:10.5194/adgeo-31-49-2012
© Author(s) 2012. CC Attribution 3.0 License.
Geosciences
Changes in runoff time series in Thuringia, Germany –
Mann-Kendall trend test and extreme value analysis
J. Danneberg
Chair of Geoinformatics, Geohydrology and Modelling, Friedrich-Schiller-University Jena, Germany
Correspondence to:J. Danneberg (johanna.danneberg@lfu.bayern.de)
Abstract.Qualified knowledge about the impacts of climate change on hydrology is needed for the derivation of adapta-tion measures in the water sector. As temperature and precip-itation time series in Thuringia, Germany of the last 50 years reveal that the climate is becoming warmer and drier in sum-mer and wetter in winter, the question of changes in runoff time series arises. In the presented study, simple robust anal-ysis approaches to detect changes in runoff characteristics are applied. A selection of 19 anthropogenically undisturbed Thuringian catchments with daily runoff time series of up to 78 years without gaps, covering different landscapes and cli-matic conditions in Thuringia, is made. Indicators of mean, high, and low runoff in the hydrological year, winter and summer are derived and tested for trends, using the non-parametric Mann-Kendall trend test. To analyze the impact of significant lag-1 autocorrelation (AR) in the series, a prior removal of AR from the series before testing for trend (trend-free-pre-whitening) is performed. Results show that removal of AR has only minor influence on test results and is there-fore considered as not necessary. Mean flow and high flow indicators in annual and winter time frame show increas-ing trends, escpecially in catchments in the higher regions of Thuringia like the Thuringian forest. In summer, all in-dicators show decreasing trends, especially in the drier cen-tral and northern Thuringian basin area. In order to assess changes in floods, 8 gauges, covering the 50-year time pe-riod 1949–1999, are selected. Annual maximum flow series are derived for the hydrological year, winter and summer. Af-ter fitting of 8 theoretical distributions to the samples by the method of L-moments, 3 goodness-of-fit tests are applied. Flood quantiles for the return periods 2, 5, 10, 20, 50 and 100 years are calculated from means of well fitted distri-butions for all gauges. To analyze change in flood values, the relative difference of flood quantiles in 2 time periods, 1949–1979 (TP 1) and 1969–1999 (TP 2), with respect to the whole time period 1949–1999 are calculated. Results show
that flood values have increased in the later time period in annual and winter time frame and have decreased in sum-mer.
1 Introduction
The impacts of changing climate variables on water regime and runoff characteristics have to be assessed in order to adapt to climate change, as formulated by the IPCC (e.g. Parry et al., 2007; Bates et al., 2008). Adaptation strate-gies in Germany have been published on national (Ger-man Adaptation Strategy in 2008) and regional (e.g. Bavar-ian Adaptation Strategy in 2009) level. Before taking the step of impact-modeling – using regional climate projec-tions to drive hydrological models (Fowler et al., 2007; Ma-raun et al., 2010) – a first approach in assessing possible changes in runoff is to analyze measured runoff time series (e.g. Mudelsee et al., 2006; Kundzewicz et al., 2005).
The Federal State of Thuringia in central Germany is characterized by a range of different landscapes and cli-matic conditions. The agricultural lowlands in the central and northern part receive about 400 mm precipitation annually. With annual mean temperature of about 10◦
C, the climate is much warmer and drier than in the southern midrange moun-tains of the mainly coniferous Thuringian forest, with about 7◦C annual mean temperature. Reaching altitudes of almost
the last 50 years in the lowlands. Time series of precipita-tion extremes in Western Germany show positive and neg-ative trends depending on region and season (Zolina et al., 2008). In Thuringia, a tendency of increased extreme pre-cipitation events in winter in the Thuringian forest can be detected (Bartels et al., 2005; Bernhofer et al., 2005).
Trend analyses of runoff time series, focusing on different flow indicators, have been carried out in varying European and worldwide regions (e.g. Stahl et al., 2010; Kundzewicz et al., 2005; Svensson et al., 2005; Lindstr¨om and Bergstr¨om, 2004; Robson, 2002). For Germany, Petrow and Merz (2009) found that flood events in 50-year runoff time series of sev-eral macroscale catchments reveal positive trends, especially in winter. Within the cooperation project KLIWA, changes in mean flow and hydrological extreme events in southern Ger-man catchments have been assessed. Results point to increas-ing high flow values with regional differentiation (Prellberg, 2010; KLIWA, 2008, 2003, 2002). Moreover, project results of KLIWA have led to an adaptation in dimensioning of wa-ter engineering works in Bavaria and Baden-W¨urttemberg (KLIWA, 2006). All these works lead to the underlying ques-tion of the presented study here: what effects of climate change can be detected in Thuringian runoff time series? A special focus lies on changes in occurrence, magnitude and seasonality of extreme hydrological events: flooding and low flow periods. In Sect. 2, the database and the methods of anal-yses that have been applied are presented, followed by the results in Sect. 3 and a summary in Sect. 4.
2 Data and methods
2.1 Data
All analyses of the presented study have been performed us-ing measured daily runoff data of gauges in Thurus-ingia. The time series have been kindly provided by the Thuringian En-vironment Agency (Th¨uringer Landesanstalt f¨ur Umwelt und Geologie, TLUG). Gauges were selected according to certain requirements: the time series had to cover at least 20 years, the catchment had to be without artificial water storages, no gaps were allowed in the time series, and different landscapes in Thuringia had to be represented. These requirements led to 19 gauges with mean time series covering different periods in the years from 1922 till 2005 and mean length of 48 years (Table 1). As Thuringia is a densely populated region, an-thropogenic influence on catchment hydrology, by drinking water storages or hydraulic engineering, is frequent. Even though the chosen catchments are carefully selected, anthro-pogenic influence cannot be completely ruled out at some gauges, which are marked orange in Fig. 1. In these catch-ments, the analyses of GIS data revealed some artificial lakes upstream of the gauge. Therefore, a check of homogeneity was performed by a cross-site-comparison. This consisted of visual inspection of the time series and of calculation of
Pear-son correlation coefficients between all series. A high corre-lation coefficient (>0.7) between two sites is taken as an indicator for homogeneity. It revealed that high correlation coefficients (>0.7) existed in time series of spatially close gauges. Outliers were accounted for as climate induced, as they were present in all time series of close gauges. These analyses led to the conclusion that the 19 series could be used for trend detection of climate induced changes in runoff. From the daily time series, runoff indicators for different sea-sons of the hydrological year were calculated, to account for different changes related to flow characteristics and meteo-rological variables in summer and winter. Three time frames are defined: the hydrological year (1 November–31 October), the hydrological winter (1 November–30 April), and the hy-drological summer (1 May–31 October).
For trend analysis, for each time frame, three runoff indi-cators were derived (all in m3s−1): for mean flow, the mean
daily flow in each time frame (named MQy for annual mean flow, MQw for winter mean flow and MQs for summer mean flow); for high flow, the maximum daily flow in the hydro-logical year (HQy) and the mean monthly maximum daily flow in winter (MHQw) and summer (MHQs); for low flow, the smallest mean flow in 7 consecutive days per year (LQy) and the mean monthly smallest mean flow in 7 consecutive days in winter (MLQw) and summer (MLQs). In total, this led to 171 time series for analysis.
As database for the extreme value analysis, a sub selec-tion of 8 gauges, all covering the years from 1949 to 1999, was done. Annual maximum daily stream flow series were derived for 3 time frames: hydrological year (HQy), winter (HQw), and summer (HQs). In a first step, the time period, covering 50 years, was analyzed in total (TP all). Then, all series were split: time period 1 (TP 1) covers the hydrolog-ical years 1949–1979, time period 2 (TP 2) covers the hy-drological years 1969–1999. By calculating flood values of specified return periods in the two time periods and relating them to the results from analyzing the whole time period, rel-ative changes are detected. The length of series of 30 years ensured applicability of extreme value analysis on the time series (DVWK, 1999). All series were tested for homogene-ity by application of 8 non-parametric tests. Results showed that all series were suitable for application of extreme value statistics.
2.2 Trend analysis
Table 1.Characteristics of the 19 analyzed time series, corresponding catchments and mean flow values.
Unit Mean Min Max
Length of series [year] 48 20 78 Catchment size [km2] 255 10 1013 Discharge per unit area [l s−1km−2] 10.5 2.8 32 Annual mean daily flow (MQy) [m3s−1] 2.3 0.1 11.6 Annual max. daily flow (HQy) [m3s−1] 18.1 1.1 103 Annual 7-day low flow (LQy) [m3s−1] 0.5 0.01 2.1
Fig. 1.Federal State Thuringia with selected gauges for trend analyses and extreme value analysis (see text for details).
significant at 80 %. The latter implies possibility of type 1 er-ror of 20 %, therefore, focus of interpretation lies on highly significant trends. Tendencies with lower significances were considered as no trend. The test does not offer informa-tion about the magnitude of trend. An important requirement for the correct interpretation of significance levels of Mann-Kendall test results is serial independency of the time se-ries (Helsel and Frans, 2006). Hydrological mean and low flow time series “may frequently display statistically sig-nificant serial correlation” (Yue et al., 2002). To account for this, the procedure of trend-free-pre-whitening was ap-plied, which consists of 5 steps and is described in detail in Yue et al. (2002) and Petrow and Merz (2009): first, lin-ear trends are estimated for all time series, applying a ro-bust slope estimator (after Sen, 1968, cited in Petrow and Merz, 2009). The linear trend is removed from the series in a second step by subtraction of the trend value in each time step. Next, the lag-1-autocorrelation coefficient is
cal-culated in the trend-free series. If significant autocorrelation exists, this is removed from the series by subtracting the au-tocorrelation coefficient in each time step. In the last step, the trend is readded to the autocorrelation-free series. The resulting series shows the original trend without any lag-1-autocorrelation that could possibly lead to an overestimation of trend significance. To assess the impact of autocorrelation, the Mann-Kendall test results with and without prior removal of lag-1-autocorrelation are compared.
2.3 Extreme value analysis
Gumbel (GUM), Log-Gumbel (LGU), and Generalized Ex-treme Value Distribution (GEV). Use of different distribu-tion funcdistribu-tions is recommended e.g. in DVWK (1999). Fit-ting of distributions to the annual series was done using the method of L-moments (LM), as this is recommended for small sample sizes (Klein-Tank et al., 2009). The per-formance was tested by applying 3 tests for goodness-of-fit, which are among the usual choice in flood quantile es-timation (DVWK, 1999): Kolmogorov-Smirnow (KS), nω2 (NOM) and X2 (CHI). The Null hypothesis states that the sample is a realization of the theoretical distribution. It is re-jected at a 90 % level of significance, otherwise, fitting was considered “ok”. Flood quantiles were derived at return pe-riods of 2, 5, 10, 20, 50, and 100 years. As time series in the 2 different time periods are only 30 years of lengths, the effect of possibly existing trends, which would violate the implication of identically distributed variables, is considered negligible. On the other hand, results for return periods larger than 50 years have to be considered as highly uncertain. From all distributions, the means of the calculated flood quantiles were calculated.
To account for the uncertainty of extreme value analy-sis from different distributions, several analyses were per-formed. First, flood quantiles of annual maximum flow are compared to the database of the operating institution, the Th¨uringer Landesanstalt f¨ur Umwelt (TLUG), which have kindly been provided for comparison. TLUG flood return values have been derived with varying methods from longer time series. To assess the uncertainty of the method result-ing from selection of distributions, the standard deviations of flood quantiles from all 8 distributions with respect to mean of all distributions was calculated for all flood quantiles. In a next step, means of flood quantiles were calculated using only those distributions, for which 2 of the 3 goodness-of-fit tests did not reject the Null hypothesis. By calculating the standard deviations from the mean and comparing it to the standard deviations using all distributions, a quantification of reduced uncertainty from using only “well fitted” distribu-tions was possible.
In a last step, the flood quantiles derived for the two time periods are compared and analyzed with respect to changes.
The procedure is a broad approach and results strictly have to be seen as a first indication of changes in extreme flood values. Constraints apply to the choice of extreme value dis-tributions, to the parameter fitting method, and the splitting of time series as a method for change analyses. Further infor-mation regarding mathematical foundation of different ex-treme value distributions, maximum-likelihood method for parameter estimation in small datasets and extreme value analyses in non-stationary time series can be found e.g. in Coles (2001).
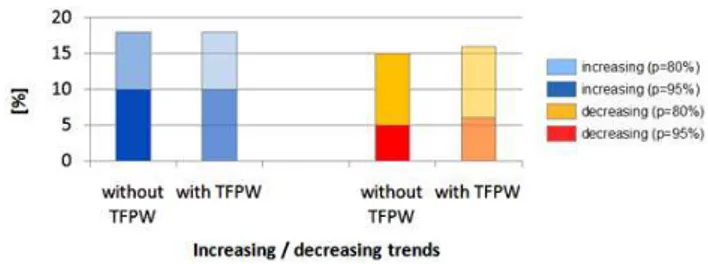
Fig. 2.Total percentage of increasing and decreasing trends in the 171 time series of all 3 runoff indicators (mean, high, low) and all 3 time frames (hydrological year, winter, summer); significant trend: p=80 %; highly significant trend: p=95 %; difference of trend results without prior removal of significant autocorrelation by trend-free-pre-whitening (TFPW) and with TFPW.
3 Results
3.1 Trends in runoff time series
Mann-Kendall trend tests of timeseries of 19 runoff gauges in Thuringia, covering time periods from 20 up to 79 years, reveal more increasing than decreasing trends. Considering the 3 time frames and 3 flow indicators that have been ana-lyzed, from the total of 171 time series, 18 % showed signifi-cant increase and 10 % showed highly signifisignifi-cant increase. In contrast, 15 % were considered decreasing and 5 % showed highly significant decrease.
As autocorrelation can influence results in terms of sig-nificance, trend analyses were also performed with prior re-moval of significant autocorrelation from the series by ap-plying trend-free-pre-whitening. This revealed that 36 % of the analyzed series have lag-1-autocorrelation at a level of significance of 90 %. Regarding flow indicators, significant autocorrelation can be detected in time series of mean and low flow, but less in high flow; regarding time frame, au-tocorrelation is present mostly in annual series, but also in hydrological summer and winter. Regarding the significance of the Mann-Kendall test results, prior removal of significant autocorrelation by trend-free-pre-whitening has very little ef-fect. For decreasing trends, 1 % more flow series are consid-ered significant and highly significant respectively (Fig. 2). From the results of the trend-free-pre-whitening procedure, it was decided that possibly present autocorrelation in the se-ries can be disregarded in this case. Therefore, the following presented results are based on the original time series.
Fig. 3.Mann-Kendall trend results in mean flow, high flow and low flow time series in Thuringian catchments; increasing and decreasing trends are considered significant at a level of significance of 80 % and highly significant at 95 %.
3.2 Extreme value analysis of high flow
Here, the results of analyses of annual time series of maxi-mum daily runoff at 8 Thuringian gauges in annual, winter and summer time frame within the hydrological years 1949– 1999 are presented.
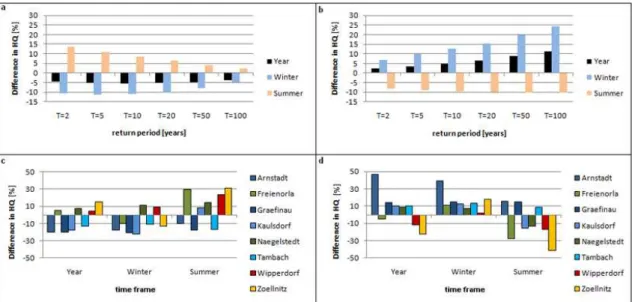
Results imply several conclusions: in the later time pe-riod (TP 2, 1969–1999), flood values are increasing in an-nual series (mean for all return periods:+6 %) and winter se-ries (+15 %) and decreasing in summer series (−3 %), when compared to the reference values from the whole time period (Fig. 4b). This stands in opposition to the earlier time period (TP 1, 1949–1979), where flood values are smaller in annual and winter series (−5 %,−3 %) and higher in summer series (+8 %) (Fig. 4a) . These results regard all considered return
periods (2, 5, 10, 20, 50 and 100 years) and most gauges (Fig. 4a–d).
In sum, the results indicate increasing flood values in an-nual and winter floods at most of the analyzed gauges in Thuringia in the years 1969–1999, when compared to the reference. For example, at gauge Arnstadt in the Thuringian forest, winter flood values show a mean increase of+40 % for all return values (Fig. 4d).
Fig. 4. (a–d)Changes in flood return values for 8 gauges in different time frames (hydrological year, winter, summer) when comparing 2 time periods (TP 1: 1949–1979; TP 2: 1969–1999) to the whole time period (TP all: 1949–1999); upper graphs: mean changes at 6 flood return periods [%] for all gauges in different time frames; lower graphs: mean changes of all flood return values [%] in different time frames at 8 gauges; left side: TP 1, compared to TP all; right side: TP 2, compared to TP all.
Moreover, at some gauges, the fitting procedure is gener-ally less successful than at others and seasonal differences can be noted. It is beyond the scope of this paper to address these issues, but differences in performance of distribution fitting to runoff time series is considered a highly relevant question.
Several analyses have been performed regarding uncer-tainty of the calculated flood values and their changes. From comparing own results with published values of the Thuringian Environment Agency (TLUG), results indicate that own values are generally lower than TLUG values, which holds true for all return periods, gauges and time peri-ods (mean difference−20 %, Fig. 5a). The reason can prob-ably be found in the longer database of the TLUG values. As a second indicator of uncertainty, the standard deviation of all flood value results at one gauge for the different re-turn periods is calculated with respect to the mean. In Fig. 5b it becomes clear that the standard deviation is similar in all time periods. This, together with the results from comparison with TLUG flood values, is interpreted as indicator of robust-ness of results. Moreover, the standard deviation is increasing with increasing return values. This supports the remark from above to consider flood values of return periods higher than 50 years only with great care. Also, in Fig. 5c, the change of standard deviation from the mean, using all distributions and only those with “ok” fit is presented. It becomes clear that from the reduction of distributions, an enhancement is achieved for all considered return periods: the standard devi-ation is reduced, which points to more homogenous results from the considered distributions.
4 Summary and conclusion
From analyzing measured runoff time series of different catchments in Thuringia, Germany, representing the spatially heterogeneous landscape and climate conditions in the wet and cold midrange mountains and the dry Thuringian basin, changes in flow characteristics are detected. Analyses in-clude Mann-Kendall trend tests of daily time series of 19 gauges, representing 48 years mean length in the time peri-ods between 1922 and 2005. Runoff indicators for mean flow, high flow and low flow show significantly increasing trends, especially in the mountainous area, in winter and through-out the year. In this region, trend analyses of measured cli-mate variables have shown that precipitation increases in winter. Flow indicators in summer show significantly de-creasing trends throughout the study area. In summer, long term climate variable time series indicate temperature in-crease and precipitation dein-crease for Thuringia. Results of the trend analyses hint to climate induced significant changes in Thuringian runoff characteristics in the past 70 years. The robustness of the results can be tested in more detailed further analyses using different methods, e.g. trend tests in splitted time series. This was not within the scope of the presented analyses here.
Fig. 5. (a–c)Results of uncertainty analyses; a: comparing own results in 6 annual flood return periods (means of 8 gauges, distributions with “ok” fit) with TLUG values in 3 time periods;(b)mean standard deviations of 6 annual flood return values (means of 8 gauges, distributions with “ok” fit) from mean in 3 time periods;(c)change in standard deviation of 6 annual flood return values (means of 8 gauges) when using only “well” fitted distribution in 3 time periods.
1969–1999) with the reference flood values of the whole time period, changes can be detected. Results indicate that flood values in Thuringia have increased in the later time period regarding the whole year (+5 %) and the winter (+15 %) but have decreased in summer (−3 %). This holds true for all re-garded return periods (2, 5, 10, 20, 50, 100 years) and most gauges.
In sum, results of the statistical tests of measured runoff time series in Thuringia indicate that high runoff has an in-creasing tendency, especially during winter flood periods. Flood values of annual maximum flow, which statistically return every 2, 5, 10, 20, 50 or 100 years, seem to be get-ting higher within this season as well. Dimensioning in wa-ter engineering might have to take such tendencies into ac-count. Low flow conditions seem to be getting more severe in Thuringia, with less runoff at the gauges for the analyzed low flow indicator in summer.
Further studies should regard results of regional climate projections with respect to their impact on runoff character-istics and water regime.
Edited by: R. Ludwig, K. Schulz, and M. Disse Reviewed by: two anonymous referees
References
Bartels, H., Dietzler, B., Malitz, G., Albrecht, F. M., and Gutten-berger, J: KOSTRA-DWD-2000, Starkniederschlagsh¨ohen f¨ur Deutschland (1951–2000), Fortschreibungsbericht, Offenbach am Main, 2005.
Bates, B. C., Kundzewicz, Z. W., and Palutikof, J. P. (Eds.): Climate Change and Water, IPCC Technical Paper VI, IPCC Secreteriat, Geneva, 2008.
Bernhofer, C., Goldberg, V., and Franke, J.: REKLI – Aufbau einer Klimadatenbank und Regionale Klimadiagnose f¨ur Th¨uringen, Abschlussbericht zum Forschungsvorhaben der Th¨uringer Lan-desanstalt f¨ur Umwelt und Geologie, Dresden, 2003.
Bernhofer, C., V. Goldberg, and Franke, J.: REKLI II. Optimierung der Klimadatenbank REKLI f¨ur Auswertungen im Bereich Wasserwirtschaft, Abschlussbericht, Institut f¨ur Hydrologie und Meteorologie, Technische Universit¨at Dresden, Dresden, 2005. Coles, S.: An Introduction to Statistical Modeling of Extreme
Val-ues, Springer, Berlin, Germany, 2001.
Deutscher Verband f¨ur Wasserwirtschaft und Kulturbau e.V. (DVWK): Statistische Analyse von Hochwasserabfl¨ussen, Ver-lag und Vertrieb Wirtschafts- und VerVer-lagsgesellschaft Gas und Wasser mbH, Bonn, 1999.
Fowler, H. J., Blenkinsop, S., and Tebaldi, C.: Review – Linking cli-mate change modelling techniques for hydrological modelling, Int. J. Climatol., 27, 1547–1578, 2007.
Helsel, D. R. and Frans, L. M.: Regional Kendall Test for Trend, Environ. Sci. Technol., 40, 4066–4073, 2006.
Klein-Tank, A. M. G., Zwiers, F. W., and Zhang, X.: Guidelines on Analysis of extremes in a changing climate in support of in-formed decisions for adaptation, Geneva, 2009.
KLIWA: Langzeitverhalten der Hochwasserabfl¨usse in Baden-W¨urttemberg und Bayern, KLIWA Heft 2, Karlsruhe, 2002. KLIWA: Langzeitverhalten der mittleren Abfl¨usse in
Baden-W¨urttemberg und Bayern, KLIWA Heft 3, Karlsruhe, 2003. KLIWA: Regionale Klimaszenarien f¨ur S¨uddeutschland.
Ab-sch¨atzung der Auswirkungen auf den Wasserhaushalt, KLIWA Heft 9, Mannheim, 2006.
KLIWA: Monitoringbericht 2008, Karlsruhe, Hof, Mainz, 2008. Kundzewicz, Z. W. and Robson, A. J.: Change detection in
hydro-logical records – a review of the methodology, Hydrolog. Sci. J., 49, 7–19, 2004.
Kundzewicz, Z. W., Graczyk, D., Maurer, T., Pinskwar, I., Radziejewski, M., Svensson, C., and Szwed, M.: Trend detection in river flow series: 1. Annual maximum flow, Hydrolog. Sci. J., 50, 797–810, 2005.
Lindstr¨om, G. and Bergstr¨om, S.: Runoff trends in Sweden 1807– 2002, Hydrolog. Sci. J., 49, 69–83, 2004.
Maraun, D., Wetterhall, F., Ireson, A. M., Chandler, R. E., Kendon, E. J., Widmann, M., Brienen, S., Rust, H. W., Sauter, T., The-meßl, M., Venema, V. K. C., Chun, K. P., Goodess, C. M., Jones, R. G., Onof, C., Vrac, M., and Thiele-Eich, I.: Precipita-tion downscaling under climate change: recent developments to bridge the gap between dynamical models and the end user, Rev. Geophys., 48, RG3003, doi:10.1029/2009RG000314, 2010. Mudelsee, M., Deutsch, M., B¨orngen, M., and Tetzlaff, G.: Trends
in flood risk of the River Werra (Germany) over the past 500 years, Hydrolog. Sci. J., 51, 818–833, 2006.
Prellberg, D.: Langj¨ahrige Hochwasserabfl¨usse in Rheinland-Pfalz, in: KLIWA: 4. KLIWA-Symposium am 3. und 4. Dezember 2009 in Mainz, Fachvortr¨age, Klimaver¨anderung und Konse-quenzen f¨ur die Wasserwirtschaft, KLIWA-Heft 15, Karlsruhe, Hof, Mainz, 2010.
Petrow, T. and Merz, B: Trends in flood magnitude, frequency and seasonality in Germany in the period 1951–2002, J. Hydrol., 371, 129–141, 2009.
Robson, A. J.: Evidence for trends in UK flooding, Philos. T. R. Soc. A, 360, 1327–1343, 2002.
Svensson, C., Kundzewicz, Z. W., and Maurer, T.: Trend detection in river flow series: 2. Flood and low-flow index series, Hydrolog. Sci. J., 50 (5), 811 – 824, 2005.
Stahl, K., Hisdal, H., Hannaford, J., Tallaksen, L. M., van Lanen, H. A. J., Sauquet, E., Demuth, S., Fendekova, M., and J´odar, J.: Streamflow trends in Europe: evidence from a dataset of near-natural catchments, Hydrol. Earth Syst. Sci., 14, 2367–2382, doi:10.5194/hess-14-2367-2010, 2010.
Yue, S., Pilon, P., Phinney, B., and Cavadias, G.: The influence of autocorrelation on the ability to detect trend in hydrological se-ries, Hydrol. Process., 16, 1807–1829, 2002.