UNIVERSIDADE FEDERAL DO RIO GRANDE DO NORTE CENTRO DE BIOCIÊNCIAS
PROGRAMA DE PÓS-GRADUAÇÃO EM PSICOBIOLOGIA
LUCIANA HELENA SILVA ROCHA
WHEN WOLVES CRY:
LONG DISTANCE CALLING BY WILD MANED WOLVES
Dissertação apresentada à Universidade Federal do Rio Grande do Norte, para obtenção do título de Mestre em Psicobiologia.
LUCIANA HELENA SILVA ROCHA
WHEN WOLVES CRY:
LONG DISTANCE CALLING BY WILD MANED WOLVES
Dissertação apresentada à Universidade Federal do Rio Grande do Norte, para obtenção do título de Mestre em Psicobiologia.
Orientadora: Profa. Dra. Renata Santoro de Sousa Lima Mobley Co-orientador: Prof. Dr. Flávio Henrique Guimarães Rodrigues
Catalogação da Publicação na Fonte. UFRN / Biblioteca Setorial do Centro de Biociências
Rocha, Luciana Helena Silva.
When wolves cry: long distance calling by wild maned wolves / Luciana Helena Silva Rocha. – Natal, RN, 2015.
82 f.: il.
Orientadora: Profa. Dra. Renata Santoro de Sousa Lima Mobley. Coorientador: Prof. Dr. Flávio Henrique Guimarães Rodrigues.
Dissertação (Mestrado) – Universidade Federal do Rio Grande do Norte. Centro de Biociências. Programa de Pós-Graduação em Psicobiologia.
1. Lobo-guará.– Dissertação. 2. Atividade vocal. – Dissertação. 3. Detecção automática.
– Dissertação. 4. Monitoramento Acústico Passivo. – Dissertação. I. Mobley, Renata Santoro de Sousa Lima. II. Rodrigues, Flávio Henrique Guimarães. III. Universidade Federal do Rio Grande do Norte. IV. Título.
Título: When wolves cry: long distance calling by wild maned wolves
Autor: Luciana Helena Silva Rocha
Data da defesa: 25 de maio de 2015.
Banca Examinadora:
___________________________________
Profa. Dra. Susan Elizabeth Parks Syracuse University, EUA
___________________________________
Prof. Dr. Artur Andriolo
Universidade Federal de Juiz de Fora, MG
___________________________________
Prof. Dr. Flávio Henrique Guimarães Rodrigues Universidade Federal de Minas Gerais, MG
___________________________________
AGRADECIMENTOS
Ao Programa de Pós-graduação em Psicobiologia da UFRN, pela oportunidade
de realizar esse mestrado e pelo auxílio financeiro para coletas de dados e
participação em eventos;
Ao Conselho Nacional de Desenvolvimento Científico e Tecnológico (CNPq)
e ao grupo Idea Wild pelo suporte financeiro e pelos equipamentos concedidos
a esse projeto;
À minha orientadora Renata S. Sousa-Lima, por acreditar em mim e ter me
deixado responsável por esse projeto tão importante. Agradeço imensamente
pelos momentos de aprendizado e por ter me guiado nesse primeiro contato
com a bioacústica, área pela qual hoje tenho grande carinho e admiração;
Ao meu co-orientador Flávio Rodrigues, pela companhia e ensinamentos em
campo e por me ajudar a tentar compreender melhor a natureza do lobo.
Agradeço por todo o suporte em Minas Gerais e pelas histórias de viagens
incríveis que também espero fazer um dia;
À Dra. Susan Parks e ao Dr. Artur Andriolo, pela presença na banca e por
todas as sugestões para melhoria do trabalho;
A todos os membros do Laboratório de Bioacústica (LaB-UFRN), pelas
interessantes discussões acadêmicas e pelos momentos de descontração;
A todo o pessoal de Minas que contribuiu de alguma forma para a realização
desse projeto: Luiz Cristiano e família, Marina Duarte, Victor Sábato, Jean
Santos, Flávia e demais integrantes do projeto Pato-Mergulhão e os
funcionários do Parque Nacional da Serra da Canastra. Muito obrigada!
À minha família, em especial meus pais, pela torcida e apoio em todas as
etapas da minha vida. Minhas conquistas também são suas!
A Jaqueiuto Jorge, meu namorado, por ter trilhado esse caminho junto comigo.
Certamente você foi uma das melhores coisas que esse mestrado me trouxe.
Agradeço demais pelos conselhos, pelo apoio nos momentos difíceis e por
todo o carinho e atenção;
A todos que constituem a Pós-graduação em Enfermagem, local onde trabalho,
pela torcida e por serem sempre compreensivos com as demandas que esse
mestrado me trouxe. Um agradecimento especial a Matheus Batista pelas
ajudas com o Excel;
A Matheus Meira-Ribeiro, por me dar de presente o mapa com o local de
coleta dos meus dados;
E a todos aqueles que torceram por mim e se interessaram pelo nosso trabalho
DEDICATÓRIA
Dedico esse trabalho à minha avó Bebé, exemplo de força e caráter, que partiu
deixando muitas saudades. Sempre me lembrarei de sua alegria contagiante e
RESUMO
O lobo-guará (Chrysocyon brachyurus Illiger 1815) é o maior canídeo da
América do Sul e encontra-se quase-ameaçado de extinção segundo a IUCN.
Por ser uma espécie noturna, territorial e com hábitos solitários, ainda há
muitos aspectos pouco estudados sobre seu comportamento em ambiente
natural, entre eles a comunicação acústica. Em seu repertório vocal, o lobo
apresenta a vocalização de longa-distância chamada de “aulido” a qual, segundo a literatura, tem função de manutenção do espaçamento entre
indivíduos e/ou comunicação entre os membros do par reprodutivo dentro do
território. Nesse contexto, esse estudo teve como objetivos: 1) comparar quatro
métodos de detecção dos aulidos de lobo-guará em gravações feitas em
ambiente natural, buscando eleger o mais eficiente para nosso projeto; 2)
entender como se dá o padrão noturno de emissão dessas vocalizações,
verificando se as condições climáticas e as fases da lua influenciam nas taxas
de emissão de aulidos; e 3) testar o Monitoramento Acústico Passivo como
ferramenta na identificação da presença de lobos-guará em ambiente natural. A
área de estudo foi o Parque Nacional da Serra da Canastra (Minas Gerais,
Brasil) e foram utilizados gravadores autônomos para aquisição dos sons, os
quais gravaram durante toda a noite (18h-06h) durante cinco dias de
dezembro/2013 e durante todos os dias dos meses de abril a julho/2014. Os
métodos de detecção de aulidos foram testados e comparados com relação ao
tempo necessário para analisar os arquivos, número de falsos positivos e
número de aulidos corretamente identificados. O método misto
(XBAT+manual) foi o mais eficiente, encontrando 100% das vocalizações em
quase metade do tempo do método manual, e foi eleito para análise dos nossos
dados. O estudo da variação temporal da emissão de aulidos verificou que os
social importante para esses chamados no início de seu período de atividade
mais intenso. A velocidade média do vento influenciou negativamente a
frequência de vocalizações, o que pode indicar baixa recepção sonora dos
gravadores ou alteração nos padrões comportamentais dos lobos em condições
de ventos fortes. É necessário um melhor entendimento da variação sazonal da
atividade vocal dos lobos-guará, mas nosso estudo já demonstra ser possível
detectar padrões comportamentais de animais selvagens apenas através do
som, validando o Monitoramento Acústico Passivo como ferramenta na
conservação dessa espécie.
Palavras-chave: Lobo-guará, Chrysocyon brachyurus, detecção manual,
detecção automática, atividade vocal, variação noturna, Monitoramento Acústico
ABSTRACT
The maned wolf (Chrysocyon brachyurus Illiger 1815) is the biggest canid in
South America and it is considered a “near threatened” species by IUCN.
Because of its nocturnal, territorial and solitary habits, there are still many
understudied aspects of their behavior in natural environments, including
acoustic communication. In its vocal repertoire, the wolf presents a
long-distance call named “roar-bark” which, according to literature, functions for spacing maintenance between individuals and/or communication between
members of the reproductive pair inside the territory. In this context, this study
aimed: 1) to compare four methods for detecting maned wolf’s roar-barks in recordings made in a natural environment, in order to elect the most efficient
one for our project; 2) to understand the night emission pattern of these
vocalizations, verifying possible weather and moon phases influences in
roar-bark’s emission rates; and 3) to test Passive Acoustic Monitoring as a tool to
identify the presence of maned wolves in a natural environment. The study
area was the Serra da Canastra National Park (Minas Gerais, Brazil), where
autonomous recorders were used for sound acquisition, recording all night
(from 06pm to 06am) during five days in December/2013 and every day from
April to July/2014. Roar-barks’ detection methods were tested and compared regarding time needed to analyze files, number of false positives and number
of correctly identified calls. The mixed method (XBAT + manual) was the
most efficient one, finding 100% of vocalizations in almost half of the time the
manual method did, being chosen for our data analysis. By studying
roar-barks’ temporal variation we verified that the wolves vocalize more in the
early hours of the evening, suggesting an important social function for those
calls at the beginning of its period of most intense activity. Average wind
reception of recorders or a change in behavioral patterns of wolves in high
speed wind conditions. A better understanding of seasonal variation of maned
wolves’ vocal activity is required, but our study already shows that it is
possible to detect behavioral patterns of wild animals only by sound, validating
PAM as a tool in this species’ conservation.
Key words: Maned wolf, Chrysocyon brachyurus, manual detection, automated
SUMÁRIO
INTRODUÇÃO GERAL...13
Justificativa do estudo...20
OBJETIVOS...22
CAPÍTULO I: An evaluation of manual and automated methods for detecting sounds of maned wolves (Chrysocyon brachyurus Illiger 1815)…………...23
Introduction………...27
Methods……….28
Results………...31
Discussion………...………..34
Conclusions………...37
References……….38
CAPÍTULO II: Temporal and environmental influences on the vocal behavior of free-ranging maned wolves (Chrysocyon brachyurus)...41
Introduction………..43
Material and methods………44
Results………...48
Discussion……….51
Literature cited………..58
Information for contributors (Journal of Mammalogy)...63
DISCUSSÃO GERAL...73
INTRODUÇÃO GERAL
O lobo-guará (Chrysocyon brachyurus Illiger 1815) (Figura 1a) é o
maior canídeo da América do Sul (Dietz 1985) e sua distribuição estende-se
pelos seguintes países: Brasil, Paraguai, Uruguai, Peru, Bolívia e Argentina
(Figura 1b). É uma espécie noturna, tímida e difícil de estudar na natureza e,
por isso, pouco se sabe a respeito de seus hábitos e história natural (de Melo et
al. 2007). As pesquisas com essa espécie in situ têm focado principalmente na
sua dieta e determinação de sua área de vida e a maior parte dos estudos
comportamentais é feita com animais em cativeiro (de Melo et al. 2007).
Figura 1. a) Lobo-guará (Chrysocyon brachyurus). Foto: Adriano Gambarini.
b) Distribuição do lobo-guará baseada nos registros da espécie entre 1998 e
2008. Retirado de Queirolo et al., 2011.
No que diz respeito à dieta, o lobo é onívoro generalista (Dietz 1984) e
essa flexibilidade permite que ele se adapte bem a alguns ambientes alterados
entre os itens mais consumidos: frutas, em especial a “fruta-do-lobo” ou
“lobeira” (Solanum lycocarpum) (Figura 2), pequenos mamíferos (roedores e marsupiais, principalmente), aves e lagartos (Dietz 1984, Motta-Junior et al.
1996, Santos et al. 2003, Rodrigues et al. 2007, Queirolo & Motta-Junior
2007, Bueno & Motta-Junior 2009, Emmons 2012). O que geralmente muda
de um local para outro é a frequência desses itens. A caça de veado-campeiro
(Ozotocerus bezoarticus) também já foi registrada (Bestelmeyer & Westbrook
1998), assim como de galinhas de fazendas próximas de onde os lobos vivem
(Dietz 1984). Em geral, frutas e insetos são mais consumidos durante a estação
chuvosa, enquanto os mamíferos prevalecem na estação seca (Santos et al.
2003).
Figura 2. Fruta-do-lobo ou lobeira (Solanum lycocarpum) (Retirada de
http://www.caliandradocerrado.com.br/, acesso em 26 de abril de 2015).
A fruta-do-lobo é consumida durante todo o ano, o que sugere que os
lobos buscam ativamente esse item alimentar durante a estação seca, quando
2007). O lobo-guará é um importante dispersor dessa espécie de planta:
carrega grande quantidade de suas sementes, as quais podem germinar mais
rapidamente após passar pelo seu trato digestivo (Rodrigues 2002). Além
disso, por percorrerem longas distâncias, levam-nas para lugares distantes e
geralmente defecam em locais propícios para germinação dessa espécie
(Santos et al. 2003).
Como essa espécie em geral caça presas de tamanhos limitados, não há
necessidade de alcateia e os indivíduos possuem hábitos solitários. Sua
organização social é baseada em pares reprodutivos monogâmicos com pouca
socialização entre o par (Jácomo et al. 2009). Machos e fêmeas tendem a ficar
próximos durante o dia e a se evitarem durante a noite quando estão
forrageando (de Melo et al. 2007).
Possuem áreas de vida que podem variar desde 21,7 até 115 km² (Dietz
1984, 1985, Carvalho e Vasconcellos 1995, Rodrigues 2002, Trolle et al. 2007,
Coelho et al. 2008, Jácomo et al. 2009, Emmons 2012), dependendo da
qualidade ambiental, e sobrepõem entre o par (de Melo et al. 2007). Macho e
fêmea defendem seu território contra pares adjacentes, mas pode haver
sobreposição dos territórios nas bordas (Rodrigues 2002, Rodden et al. 2004).
As fronteiras das áreas de vida parecem se manter constantes ao longo do
tempo. No entanto, após a morte ou partida de um indivíduo, o lobo da área
adjacente ou um lobo sem território imediatamente preenche a vaga (Dietz
1984).
O lobo-guará tem hábitos crepusculares/noturnos e apresenta maior
atividade na primeira metade da noite (Dietz 1984). Costumam percorrer
longas distâncias por noite, mas sua atividade é reduzida na lua cheia quando
de presas animais (em especial roedores) ou ao aumento da eficiência de caça
durante essas noites de maior luminosidade (Sábato et al. 2006).
Em ambiente natural, a estação reprodutiva do lobo-guará vai de abril a
setembro (Rodden et al. 2004). A gestação dura aproximadamente 65 dias
(Dietz 1984) e a média de nascimentos é de dois filhotes por ninhada, os quais
possuem pelagem negra nas primeiras semanas de vida (figura 3). A fêmea é a
principal encarregada de cuidar dos filhotes e o papel do macho no cuidado
parental ainda é controverso. Veado (1997) sugeriu que a função do macho
seria a defesa do território e, portanto, a proteção da ninhada. O macho
também parece prover alimentos para a fêmea e os filhotes (de Melo et al.
2009), os quais ficam no território dos pais até aproximadamente um ano de
idade, quando começam a dispersar (Rodden et al. 2004).
Figura 3. Filhote de lobo-guará em toca natural, no Parque Nacional da Serra
da Canastra. Foto: Adriano Gambarini.
Carnívoros solitários como o lobo-guará em geral se comunicam para
comunicação é utilizada principalmente para encontrar parceiros. A
comunicação tende a ser mais olfativa e auditiva do que visual (Petak 2010) e
as pistas visuais, em geral utilizadas em encontros agonísticos, podem ser
observadas à distância: piloereção, arqueamento das costas e os contrastes na
coloração do pelo (Dietz 1984).
A comunicação olfativa possui um importante papel nas interações
sociais entre os canídeos (Kleiman 1972). Os lobos-guará utilizam a deposição
de fezes e urina para anunciar sua presença e com função territorial ou de
alarme. Dietz (1984) reportou que as fezes eram encontradas principalmente
próximas aos locais de repouso dos lobos ou em locais proeminentes, como
sobre rochas ou cupinzeiros. Além de deixar fezes e urina, os lobos também
esfregam sua glândula anal ou genitália na vegetação (geralmente na grama)
para que os demais possam obter informações olfatórias relacionadas ao estado
reprodutivo do indivíduo (Dietz 1984).
No que diz respeito à comunicação acústica, Fox (1975) sugere que
canídeos solitários como o lobo-guará tendem a apresentar repertórios de
vocalizações ricos e estereotipados, pois o hábito crepuscular ou noturno faz
com que sinais visuais só sejam eficientes a pequenas distâncias, de modo que
uma compensação auditiva seria esperada e adaptativa nestes animais.
O repertório vocal do lobo-guará foi descrito por Brady em 1981, o
qual afirmou que as vocalizações estão sujeitas a vários níveis de gradação.
Ele defende que a estrutura física das vocalizações é influenciada pela
organização social e tipo de habitat: o lobo-guará, espécie solitária, tem o
conjunto mais elaborado de vocalizações agressivas e de manutenção de
distância.
Brady identificou oito tipos de vocalização em lobos adultos: o whine
repetitive whine (“lamento repetitivo”) para promover contato com os filhotes ou parceiro; o howl (“uivo”) era direcionado diretamente aos cuidadores do
zoológico; e o growl (“rosnado”), o hum (“zumbido”) e o single bark (“latido
único”) eram utilizados em contextos agressivos/agonísticos de curtas
distâncias. O último tipo de vocalização é o roar-bark (“rugido-latido” ou
“aulido”), caracterizado por ser um som de alta-amplitude, estrutura aparentemente tonal e emitido em sequências de 3-20 vocalizações.
O aulido já havia sido mencionado por Kleiman (1972) em seu estudo
abordando o comportamento social do lobo-guará: ela relatou ter ouvido
deep-throated single barks (em tradução literal: “latidos únicos do fundo da
garganta”) principalmente após o pôr-do-sol, os quais eram frequentemente produzidos em alternância entre os indivíduos. Kleiman (1972) afirmou que
seria um chamado de longa distância que, na natureza, serviria para ajudar na
manutenção do espaçamento entre coespecíficos. Essa função foi reafirmada
por Brady (1981), o qual encontrou diferenças consistentes no número de
frequências enfatizadas entre os aulidos individuais, sugerindo a presença de
identidade vocal nesse tipo de vocalização.
Dietz (1984) notou trocas de vocalizações de longa-distância,
principalmente na primeira metade da noite, tanto entre membros do par
reprodutivo quando entre pares de territórios adjacentes e sugeriu que, além de
promover o espaçamento entre indivíduos, o aulido também poderia servir
para comunicação entre os membros do par, principalmente durante a estação
reprodutiva. O mesmo foi sugerido por Bestelmeyer (2000) após observar que
os animais frequentemente se aproximavam do par depois de ouvi-los emitir
aulidos.
Em 2011 Sábato descreveu o repertório vocal da espécie, obtendo
usado para alardear a presença e localização do indivíduo, sua dominância
sobre o território e sobre os recursos presentes nele, especialmente no período
reprodutivo, de modo a repelir os indivíduos do mesmo sexo e atrair os do
sexo oposto. Além disso, também verificou que realmente existe identidade
vocal nos aulidos, como sugeriu Brady (1981). O modelo de discriminação
proposto teve uma probabilidade de acerto de 80,6% para a identidade e de
89,4% para o sexo do emissor em cativeiro.
Emmons (2012) observou que os aulidos eram mais frequentemente
emitidos quando os filhotes e jovens estavam presentes e sugeriu que essas
vocalizações serviriam principalmente na comunicação intra-grupo ao longo
das grandes distâncias das áreas de vida, apesar de não excluir a possível
função territorial dos chamados.
De modo geral, apesar de ter sido mencionado em vários estudos com
animais em cativeiro (Kleiman 1972, Brady 1981, Sábato 2011) e em ambiente
natural (Dietz 1984, Bestelmeyer 2000, Emmons 2012), vários aspectos
relacionados às vocalizações de longa-distância do lobo-guará ainda são pouco
conhecidos ou controversos. Os estudos discordam sobre o horário de maior
emissão dessas vocalizações, se na primeira (Kleiman 1972, Dietz 1984) ou na
segunda (Sábato 2011) metade da noite, e as possíveis funções dos aulidos
ainda não foram propriamente testadas de modo a determinar realmente qual
sua principal função. A discriminação individual através dos aulidos pode ser
uma importante ferramenta para entender melhor as interações sociais da
espécie e pode ser utilizada no monitoramento das populações em áreas
protegidas. No entanto, o método descrito por Sábato (2011) ainda precisa ser
Justificativa do estudo
Embora não seja uma espécie exclusivamente brasileira, é no território
brasileiro que o lobo-guará encontra a sua mais extensa área de ocorrência e
onde são observadas as maiores populações da espécie. O Plano de Ação para
a Conservação do Lobo-guará identifica como um de seus problemas a falta de
informações sobre ecologia espacial e requerimentos de habitat, de modo que
uma das metas acordadas foi gerar demandas de pesquisa visando suprir as
lacunas do conhecimento sobre o lobo-guará (IBAMA 2008).
Atualmente, o lobo-guará encontra-se na categoria “vulnerável” na Lista Nacional das Espécies da Fauna Brasileira Ameaçadas de Extinção
(MMA 2003) e como “Quase ameaçado” segundo a International Union for Conservation of Nature (IUCN 2015). A principal ameaça para a
sobrevivência desses animais é a perda de habitat (Rodden et al. 2004), já que
grande parte da área de ocorrência da espécie já está convertida em campos
agricultáveis e destinados à pecuária (IBAMA 2008). Outras causas de
mortalidade são: acidentes com carros (Rodrigues 2002), disputas com cães
domésticos ou doenças trazidas por eles (Rodden et al. 2004), confrontos com
humanos em fazendas onde o lobo aparece buscando por galinhas (Dietz 1984)
e ataque pela onça-parda Puma concolor em ambientes naturais (Mazzolli
2009).
Segundo de Melo (2007), essa espécie possui potencial para ser
flagship ou “espécie guarda-chuva” do principal ambiente que habita: o
cerrado, um dos biomas hot spots do mundo (Myers et al. 2000) por ser uma
área com grande concentração de espécies endêmicas e que está passando por
Levando em consideração que esse animal apresenta status
preocupantes segundo o MMA e a IUCN e que sua população vem
diminuindo, é importante pensar em formas de manejo eficientes para a
conservação dessa espécie, de modo que ela não atinja status ainda mais
alarmantes.
Bestelmeyer (2000) comparou os dados obtidos com estudos com
lobo-guará em cativeiro e na natureza e observou que eles apresentam muitas
diferenças comportamentais nas duas situações, sugerindo que os resultados
obtidos em estudos em cativeiro não devem ser generalizados para toda a
espécie. As informações sobre o comportamento acústico desses animais vêm
em grande parte de estudos em zoológicos e uma pesquisa mais aprofundada e
sistematizada é necessária para realmente entender a importância desse tipo de
comunicação para esses animais em ambiente natural.
A obtenção de informações sobre o comportamento acústico do
lobo-guará in situ nos ajudará a compreender melhor suas interações sociais
co-específicas. Esse conhecimento contribuirá para um entendimento mais
profundo de como se dá a distribuição espacial dos indivíduos e qual o
requerimento de área de vida desses animais, de modo a subsidiar melhores
estratégias para a conservação da espécie. Além disso, a bioacústica pode ser
uma ferramenta interessante para monitoramento desses animais em áreas
OBJETIVOS
Capítulo I:
Comparar quatro métodos de detecção (manual, automáticos e misto)
dos aulidos de lobo-guará em gravações feitas em ambiente natural;
Eleger o melhor método para detecção de aulidos de lobo-guará para
utilização em nosso projeto.
Capítulo II:
Entender como se dá o padrão noturno de emissão de aulidos por
lobos-guará em ambiente natural;
Verificar se as condições climáticas e as fases da lua influenciam nas
taxas de emissão de aulidos;
Testar o Monitoramento Acústico Passivo como ferramenta na
CAPÍTULO I - An evaluation of manual and automated methods for
detecting sounds of maned wolves (Chrysocyon brachyurus Illiger 1815)
Luciana H.S. Rochaab, Luane S. Ferreiraa, Bruna C. Paulaa, Flávio H.G.
Rodriguesc & Renata S. Sousa-Limaabd
a
Laboratory of Bioacoustics, Universidade Federal do Rio Grande do Norte,
Natal, Brazil
b
Graduate Program in Psychobiology, Universidade Federal do Rio Grande do
Norte, Natal, Brazil
c
General Biology Department, Universidade Federal de Minas Gerais, Belo
Horizonte, Brazil
d
Bioacoustics Research Program, Lab of Ornithology, Cornell University,
Ithaca, NY, USA
Periódico: BIOACOUSTICS (Qualis: A2, Fator de impacto: 0,727).
Situação: Publicado em 18/03/2015.
Contribuição dos autores:
LSF contribuiu com a análise dos dados e a escrita do manuscrito;
BCP contribuiu com a coleta e análise dos dados e apresentou sugestões que
RESUMO
Embora a bioacústica venha sendo cada vez mais utilizada para estudar
espécies e ambientes buscando seu monitoramento e conservação, a detecção
de chamados produzidos pelas espécies de interesse consome muito tempo
quando feita manualmente. Nesse estudo comparamos quatro métodos para
detecção e identificação de aulidos de lobos-guará (Chrysocyon brachyurus)
em gravações: (1) um método manual, (2) um método automático utilizando o
programa Raven Pro 1.4, (3) um método automático utilizando o programa
XBAT, (4) um método misto utilizado o detector do XBAT seguido por
verificação manual. As gravações foram feitas utilizando um Song meter
instalado no Parque Nacional da Serra da Canastra (Minas Gerais, Brasil). Para
cada método foram avaliadas as seguintes variáveis em uma gravação de 24
horas: (1) tempo total necessário para análise dos arquivos, (2) número de
falsos positivos identificados e (3) número de detecções verdadeiras
comparado ao número total de sons-alvo na gravação. Métodos automáticos
analisaram as gravações mais rapidamente (77-93min) quando comparados ao
método manual (189min), mas apresentaram um maior número de falsos
positivos e foram menos eficientes na identificação dos chamados (manual =
91,89%, Raven = 32,43% e XBAT = 84,86%). A adição da verificação manual
após a detecção do XBAT aumentou drasticamente a eficiência na
identificação dos sons (XBAT + manual = 100% de detecções verdadeiras) e
esse parece ser o melhor método dentre os propostos para detectar sons-alvo
nos estudos em que grande quantidade de dados acústicos precisa ser analisada
em tempo razoável (111min, 58,73% do tempo necessário para detectar
chamados manualmente).
Palavras-chave: Chrysocyon brachyurus; aulidos; detecção manual; detecção
Do wn lo ad ed b y [ 1 7 7 .2 0 .1 3 0 .1 1 ] at 1 0 :1 9 1 7 Ap ril 2 0 1 5 Bioacoustics, 2015
Vol. 24, No. 2, 185–198, http://dx.doi.org/10.1080/09524622.2015.1019361
An evaluation of manual and automated methods for detecting sounds of maned wolves (Chrysocyon brachyurus Illiger 1815) Luciana H.S. Rochaa,b*, Luane S. Ferreiraa1, Bruna C. Paulaa2, Fla´vio H.G. Rodriguesc3 and Renata S. Sousa-Limaa,b,d4
a
Laboratory of Bioacoustics, Universidade Federal do Rio Grande do Norte, Natal, Brazil; bGraduate Program in Psychobiology, Universidade Federal do Rio Grande do Norte, Natal, Brazil; cGeneral Biology Department, Universidade Federal de Minas Gerais, Belo Horizonte, Brazil; dBioacoustics Research Program, Lab of Ornithology, Cornell University, Ithaca, NY, USA
(Received 15 November 2014; accepted 10 February 2015)
Although bioacoustics is increasingly used to study species and environments for their monitoring and conservation, detecting calls produced by species of interest is prohibitively time consuming when done manually. Here we compared four methods for detecting and identifying roar-barks of maned wolves (Chrysocyon brachyurus) within long sound recordings: (1) a manual method, (2) an automated detector method using Raven Pro 1.4, (3) an automated detector method using XBAT and (4) a mixed method using XBAT’s detector followed by manual verification. Recordings were done using a song meter installed at the Serra da Canastra National Park (Minas Gerais, Brazil). For each method we evaluated the following variables in a 24-h recording: (1) total time required analysing files, (2) number of false positives identified and (3) number of true positives identified compared to total number of target sounds. Automated methods required less time to analyse the recordings (77 – 93 min) when compared to manual method (189 min), but consistently presented more false positives and were less efficient in identifying true positives (manual = 91.89%, Raven = 32.43% and XBAT = 84.86%). Adding a manual verification after XBAT detection dramatically increased efficiency in identifying target sounds (XBAT + manual = 100% true positives). Manual verification of XBAT detections seems to be the best way out of the proposed methods to collect target sound data for studies where large amounts of audio data need to be analysed in a reasonable time (111 min, 58.73% of the time required to find calls manually).
Keywords: Chrysocyon brachyurus; roar-barks; manual detection; automated
detection
Introduction
Bioacoustics is increasingly used to study species and environments for their monitoring and conservation (Laiolo 2010; Pijanowski, Farina, et al. 2011; Pijanowski, Villanueva- Rivera, et al. 2011). Rapid advances in technology and informatics are making it possible to acquire far more acoustic data than anyone can ever listen to, which calls for new methods of data management, visualization and analysis (Towsey et al. 2014). A general problem in bioacoustics applications is detecting calls produced by species of interest. The most reliable method used for this purpose is still manual detection, which consists in visual and aural inspection of spectrograms and selection of target sounds (Urazghildiiev and Clark 2007). This method demands a lot of time and effort and it can be
Do wn lo ad ed b y [ 1 7 7 .2 0 .1 3 0 .1 1 ] at 1 0 :1 9 1 7 Ap ril 2 0 1 5
biased due the subjectiveness of operators, since people vary in their ability to detect and classify calls due to differences in age, experience and hearing (Digby et al. 2013).
Alternatively, sound analysis software preprogrammed to identify specific target sounds has been used with varying degrees of success. Automated detection has been recently achieved with high success for many mammal taxa including bats (Adams et al. 2010), whales (Baumgartner and Mussoline 2011) and elephants (Thompson et al. 2009, 2010; Venter and Hanekom 2010; Zeppelzauer et al. 2015). Using an automated detector can reduce the amount of labour required by rejecting portions of data that contain no target signal (Urazghildiiev and Clark 2007). Detector effectiveness depends on results with a high percentage of target signals (hits) detected and a low percentage of false positives. Such effectiveness is highest for species that have low call variability.
Canid complex acoustic repertoires result from different selective pressures acting on production, usage and vocal responses by different individuals from a particular species and as a result of individual signal variation during different ontogenetic phases (Kleiman 1967; Kleiman and Eisenberg 1973; Dabelsteen and Darden 2006). Ontogenetic changes in canids occur both in acoustic features of vocalizations and in patterns of call production in a specific environmental or social context (Coscia et al. 1991; Schassburger 1993; Dabelsteen and Darden 2006). Aspects of canid sound communication such as phonetics (Riede and Fitch 1999), syntax (Tembrock 1976), semantics (Lehner 1978; Brady 1981; Newton-Fisher et al. 1993) and nonlinear phenomena (Wilden et al. 1998; Riede et al. 2000; Sa´bato 2011) grant even greater variability to this group’s vocal repertoire. Thus, for animals with a large degree of vocal variation, such as canids, a larger training set is necessary and detector performance tends to be reduced (Digby et al. 2013).
The maned wolf (Chrysocyon brachyurus Illiger 1815) is the biggest South American canid (Rodden et al. 2004) and it is currently in the “Near threatened” category according to the IUCN Red List of Threatened Species (IUCN 2014). Captive maned wolves’ vocal repertoire was first described by Brady (1981) and comprised eight sound types. Recently, Sa´bato (2011) increased to 10 the number of sound types described for the species. Of these, nine are used for short and medium-distance communication. The tenth is a long distance call named the ‘roar-bark’, which consists of high amplitude tonal syllables emitted in sequences and presumably functions to space individuals in adjoining home areas (Kleiman 1972). Roar-barks exhibit intra-individual variability in several parameters both in frequency and time domains, which makes this vocalization potentially useful for individual discrimination (Brady 1981; Sa´bato 2011). In this study we used manual and automated detection methods to identify maned wolf’s roar-barks in recordings collected in the Serra da Canastra National Park (Minas Gerais, Brazil). Human effort and unsupervised computer processing times required to process a 24-h sound recording were compared as well as the comprehensiveness of the resulting detections and the number of false positives identified by each method.
Methods
Sound recordings
Do wn lo ad ed b y [ 1 7 7 .2 0 .1 3 0 .1 1 ] at 1 0 :1 9 1 7 Ap ril 2 0 1 5
wolf population density in Serra da Canastra is one of the highest in the world: 0.08 individuals/km2 (Consorte-McCrea and Santos 2014).
An autonomous recorder (Song Meter SM2 + , Wildlife Acoustics, Inc., Concord, MA, USA) with two SMX-II weatherproof microphones (Wildlife Acoustics, Inc.) positioned on the right and left side of it was attached to a 1.8 m wood stake and placed in the Park (208150 3600 S,8468330 W). We used the Song Meter SM2 + Configuration Utility software
version 3.2.4 (Wildlife Acoustics, Inc.) to program the Song Meter in order to record during five nights (from 6 pm until 6 am), since this is the period of day when wolves are more active and vocalize more (Dietz 1984). All recordings were saved into 30 min-long segments for later analyses using the built-in SM2 + configuration tool (sample rate = 44.1 kHz; channels = stereo; gain = 36 dB; 16-bit WAV files).
Manual detection
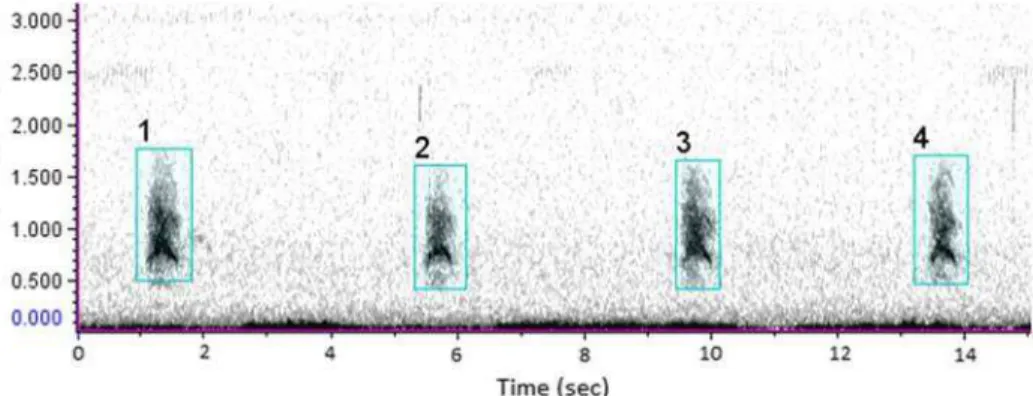
Two experienced sound analysts manually scanned 24 h of audio recordings collected in Serra da Canastra National Park for maned wolf’s roar-barks. Experience was defined by prior visual and aural inspection of spectrograms of at least 200 h of data searching for maned wolf roar-barks. Sound spectrograms of channel 1 of each recording were browsed in Raven Pro 1.4 (Cornell Bioacoustics Lab, Ithaca, NY, USA; Charif et al. 2010) using a DFT window size of 2048 samples and Hann window. Aural inspection of amplified selections was done to confirm detection of very faint calls. While browsing a file, all calls detected were selected (Figure 1). Time of call occurrence, number of calls in each sequence and number of sequences were registered.
Raven’s automated detector
The first method of automated detection used was Raven’s Band Limited Energy detector (Mills 2000), which operates by estimating the background noise of a signal and using it to find sections of the signal that exceed a specified signal-to-noise ratio (SNR) threshold in a specific frequency band, during a specific time (Charif et al. 2010). Following Raven’s manual and after a series of trials using different parameter configurations (minimum frequency, maximum frequency, minimum duration, maximum duration, minimum separation, minimum occupancy, SNR threshold, block size, hop size and percentile), we chose the one that had the best performance in various files, with sequences of different SNR calls (see Results).
Do wn lo ad ed b y [ 1 7 7 .2 0 .1 3 0 .1 1 ] at 1 0 :1 9 1 7 Ap ril 2 0 1 5
After configuring the detector, Raven allows a user to run a Batch Detection, which consists in using the same detector in a large number of files at the same time. All identified calls were manually reviewed to test the efficiency of this method.
XBAT’s automated detector
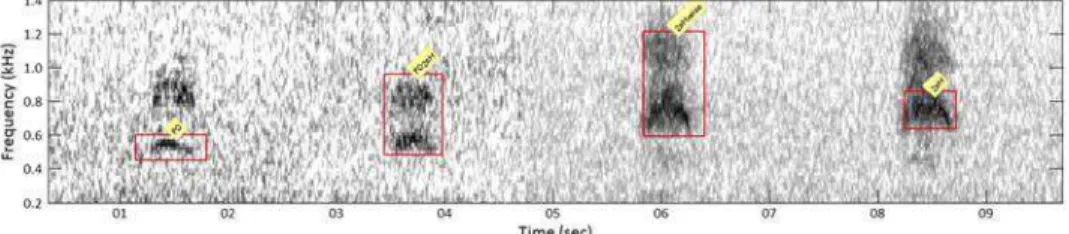
The second method of automated detection was performed using the Data Template Detector of XBAT-R7 (Extensible Bioacoustic Tool; Figueroa 2007) on MATLAB R2010a (MathWorks, Inc., Natick, MA, USA). The Data Template Detector searches for sounds that cross-correlate to one or more pre-set sound templates and logs all events for which the correlation value exceeds a specified threshold. Initially we evaluated how to select call templates based on a series of trials using different template sounds and thresholds to conclude that pre-scanning was the best option to select appropriated templates. Pre-scanning was made with a previous roar-bark sample from another site using a high threshold (0.60). Pre-scanning time was not counted in the total time for the XBAT automated detector. Target sound templates were selected from pre-scanning the data. After exhaustive trials using different spectral portions of roar-barks (i.e. fundamental frequency or second harmonic), four template selection types (Figure 2) were used because this combination of templates detected more roar-barks. After scanning completion, XBAT detections were reviewed in the browse log window to verify efficiency of this method. Furthermore, different spectrogram configurations: slice sizes, frequency ranges, threshold values, and brightness and contrast levels were tested with the same set of call templates to evaluate the influence of those parameters on XBAT detection performance.
XBAT + manual
In addition to the procedure described above, a manual search for missed vocalizations on each sequence found by XBAT automated detector was made and the time effort spent doing so was counted separately. After a positive XBAT detection, missed roar-barks were manually counted backwards and forwards until a 24 s window with no roar-barks were identified, which was considered the sequence duration. This window time was chosen considering sequences of roar-barks in our data. This fourth mixed method was labelled
‘XBAT + manual’. XBAT was used as the basis of this method because it presented better performance than Raven for our data (see Results).
Do wn lo ad ed b y [ 1 7 7 .2 0 .1 3 0 .1 1 ] at 1 0 :1 9 1 7 Ap ril 2 0 1 5
Comparing methods
Manual and automated detections were made using the same computer with the same 48 half-hour files, totalling a 24-h sound recording. Prior testing of many different configurations for each automated detector was done to verify which parameter settings yielded more detection within each tool, which allowed us to better understand how each detector works. Total processing time required to detect target sounds using the manual method was calculated as the sum of the time spent manually browsing and selecting sounds in each individual half-hour file. Mean manual processing time was calculated using the same data (amount of time browsing and selecting target sounds in each half- hour file).
For each automated detector, total processing time was calculated as the sum of the time spent configuring the detector plus the time running the detector (i.e. computer processing time) in all files and the time needed to review the detections. In order to calculate the mean time required to automatic analyse each file, the total time needed to configure and run each automated detector was divided by 48 (the number of files used). The resulting time was added to the time spent to verify detections in each file to calculate processing time for each half-hour file. Manual browsing and selection of sounds, configuration of detector parameters and review of the resulting automated detections were all considered human effort because it required operator input. Time taken by the detector to scan all files was considered computer processing time because it required no input from operators and allowed the analysts to dedicate themselves to another task.
Two measures of sound detection efficiency were taken: the number of false positives and comprehensiveness. Scanning comprehensiveness was measured according to Swiston and Mennill (2009) as the number of correctly identified sounds (true positives) by each method over the total number of target sounds. Comprehensiveness was calculated for detections of individual roar-barks and detections of sequences of roar-barks and the results are presented as percentages.
Statistical analyses
All analyses were conducted using IBM SPSS Statistics 20.0 (SPSS, Inc., 2011, Chicago, IL, USA). We compared processing time for each 30- min file using Friedman’s ANOVA test followed by post hoc Wilcoxon’s matched-pairs tests. The Bonferroni correction was used to determine statistical significance (a level was reduced to 0.0125 for a 95% confidence interval). Only p values below this level were considered significant.
Results
Automated detectors’ configuration
Do wn lo ad ed b y [ 1 7 7 .2 0 .1 3 0 .1 1 ] at 1 0 :1 9 1 7 Ap ril 2 0 1 5
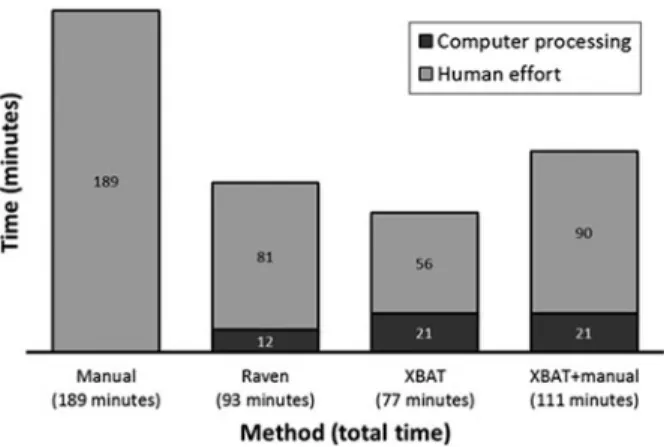
Figure 3. Time spent in human effort (light grey) and in computer processing (black) of a 24-h recording for each detection method used to target maned wolf’s roar-barks.
Processing time
Both automated detectors and the mixed method (XBAT + manual) reduced the total time required to process a 24-h recording (Manual = 189 min; Raven = 93 min; XBAT = 77min; XBAT + manual = 111 min; Figure 3). The Raven automated detector required more human effort to verify the output of the detectors (computer processing = 14 min; human effort = 79 min) than XBAT’s (computer processing = 21 min; human effort = 56 min). XBAT + manual method required 34 extra minutes of human effort (computer processing time = 21 min; human effort = 90 min) to review all roar- barks sequences found using XBAT’s detector.
Time to process each file was significantly shorter using automated detector or the mixed method than manual detection (mean rank for a 30 min file: manual = 3.71; Raven = 2.27; XBAT = 1.78; XBAT + manual = 2.24. X 2(3) = 65,144, p < 0.001).
Detection comprehensiveness and false positives
Manual detection resulted in 170 roar-barks with different SNR in the 24-h recording analysed (91.89% of total calls). Raven’s detector found only 60 roar-barks (32.43% of the total number of calls) while XBAT’s detector had a better performance, resulting in 157 roar-barks (84.86%). Missed signals for both detectors were mainly distant (faint) calls, sometimes missing their fundamental frequency bands. Raven also missed some close calls when they were too noisy. The mixed method adding a posteriori manual selection of sounds around XBAT automated detections achieved 100% comprehensiveness (185 roar- barks) (Figure 4).
Roar-barks were distributed in 29 sequences (12 of 1 or 2 roar-barks and 17 of 3 or more) in the 24-h recording. Raven’s detector identified only 10 sequences, while XBAT found all of them. When analysing the number of individual roar-barks in each sequence, we observed that Raven only found sequences of three or more. XBAT + manual did not enhance the number of sequences found, only the number of individual roar-barks detected (Figure 5).
Do
wn
lo
ad
ed
b
y
[
1
7
7
.2
0
.1
3
0
.1
1
]
at
1
0
:1
9
1
7
Ap
ril 2
0
1
5
Figure 4. Percentage of correct roar-barks identifications by each method in a 24-h recording.
band that Raven’s detector was searching for the roar-barks. Figure 6 shows examples of Raven’s detector false positives.
Since we used four XBAT templates and a low threshold value, a higher number of false positives was expected because it included a variety of frequency bands. Therefore, XBAT detection resulted in much more false positives, thus we selected 25% of all XBAT’s wrong detections to verify which types of sounds most contributed to these false detections. XBAT detected mostly rain (45%), but also insects (19%), wind (18%), recording self-noise (14%) and other unidentified sounds (4%). Figure 7 shows examples of
XBAT’s detector false positives. XBAT and Raven differed in which non-target signals
Do
wn
lo
ad
ed
b
y
[
1
7
7
.2
0
.1
3
0
.1
1
]
at
1
0
:1
9
1
7
Ap
ril 2
0
1
5
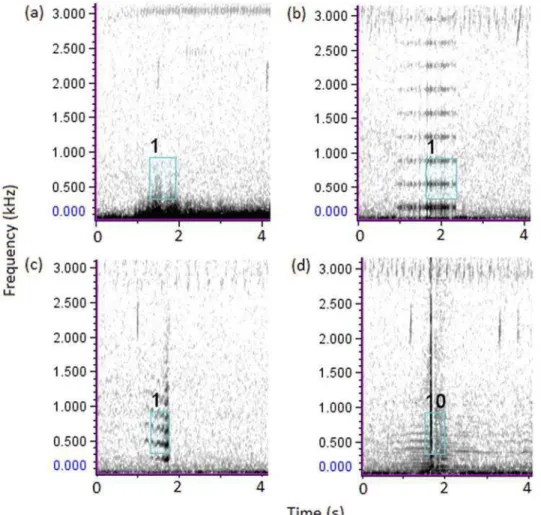
Figure 6. Sound spectrograms exemplifying Raven’s false positives. (a) Wind, (b) recording system self-noise, (c) insect flying nearby and (d) insect hitting the microphone.
were detected (false positives). Only 32% of false positives were shared between the two detection tools.
Discussion
Scanning a 24-h recording for maned wolf’s roar-barks using automated or mixed methods (Raven, XBAT or XBAT + manual) was faster than browsing it manually (Figure 3). However, automated methods missed more target sounds and returned more false positive than manual detection. For both automated methods, more false positives also meant more reviewing time. The mixed method, on the other hand, achieved 100% comprehensive- ness, detecting all target sounds and, therefore, had the best result (Figure 4).
Automated detectors’ configuration
Do wn lo ad ed b y [ 1 7 7 .2 0 .1 3 0 .1 1 ] at 1 0 :1 9 1 7 Ap ril 2 0 1 5
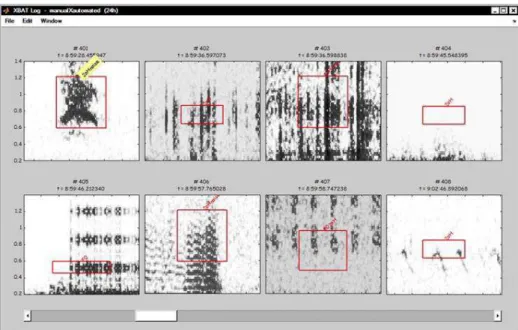
Figure 7. Browse log window from XBAT showing one roar-bark (upper left) and seven examples of false positives (in order: rain, rain, wind, recording system self-noise, insect flying nearby and two types of insect sound). Numbers following # are the event number (from a total of 1613) and numbers following = are the time of the event. Spectrogram boxes are 0.2 – 1.4 kHz x 1.4 s.
like XBAT’s detector did. Decreasing the threshold increased the number of true positives up to a point. After that, the number of hits varied randomly and the same happened with false positives.
We tested several other XBAT template detector parameters. Increasing or decreasing the FFT value, even substantially, yields small changes in true positives or false positives. However, computer processing time increased or decreased, respectively. Unfortunately, visual identification of sounds on the spectrogram became too hard to justify a decrease of FFT to decrease computer processing time. Changing the frequency range had no effect whatsoever, except when excluding the initial 200 Hz. When this highly noisy low frequency band is included, XBAT filters are affected and spectrogram visualization is impaired. Similarly, brightness and contrast changes had small effects other than jeopardizing spectrogram visualization. Changing window slices also had a very small effect on true and false positives, but reduction or increase in computer processing time was proportional. We used a slightly smaller number than the maximum slices per window and successfully obtained a decrease in computer processing time without losing efficiency. Finally, it should be noted that the XBAT template detector allows template matches to be exclusive or non-exclusive. Non-exclusive searches had a slightly shorter computer processing time but yielded a greater number of matches, increasing the number of false positives and redundancy in true positive matching (several true positives were found two or three times, overestimating the number of detections).
Processing time
Do wn lo ad ed b y [ 1 7 7 .2 0 .1 3 0 .1 1 ] at 1 0 :1 9 1 7 Ap ril 2 0 1 5
in each file no matter which method was used. Raven’s detector only needed 14 min of independent processing, but it required more manual effort to check all detections (and two-thirds of them were false positives). XBAT’s detector took longer to configure and scan all files (21 min), but required less time of human verification, even considering that XBAT’s detector returned more false positives than Raven’s tool. Adding a manual selection after XBAT’s detection (XBAT þ manual) increased the human effort from 56 to 90 min, but it still represents less than half the time needed to detect all calls manually (189 min).
One factor that influenced the reduced time spent in verifying detections in XBAT is that Raven Pro 1.4 plots its results in different archives, which requires re-opening each individual file with matches. XBAT, on the other hand, plots every match in a single separated window, making it much faster to browse between matches and files (Figure 7). However, the recently released Raven Pro 1.5 brings as a new feature a detection browsing window similar to XBAT’s, which probably would facilitate manual verification of detections and reduce processing time.
Current demand for big data analyses prevents humans from manually detecting target sounds, and all automated methods presented here (and also the mixed method) reduced the time required to analyse a 24-h recording. Automated scanning can also run in different computers at the same time, which can further improve the efficiency of automated detections many fold.
Detection comprehensiveness and false positives
Automated methods were less efficient than manual browsing both in correctly identifying target sounds and in the number of false positives. Raven’s detector only found 32.43% of all roar-barks and could not find any sequence of one or two calls (Figure 5). Raven misclassified as target sounds those generated by wind, insects and microphone static (Figure 6), and the number of false positives was almost twice as high as the number of hits (true positives). Recent studies using Raven’s Band Limited Energy Detector to find sounds of fin whales (Morano et al. 2012) and migrant songbirds (Van Doren et al. 2015) show high true positive percentages: 79% comprehensiveness for whales and 96% in low noise conditions for birds, although also capturing a large number of false positives in the bird study (more than 90% of detections). Raven’s detector also showed high accuracy in detection of motor vehicle noise in a forested landscape (Brown et al. 2013). Our Raven roar-bark detector performance was poorer than the Raven performance for sounds from those examples and can be attributed to the high variability of our target signals, especially concerning their low SNR, which could have resulted in several missed calls.
Do wn lo ad ed b y [ 1 7 7 .2 0 .1 3 0 .1 1 ] at 1 0 :1 9 1 7 Ap ril 2 0 1 5
insect activity. Similar types of sounds were false positives in other studies using these tools (Swiston and Mennill 2009; Brown et al. 2013; Van Doren et al. 2015).
XBAT’s detector was the fastest method and had good comprehensiveness, making it very useful in studies where finding all target sounds is not mandatory and time is a constraint. For instance, if a conservation study wants to determine whether a species is present in an area, this fast sound data analysis method would be more effective than other methods.
The mixed method of manually verified sequences detected by XBAT (XBAT + manual method) reached 100% of accuracy and was considered the best method to find all target sounds in the data-set. The mixed method surprisingly found 15 roar-barks that were missed during manual browsing due to their low SNR. This method is well suited for studies involving temporal variation, for example, where missing a few vocalizations can bias the entire result.
Conclusions
Although several techniques for automated sound detection have been tested in the past years, most of them have been designed with specific target species’ signals in mind and more generic approaches are desired (Blumstein et al. 2011). Both Raven and XBAT’s detectors provide a fast alternative to manual browsing of large audio files, but at the cost of detection comprehensiveness. Since no highly advanced informatics skills are needed to configure their detectors, these tools become very user-friendly for biologists.
The XBAT + manual mixed method proved to be very successful to detect target sounds in our data, identifying 100% of all roar-barks and sequences recorded in the field. In cases where it is important to find all vocalizations, automated methods will still require improvements, and additional manual browsing might be useful. However, both automated detectors missed mostly very faint calls.
Missing faint sounds during automated signal detection is probably a problem of SNR. The higher the background noise, the more likely a faint target signal will be missed. Therefore, some means of increasing SNR, such as denoising recordings, should be useful to improve signal detection. In addition, the capability to identify and exclude transient non-target signals would improve performance by reducing false detection rates. Both solutions are currently in development for several signal processing tools.
We also suggest specific additional improvements for XBAT. This tool sets a single threshold for each detection run regardless of the number of templates. The possibility of running a single detection with different thresholds values for each template would be an improvement since different templates may have different optimal thresholds. A single threshold forces the detection to be run with the lower optimal template threshold, therefore, increasing the number of false positives generated by the other templates. Other useful tools could be added to the XBAT core such as batch runs that iteratively use a set increase in detection threshold value (e.g. an increase of 0.1 resulting in sequential runs with thresholds set to 0.3, 0.4, 0.5, etc.), resulting in different XBAT logs. The resulting logs could be fed into yet another tool that would be able to compare and show the differences in detection logs and the user could access the best threshold to use without much human effort.
Do wn lo ad ed b y [ 1 7 7 .2 0 .1 3 0 .1 1 ] at 1 0 :1 9 1 7 Ap ril 2 0 1 5
mixed method used in this study was well suited to identify all target sounds and, therefore, can be very useful in studies that require a fast identification of maned wolf’s roar-barks in a natural environment within long recordings. Passive acoustic monitoring can be an invaluable conservation tool for this species.
Acknowledgements
We thank the Laboratory of Bioacoustics at the Universidade Federal do Rio Grande do Norte (LaB – UFRN) for support and technical assistance. For field and laboratory assistance, we are very grateful to Victor Sa´bato, Marina Duarte and Jean Santos. We also thank Wallisen Tadashi Hattori for statistical advice and two anonymous reviewers for suggestions that greatly improved our manuscript. Data collection at Serra da Canastra National Park was authorized by Instituto Chico Mendes de Conservac a˜o da Biodiversidade (ICMBio) (SISBIO license number 41329-2).
Disclosure statement
No potential conflict of interest was reported by the authors.
Funding
This study was supported by CNPq (Edital Universal [grant number 474000/2010-9] and Bolsa Produtividade em Pesquisa to FHGR [grant number 301665/2011-7]), FAPEMIG (PPM Program to FHGR), Idea Wild, and the Graduate Program in Psychobiology – UFRN.
Notes
1. Email: [email protected]
2. Email: [email protected]
3. Email: [email protected]
4. Email: [email protected]
References
Adams MD, Law BS, Gibson MS. 2010. Reliable automation of bat call identification for eastern New South Wales, Australia, using classification trees and AnaScheme software. Acta Chiropterol 12(1):231 – 245. doi:10.3161/150811010X504725.
Baumgartner MF, Mussoline SE. 2011. A generalized baleen whale call detection and classification system. J Acoust Soc Am 129(5):2889 – 2902. doi:10.1121/1.3562166.
Blumstein DT, Mennill DJ, Clemins P, Girod L, Yao K, Patricelli G, Deppe JL, Krakauer AH, Clark C, Cortopassi KA, et al. 2011. Acoustic monitoring in terrestrial environments using microphone arrays: applications, technological considerations and prospectus. J Appl Ecol 48(3):758 – 767. doi:10.1111/j.1365-2664.2011.01993.x.
Borker AL, Mckown MW, Ackerman JT, Eagles-Smith CA, Tershy BR, Croll DA. 2014. Vocal activity as a low cost and scalable index of seabird colony size. Conserv Biol 28(4):1 – 9. Brady CA. 1981. The vocal repertoires of the bush dog (Speothos venaticus), crab-eating fox
(Cerdocyon thous), and maned wolf (Chrysocyon brachyurus). Anim Behav 29(3):649 – 669. doi:10.1016/S0003-3472(81)80001-2.
Brown CL, Reed SE, Dietz MS, Fristrup KM. 2013. Detection and classification of motor vehicle noise in a forested landscape. Environ Manage 52(5):1262 – 1270. doi: 10.1007/s00267-013-0123-8.
Charif R, Pitzrick M. 2008. Automated detection of Cerulean Warbler songs using XBAT data template detector software. Preliminary Report. Cornell University Bioacoustics Research Program.
Do wn lo ad ed b y [ 1 7 7 .2 0 .1 3 0 .1 1 ] at 1 0 :1 9 1 7 Ap ril 2 0 1 5
Consorte-McCrea AG, Santos EF, editors. 2014. Ecology and conservation of the maned wolf: multidisciplinary perspectives. Boca Raton, FL: CRC Press, Taylor & Francis.
Coscia EM, Phillips DP, Fentress JC. 1991. Spectral analysis of neonatal wolf Canis lupus vocalizations. Bioacoustics 3(4):275 – 293. doi:10.1080/09524622.1991.9753190.
Dabelsteen T, Darden S. 2006. Ontogeny of swift fox Vulpes velox vocalizations: production, usage and response. Behaviour 143(6):659 – 681. doi:10.1163/156853906777791351.
Dietz JM. 1984. Ecology and social organization of the maned wolf (Chrysocyon brachyurus). Smithson Contrib Zool 392:1 – 51. doi:10.5479/si.00810282.392.
Digby A, Towsey M, Bell BD, Teal PD, Giuggioli L. 2013. A practical comparison of manual and autonomous methods for acoustic monitoring. Methods Ecol Evol 4(7):675 – 683. doi:10.1111/ 2041-210X.12060.
Figueroa H. 2007. Extensible BioAcoustic Tool. Ithaca, NY: Cornell Bioacoustics Research Program, XBAT R7. Available from: http://www.birds.cornell.edu/brp/software/xbat- installation
IUCN. 2014. IUCN Red List of Threatened Species. Version 2014.1. Available from: http://www. iucnredlist.org/. Downloaded on 11 June 2014.
Kleiman DG. 1967. Some aspects of social behavior in the Canidae. Am Zool 7:365 – 372. Kleiman DG. 1972. Social behavior of the maned wolf (Chrysocyon brachyurus) and bush dog
(Speothos venaticus): a study in contrast. J Mammal 53(4):791 – 806. doi:10.2307/1379214. Kleiman DG, Eisenberg JF. 1973. Comparisons of canid and felid social systems from an
evolutionary perspective. Anim Behav 21(4):637 – 659. doi:10.1016/S0003-3472(73)80088-0. Laiolo P. 2010. The emerging significance of bioacoustics in animal species conservation. Biol
Conserv 143(7):1635 – 1645. doi:10.1016/j.biocon.2010.03.025.
Lehner PN. 1978. Coyote vocalizations: a lexicon and comparisons with other canids. Anim Behav 26:712 – 722. doi:10.1016/0003-3472(78)90138-0.
Mills H. 2000. Geographically distributed acoustical monitoring of migrating birds. J Acoust Soc Am 108(5):2582. doi:10.1121/1.4743594.
MMA/IBAMA. 2005. Management plan – Serra da Canastra National Park. Ministe´rio do Meio Ambiente – MMA/Instituto Brasileiro do Meio Ambiente e dos Recursos Naturais Renova´veis – Ibama, Bras´ılia, Brasil.
Morano JL, Salisbury DP, Rice AN, Conklin KL, Falk KL, Clark CW. 2012. Seasonal and geographical patterns of fin whale song in the western North Atlantic Ocean. J Acoust Soc Am 132(2):1207 – 1212. doi:10.1121/1.4730890.
Newton-Fisher N, Harris S, White P, Jones G. 1993. Structure and function of red fox Vulpes vulpes vocalisations. Bioacoustics 5(1 – 2):1 – 31. doi:10.1080/09524622.1993.9753228.
Oswald JN, Au WW, Duennebier F. 2011. Minke whale (Balaenoptera acutorostrata) boings detected at the Station ALOHA Cabled Observatory. J Acoust Soc Am 129(5):3353 – 3360. doi:10.1121/1.3575555.
Pijanowski BC, Farina A, Gage SH, Dumyahn SL, Krause BL. 2011. What is soundscape ecology? An introduction and overview of an emerging new science. Landscape Ecol 26(9):1213 – 1232. doi:10.1007/s10980-011-9600-8.
Pijanowski BC, Villanueva-Rivera LJ, Dumyahn SL, Farina A, Krause BL, Napoletano BM, Gage SH, Pieretti N. 2011. Soundscape ecology: the science of sound in the landscape. BioScience 61(3):203 – 216. doi:10.1525/bio.2011.61.3.6.
Riede T, Fitch T. 1999. Vocal tract length and acoustics of vocalization in the domestic dog (Canis
familiaris). J Exp Biol 202(20):2859 – 2867.
Riede T, Herzel H, Mehwald D, Seidner W, Trumler E, Bo¨ hme G, Tembrock G. 2000. Nonlinear phenomena in the natural howling of a dog-wolf mix. J Acoust Soc Am 108(4):1435 – 1442. doi:10.1121/1.1289208.
Rodden M, Rodrigues F, Bestelmeyer S. 2004. Maned wolf (Chrysocyon brachyurus). In: Sillero- Zubiri C, Hoffman M, MacDonald DW, editors. Canids: foxes, wolves, jackals and dogs. Status survey and conservation action plan. Gland and Cambridge: IUCN/SSC Canid Specialist Group; p. 38 – 43.
Sa´bato V. 2011. Aspects of the acoustic behaviour of the maned wolf Chrysocyon brachyurus (Illiger 1815) [Master’s dissertation]. Universidade Federal de Minas Gerais, Belo Horizonte, Brazil. Schassburger RM. 1993. Vocal communication in the timber wolf, Canis lupus, Linnaeus: structure,
Do wn lo ad ed b y [ 1 7 7 .2 0 .1 3 0 .1 1 ] at 1 0 :1 9 1 7 Ap ril 2 0 1 5
Swiston KA, Mennill DJ. 2009. Comparison of manual and automated methods for identifying target sounds in audio recordings of Pileated, Pale-billed, and putative Ivory-billed woodpeckers. J Field Ornithol 80(1):42 – 50. doi:10.1111/j.1557-9263.2009.00204.x.
Tembrock G. 1976. Canid vocalizations. Behav Process 1(1):57 – 75. doi:10.1016/0376-6357(76) 90007-3.
Thompson ME, Schwager SJ, Payne KB. 2010. Heard but not seen: an acoustic survey of the African forest elephant population at Kakum Conservation Area, Ghana. Afr J Ecol 48(1):224 – 231. doi:10.1111/j.1365-2028.2009.01106.x.
Thompson ME, Schwager SJ, Payne KB, Turkalo AK. 2009. Acoustic estimation of wildlife abundance: methodology for vocal mammals in forested habitats. Afr J Ecol 48(3):654 – 661. Towsey M, Parsons S, Sueur J. 2014. Ecology and acoustics at a large scale. Ecol Inform 21:1 – 3.
doi:10.1016/j.ecoinf.2014.02.002.
Urazghildiiev IR, Clark CW. 2007. Detection performances of experienced human operators compared to a likelihood ratio based detector. J Acoust Soc Am 122(1):200 – 204. doi:10.1121/1. 2735114.
Van Doren BM, Sheldon D, Geevarghese J, Hochachka WM, Farnsworth A. 2015. Autumn morning flights of migrant songbirds in the northeastern United States are linked to nocturnal migration and winds aloft. The Auk 132(1):105 – 118.
Venter PJ, Hanekom JJ. 2010. Automatic detection of African elephant (Loxodonta africana) infrasonic vocalisations from recordings. Biosyst Eng 106(3):286 – 294.
Wilden I, Herzel H, Peters G, Tembrock G. 1998. Subharmonics, biphonation, and deterministic chaos in mammal vocalization. Bioacoustics 9(3):171 – 196. doi:10.1080/09524622.1998. 9753394.
CAPÍTULO II - Temporal and environmental influences on the vocal behavior of free-ranging maned wolves (Chrysocyon brachyurus)
Luciana H.S. Rochaab, Flávio H.G. Rodriguesc & Renata S. Sousa-Limaabd
a
Laboratory of Bioacoustics, Universidade Federal do Rio Grande do Norte, Natal, Brazil
b
Graduate Program in Psychobiology, Universidade Federal do Rio Grande do Norte, Natal, Brazil
c
General Biology Department, Universidade Federal de Minas Gerais, Belo Horizonte, Brazil
d
Bioacoustics Research Program, Lab of Ornithology, Cornell University, Ithaca, NY, USA
Periódico: JOURNAL OF MAMMALOGY (Qualis B1; Fator de impacto: 2,225)